Background:We aimed to investigate prescriptions for oral anticoagulants (OACs) in atrial fibrillation (AF) newly diagnosed patients (2009-2018). Analyzing both primary and secondary prevention, we also evaluated variables associated with OAC prescription.
Methods:This study is based on data from the representative nationwide Disease Analyzer database (IQVIA). Patients with an initial AF diagnosis between 2009 and 2018 were selected and categorized as stroke or non-stroke, as well as according to their CHA2DS2-VASc score (<2 or ≥2). The prevalence of OAC use was calculated (2009-2018). We adopted multivariate logistic regression models to analyze differences.
Results:The proportion of OAC therapy increased from 32.2% in 2009 to 56.9% in 2018 in stroke patients and from 26.6% to 48.9% in non-stroke patients with CHD2DS2-VASc scores ≥2. When comparing AF patients treated with OACs in 2016-2018 versus those in 2009-2011, we observed a slight increase in age, but a considerable increase in dementia. In 2016-2018 neither age nor dementia were associated with prescription of OAC in stroke patients.
Furthermore, in stroke patients, OAC treatment was negatively associated with ischemic heart disease (IHD) (29.8% in treated versus 46.0% in non-treated patients, p<0.001). In non-stroke patients with CHA2DS2-VASc scores ≥2, OAC therapy was negatively associated with an age >80 years, peripheral artery disease, IHD, and dementia.
Conclusion:A considerable increase in OAC-treated patients with CHA2DS2-VASc scores ≥2 was noted from 2009 to 2018. There is still a restrain considering OA in AF patients in primary prevention in elderly >80 years and those with dementia.
atrial fibrillation, stroke, embolic stroke, oral anticoagulation, anticoagulants, CHA2DS2-VASc score
Oral anticoagulation (OA) is one of the most effective therapies for preventing embolic events in vascular patients with atrial fibrillation (AF) [1-6]. Over the last decade, the environment in this field has changed dramatically [1-4]. Four new agents for oral anticoagulation entered the market, providing clinicians with more options for treating their patients. Although these new oral anticoagulants (NOACs) are comparable regarding their efficacy, they possess different pharmacological properties that need to be considered when selecting a medication [7]. For clinicians, the decision-making process expanded from considering OA or not to which agent is the most effective for a particular patient. However, even the efficacy of NOACs in preventing embolic events is not superior to the standard therapy with vitamin K antagonists (VKA), with regard to bleeding risk (especially intracranial hemorrhage), data indicate a relevant benefit in case of treatment with NOACs [7]. Therefore, NOACs were not only launched as an alternative to VKAs, but also as an effective option as a standard therapy with a lower bleeding risk profile [7].
Therefore, we aimed to investigate OA prescriptions in patients newly diagnosed with AF over the last decade (2009-2018). Analyzing both primary and secondary prevention, we evaluated factors that may influence the decision for or against oral anticoagulants (OACs)
Database
This study is based on data from the Disease Analyzer database (IQVIA), which compiles drug prescriptions, diagnoses, and basic medical and demographic data obtained directly and in anonymous format from computer systems used in the practices of general practitioners and specialists [8]. Diagnoses (International Classification of Diseases, 10th revision [ICD-10]), prescriptions (Anatomical Therapeutic Chemical [ATC] Classification system), and the quality of reported data are monitored by IQVIA based on a number of criteria (e.g., completeness of documentation, linkage between diagnoses and prescriptions).
In Germany, the sampling methods used for the selection of physicians’ practices are appropriate for obtaining a representative database of general and specialized practices [8].
Study population
This study included patients with an initial AF diagnosis in the time period from January 2009 to December 2018 (index date). We separately analyzed patients with AF diagnoses following stroke diagnoses and AF patients who had no stroke diagnosis prior to the index date separately. Furthermore, we analyzed non-stroke AF patients separately by CHA2DS2-VASc score (<2 and ≥2).
Study outcome
The main outcome was the proportion of AF patients treated with anticoagulants. In stroke patients, this treatment had to be prescribed within 3 months after the index date, and in non-stroke patients it had to be prescribed within one week after the index date. Anticoagulants included vitamin K antagonists and non-vitamin-K-dependent oral anticoagulants (NOAC). We then estimated the differences in demographic and clinical baseline characteristics of patients treated in 2009-2011 versus 2016-2018. Finally, the association between demographic and clinical baseline characteristics and the probability of anticoagulant use was investigated.
Study variables
Study variables included age, sex, vascular risk factors documented within 12 months prior to the index date (hypertension, obesity, diabetes mellitus, hyperlipidemia), comorbidities documented within 12 months prior to the index date (PAD, ischemic heart diseases, dementia), and medications prescribed within 12 months prior to the index date (diuretics, beta blockers, calcium channel blockers, ACE inhibitors, angiotensin II inhibitors, statins, platelet inhibitors).
Statistical analyses
Descriptive analyses were obtained for all demographic and clinical variables, and differences between patients treated in 2009-2011 versus 2016-2018, as well as between treated and non-treated patients, were evaluated using chi-squared tests for categorical variables and the Wilcoxon signed-rank test for age. We used two multivariate logistic regression models, the first of which was intended to analyze the differences between patients treated in 2009-2011 versus 2016-2018; the time period was considered the dependent variable, while demographic characteristics, diagnoses, and therapies prior to the index date were the independent variables. In the second regression model, OAC therapy (therapy versus no therapy) was considered the dependent variable, while demographic characteristics, diagnoses, and therapies prior to the index date were the independent variables. A p-value of <0.05 was considered statistically significant. All analyses were carried out using SAS 9.4 (SAS Institute, Cary, USA).
Between 2009 and 2018, the absolute number of patients with a first-ever stroke per year remained constant (median: 287). In this group, the annual rate of individuals with a new diagnosis of AF increased from 29% in 2009 to 50.53% in 2018 (Figure 1, Table 1). The proportion of first-ever stroke patients with a new diagnosis of AF and subsequent therapy with OACs increased from 32.2% in 2009 to 56.9% in 2018 (Figure 1). In non-stroke patients, the percentage of newly diagnosed AF cases increased slightly during the period of observation (0.39% in 2009 versus 0.47% in 2018, median 0.45%), (Table 1). The percentage of patients receiving a new OAC therapy increased in the group with CHA2DS2-VASc scores <2 (18.3% in 2009 versus 39.3% in 2018) as well as in the group with CHA2DS2-VASc scores ≥2 (26.6% in 2009 versus 48.9% in 2018) (Figure 2).
Table 1. Stroke and non-stroke patients over a 10-year follow-up period
|
2009 |
2012 |
2015 |
2018 |
Patients with at least one visit during the year in question (total) |
895,234 |
878,580 |
948,129 |
976,229 |
Stroke patients (total) |
300 |
271 |
287 |
285 |
Stroke patients with AF |
87 (29.0%) |
117 (43.17%) |
136 (47.38%) |
144 (50.53%) |
Treated with anticoagulants (within 3 months after CVE) |
28 (32.2%) |
50 (42.7%) |
73 (53.7%) |
82 (56.9%) |
Non-stroke patients (total) |
894,934 |
878,309 |
947,842 |
975,944 |
Non-stroke patients diagnosed with AF (total) |
3,481 (0.39%) |
3,928 (0.45%) |
4,482 (0.47%) |
4,453 (0.47%) |
Non-stroke patients with AF with CHA2DS2-VASc scores <2 |
464 |
463 |
472 |
453 |
Treated with anticoagulants |
85 (18.3%) |
119 (25.7%) |
169 (35.8%) |
178 (39.3%) |
Non-stroke patients with AF with CHA2DS2-VASc scores ≥2 |
3017 |
3465 |
4010 |
4000 |
Treated with anticoagulants after diagnosis of AF |
772 (26.6%) |
1,247 (36.0%) |
1,797 (44.8%) |
1,956 (48.9%) |
ǁrefers to atrial fibrillation; *refers to oral anticoagulation; $refers to peripheral artery disease
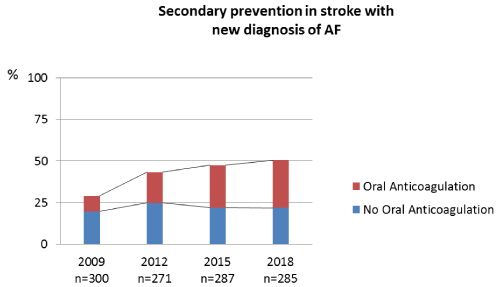
Figure 1. Oral anticoagulation after detection of atrial fibrillation in acute stroke
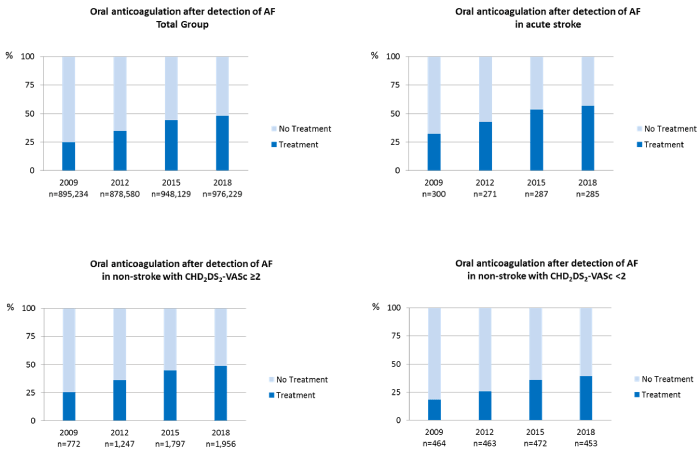
Figure 2. Oral anticoagulation after the diagnosis of atrial fibrillation
Comparing stroke patients with AF treated with OACs in 2009-2011 versus 2016-2018, we noted a slight increase in age (mean 74.6 versus 76.2 years); in this group, the proportion of patients with dementia increased from 7.4% in 2009-2011 to 12.6% in 2016-2018, whereas the percentage of patients with ischemic heart disease decreased from 47.9% to 29.8% (p=0.001) (Table 2).
Table 2. Differences between stroke patients with AF treated with anticoagulants in the period from 2009 to 2011 versus 2016 to 2018
|
Stroke patients with
AFǁ treated with OAC†
(n=349) |
p* |
p** |
|
2009-2011
(n=116) |
2016-2018
(n=233) |
|
|
Age (mean, SD) |
74.6 (9.8) |
76.2 (9.7) |
0.127 |
0.173 |
Age ≤50 |
2.5 |
2.1 |
0.397 |
0.525 |
Age 51-60 |
5.0 |
5.5 |
Age 61-70 |
23.1 |
15.1 |
Age 71-80 |
34.7 |
42.0 |
Age >80 |
34.7 |
35.3 |
Sex |
|
|
|
|
Male |
47.1 |
46.6 |
0.933 |
0.971 |
Female |
52.9 |
53.4 |
Vascular risk factors |
|
|
|
|
Hypertension |
82.6 |
88.2 |
0.145 |
0.080 |
Obesity |
13.2 |
16.8 |
0.376 |
0.311 |
Diabetes mellitus |
33.1 |
33.6 |
0.916 |
0.750 |
Hyperlipidemia |
56.2 |
61.3 |
0.348 |
0.947 |
Comorbidities |
|
|
|
|
PAD$ |
10.7 |
10.1 |
0.846 |
0.897 |
Ischemic heart diseases |
47.9 |
29.8 |
0.007 |
0.001 |
Dementia |
7.4 |
12.6 |
0.137 |
0.059 |
Medication |
|
|
|
|
Intake of diuretics |
47.9 |
37.4 |
0.055 |
0.279 |
Intake of beta blockers |
66.9 |
62.2 |
0.375 |
0.528 |
Intake of calcium channel blockers |
25.6 |
32.4 |
0.189 |
0.210 |
Intake of ACE¥ inhibitors |
58.7 |
48.7 |
0.079 |
0.041 |
Intake of angiotensin II inhibitors |
25.6 |
28.2 |
0.611 |
0.777 |
Intake of statins |
56.2 |
67.2 |
0.040 |
0.003 |
Prior intake of platelet inhibitors |
45.5 |
39.5 |
0.279 |
0.753 |
ǁrefers to atrial fibrillation; †refers to oral anticoagulation; *refers to p-value calculated in the univariate analysis; **refers to p-value calculated in the logistical regression analysis; ¥refers to angiotensin-converting enzyme; $refers to peripheral artery disease
The comparison between 2009-2011 and 2016-2018 in patients with CHA2DS2-VASc scores ≥2 and treated with OACs after their diagnosis of AF revealed an age increase over time (74.0 years versus 76.3 years, p<0.001); likewise, the proportion of patients with dementia increased from 4.3% in the period from 2009-2011 to 8.7% in the period from 2016-2018 (p=0.001) (Table 3).
Table 3. Differences between non-stroke patients with AF and CHA2DS2-VASc scores ≥2 treated with anticoagulants in the period from 2009 to 2011 versus 2016 to 2018
|
Non-stroke patients with
AFǁ and CHA2DS2-VASc scores ≥2 treated with OAC†
(n=8,440) |
p* |
p** |
|
2009-2011
(n=2,680) |
2016-2018
(n=5,760) |
|
|
Age (mean, SD) |
74.0 (8.2) |
76.3 (9.2) |
<0.001 |
<0.001 |
Age ≤50 |
1.2 |
1.1 |
<0.001 |
<0.001 |
Age 51-60 |
4.9 |
4.5 |
Age 61-70 |
24.1 |
18.4 |
Age 71-80 |
47.7 |
41.3 |
Age >80 |
22.0 |
34.7 |
Sex |
|
|
|
|
Male |
48.9 |
47.4 |
0.183 |
0.490 |
Female |
51.1 |
52.6 |
Vascular risk factors |
|
|
|
|
Hypertension |
88.3 |
89.5 |
0.098 |
0.053 |
Obesity |
16.1 |
19.5 |
<0.001 |
<.0001 |
Diabetes mellitus |
36.2 |
37.7 |
0.176 |
0.347 |
Hyperlipidemia |
52.8 |
55.2 |
0.039 |
0.765 |
Comorbidities |
|
|
|
|
PAD$ |
10.4 |
11.4 |
0.156 |
0.236 |
Ischemic heart diseases |
41.9 |
41.3 |
0.587 |
0.037 |
Dementia |
4.3 |
8.7 |
<0.001 |
<.0001 |
Medication |
|
|
|
|
Intake of diuretics |
41.4 |
42.0 |
0.532 |
0.456 |
Intake of beta blockers |
68.2 |
67.8 |
0.716 |
0.930 |
Intake of calcium channel blockers |
35.2 |
32.7 |
0.020 |
<0.001 |
Intake of ACE¥ inhibitors |
50.5 |
42.8 |
<0.001 |
<0.001 |
Intake of angiotensin II inhibitors |
26.4 |
32.8 |
<0.001 |
0.008 |
Intake of statins |
36.1 |
38.8 |
0.016 |
<0.001 |
Prior intake of platelet inhibitors |
31.4 |
29.0 |
0.040 |
<0.001 |
ǁrefers to atrial fibrillation; †refers to oral anticoagulation; *refers to p-value calculated in the univariate analysis; **refers to p-value calculated in the logistical regression analysis; ¥refers to angiotensin-converting enzyme; $refers to peripheral artery disease
In the latest period (2016-2018), stroke patients exhibited no differences between those treated with OACs versus those with no treatment regarding the factors of age (treatment versus no treatment: 76.2 years versus 75.7 years, p=0194) and dementia (treatment versus no treatment: 12.6% versus 12.3%). In this group, no treatment was associated with concomitant ischemic heart disease (treatment versus no treatment: 29.8% versus 46.0%, p>0.001) (Table 4). In non-stroke patients with CHA2DS2-VASc scores ≥2 the restraint in prescribing OACs was associated with an age of >80 years (treatment versus no treatment: 34.7% versus 37.1%, p>0.001), as well as the presence of a peripheral artery disease, ischemic heart disease, and dementia (Table 5).
Table 4. Factors associated with prescription of OAC in stroke patients 2016-2018 (secondary prevention)
|
Stroke patients with
AFǁ
2016-2018
(n=425) |
p* |
p** |
|
Treated with OAC†
(n=233) |
Not treated with OAC†
(n=192) |
|
|
Age (mean, SD) |
76.2 (9.7) |
75.7 (11.9) |
0.996 |
0.194 |
Age ≤50 |
2.1 |
4.8 |
0.458 |
0.042 |
Age 51-60 |
5.5 |
7.0 |
Age 61-70 |
15.1 |
16.0 |
Age 71-80 |
42.0 |
36.4 |
Age >80 |
35.3 |
35.8 |
Sex |
|
|
|
|
Male |
46.6 |
53.5 |
0.162 |
0.185 |
Female |
53.4 |
46.5 |
Vascular risk factors |
|
|
|
|
Hypertension |
88.2 |
87.2 |
0.738 |
0.731 |
Obesity |
16.8 |
13.9 |
0.412 |
0.215 |
Diabetes mellitus |
33.6 |
38.5 |
0.297 |
0.463 |
Hyperlipidemia |
61.3 |
59.9 |
0.761 |
0.732 |
Comorbidities |
|
|
|
|
PAD$ |
10.1 |
11.2 |
0.703 |
0.709 |
Ischemic heart diseases |
29.8 |
46.0 |
<0.001 |
<0.001 |
Dementia |
12.6 |
12.3 |
0.925 |
0.733 |
Medication |
|
|
|
|
Intake of diuretics |
37.4 |
46.0 |
0.074 |
0.046 |
Intake of beta blockers |
62.2 |
64.2 |
0.674 |
0.390 |
Intake of calcium channel blockers |
32.4 |
35.3 |
0.524 |
0.236 |
Intake of ACE¥ inhibitors |
48.7 |
49.7 |
0.839 |
0.295 |
Intake of angiotensin II inhibitors |
28.2 |
21.4 |
0.111 |
0.032 |
Intake of statins |
67.2 |
57.9 |
0.045 |
0.042 |
Prior intake of platelet inhibitors |
39.5 |
35.8 |
0.439 |
0.237 |
ǁrefers to atrial fibrillation; *refers to p-value calculated in the univariate analysis; **refers to p-value calculated in the logistical regression analysis; †refers to oral anticoagulation; ¥ refers to angiotensin-converting enzyme; $refers to peripheral artery disease
Table 5. Factors associated with prescription of OAC in non-stroke patients with AF and CHA2DS2-VASc scores ≥2, 2016-2018 (primary prevention)
|
Non-stroke patients with
AFǁ and CHA2DS2-VASc scores ≥2
2016-2018
(n=12,065) |
p* |
p** |
|
Treated with OAC†
(n=5,760) |
Not treated with OAC†
(n=6,305) |
|
|
Age (mean, SD) |
76.3 (9.2) |
76.1 (10.9) |
0.153 |
0.002 |
Age ≤50 |
1.1 |
2.7 |
<0.001 |
<0.001 |
Age 51-60 |
4.5 |
6.2 |
Age 61-70 |
18.4 |
17.0 |
Age 71-80 |
41.3 |
37.0 |
Age >80 |
34.7 |
37.1 |
Sex |
|
|
|
|
Male |
47.4 |
47.1 |
0.803 |
0.057 |
Female |
52.6 |
52.9 |
Vascular risk factors |
|
|
|
|
Hypertension |
89.5 |
86.7 |
<0.001 |
0.617 |
Obesity |
19.5 |
19.4 |
0.861 |
0.421 |
Diabetes mellitus |
37.7 |
40.8 |
<0.001 |
<0.001 |
Hyperlipidemia |
55.2 |
53.5 |
0.074 |
0.180 |
Comorbidities |
|
|
|
|
PAD$ |
11.4 |
14.3 |
<0.001 |
<0.001 |
Ischemic heart diseases |
41.3 |
45.6 |
<0.001 |
<0.001 |
Dementia |
8.7 |
11.5 |
<0.001 |
<0.001 |
Medication |
|
|
|
|
Intake of diuretics |
42.1 |
43.3 |
0.174 |
<0.001 |
Intake of beta blockers |
67.8 |
59.5 |
<0.001 |
<0.001 |
Intake of calcium channel blockers |
32.7 |
28.1 |
<0.001 |
<0.001 |
Intake of ACE¥ inhibitors |
42.8 |
37.4 |
<0.001 |
<0.001 |
Intake of angiotensin II inhibitors |
32.8 |
28.1 |
<0.001 |
<0.001 |
Intake of statins |
38.8 |
36.9 |
0.039 |
0.791 |
Prior intake of platelet inhibitors |
29.0 |
26.7 |
0.005 |
0.002 |
ǁrefers to atrial fibrillation; *refers to p-value calculated in the univariate analysis; **refers to p-value calculated in the logistical regression analysis; †refers to oral anticoagulation; ¥ refers to angiotensin-converting enzyme; $refers to peripheral artery disease
Although the percentage of patients with a recent diagnosis of AF treated with OA increased remarkably from 2009 to 2018 in the primary prevention (26.6% to 48.9%) and in the secondary prevention group (32.2% to 56.9%), many patients received an alternative to OACs even when a CHA2DS2-VASc score ≥2 was documented. In comparison to 2009-2011, more recently (2016-2018) an increased number of elderly patients and patients with dementia were treated with OACs. However, in 2016-2018, the restraint in prescribing OACs was associated with the presence of ischemic heart disease, in both the secondary and primary prevention group. In patients with a previous stroke neither age nor dementia influenced the decision for or against OA. In the primary prevention group, an age >80 years, concomitant peripheral artery disease, and dementia were all associated with restraint in prescribing AOCs.
The previously mentioned prescription increase may be due to the release of NOACs, as they represented a new alternative to the standard therapy with VKAs. However, it may also be speculated that this increase could be partly determined by increasing general knowledge of the efficacy of oral anticoagulation in preventing embolic events in AF patients. The release of NOACs was accompanied by extensive promotional campaigns. In addition to conveying information about NOACs, they thus propagated the background of AF and OA, resulting in increased awareness. Although the evidence for the efficacy and especially the safety of OA in elderly patients was sufficiently demonstrated prior to the release of NOACs, the restraint, especially among elderly individuals, clearly diminished after NOACs were introduced [9]. The mean age of treated patients increased from 74 to 76 years during the period of observation. In the period from 2016-2018, the decision for or against OA was not affected by age. The same trend could be observed regarding the factor dementia. Meanwhile, the proportion of treated patients with dementia doubled between the period from 2009-2011 and the period from 2016-2018; this factor had no influence on the selection of OACs in the secondary prevention group (2016-2018). By contrast, in the primary prevention, dementia and the parameter age >80 years were both still associated with lower prescription adherence to OA. However, as NOACs were proven effective in preventing embolic events and superior to VKAs with respect to the risk of bleeding, they should be considered as a first option for this indication, even if the patient is of advanced age but no restrictions for AO. Although the general trend depicted in our study suggests increasing adherence in prescribing OACs, care delivery clearly has some gaps that should be considered in educational programs. While the deprescribing of medications for dementia patients and the elderly is currently an issue of debate, the indication for OACs should be evaluated with caution with regard to potential consequences [10-13].
By the period from 2016 to 2018, the proportion of stroke patients with ischemic heart disease (IHD) treated with OACs had decreased from 47.9% (2009-2011) to a value of 28.9%. Even thought subgroups in this analysis are small, this observation may be the result of intensified care in IHD, detecting AF in advance and treating it accordingly to prevent a first CVE. In this context, extended screening methods for AF in patients at risk, ranging from implanting specific devises for continuous monitoring of the heart rhythm to opportunistic screening for AF in pharmacies, may also have contributed to this development [14-17]. However, in the remaining stroke patients with newly detected AF, concomitant IHD resulted in uncertainty regarding the treatment with OACs. The same trend, but less pronounced, was observed in the primary prevention. Our data unveiled the imponderability clinicians are facing when determining which disease the treatment strategy should prioritize. For IHD, platelet inhibitors are the preferable therapy, while OA are necessary to prevent embolic events in AF patients [7,18,19]. Nevertheless, the lack of evidence regarding the dual intake of platelet inhibitors and OACs may have been resolved in recent years. Studies were conducted, providing important information about the situation in which a therapy combination of platelet inhibitors and OACs is both necessary and safe [20-22].
Our data are extracted from clinical files documented without rigorous protocols in care delivery. Therefore, several limitations need to be considered when interpreting our results. First, no data were available regarding patients’ smoking and alcohol use status, both of which are risk factors for developing AF. Second, since the regression used for propensity scores did not include the identification number of general practices, the distribution of these practices may differ between cases and controls. Third, no information about death was provided, and since stroke has a significant impact on survival, this limitation is particularly important. Finally, we were unable to identify patients’ etiology for stroke, and the stroke severity, which would have enabled us to verify to what extent later detection of AF and OACs may explain the results.
Nevertheless, the analysis of these data is important when pursuing the improvement of the quality of care delivery. One of the strengths of our study is the high number of patients and the long follow-up period. To avoid bias regarding stroke mimics amongst TIA patients, we included only ischemic stroke in our analysis; up to 30% of TIA cases are stroke mimics rather than real cerebrovascular events [23].
Our data provide important information regarding care delivery in newly diagnosed AF patients and the subsequent therapy for primary and secondary prevention. A great increase in patients with CHA2DS2-VASc scores ≥2 was noted from 2009 to 2018. We still observed restraint regarding OA use in AF patients. In primary prevention, elderly patients >80 years of age and those with dementia were neglected when considering OA. Some recently published studies may close the evidence gap regarding the restraint concerning OA use in individuals with IHD and mandatory therapy with antiplatelets.
We received no funding for this study.
All authors report to have no conflicts of interest or competing interests related to the current manuscript.
- Connolly SJ, Ezekowitz MD, Yusuf S, Eikelboom J, Oldgren J, et al. (2009) Dabigatran versus warfarin in patients with atrial fibrillation. N Engl J Med 361: 1139-1151.
- Giugliano RP, Ruff CT, Braunwald E, Murphy SA, Wiviott SD, et al. (2013) Edoxaban versus warfarin in patients with atrial fibrillation. N Engl J Med 369: 2093-104.
- Patel MR, Mahaffey KW, Garg J, Pan G, Singer DE, et al. (2011) Rivaroxaban versus warfarin in nonvalvular atrial fibrillation. N Engl J Med 365: 883-891.
- Granger CB, Alexander JH, McMurray JJ, Lopes RD, Hylek EM, et al. (2011) Apixaban versus warfarin in patients with atrial fibrillation. N Engl J Med 365: 981-992.
- Amarenco P, Bogousslavsky J, Callahan A III, Goldstein LB, Hennerici M, et al. (2006) High-dose atorvastatin after stroke or transient ischemic attack. N Engl J Med 355: 549-559.
- Yuan J, Xu GM, Ding J (2019) Aspirin Versus Clopidogrel Monotherapy for the Treatment of Patients with Stable Coronary Artery Disease: A Systematic Review and Meta-Analysis. Adv Ther 36: 2062-2071.
- Eikelboom JW, Quinlan DJ, Hirsh J, Connolly SJ, Weitz JI (2017) Laboratory Monitoring of Non-Vitamin K Antagonist Oral Anticoagulant Use in Patients With Atrial Fibrillation: A Review. JAMA Cardiol 2: 566-574.
- Rathmann W, Bongaerts B, Carius HJ, Kruppert S, Kostev K (2018) Basic characteristics and representativeness of the German Disease Analyzer database. Int J Clin Pharmacol Ther 56: 459-466.
- Mihas C, Alevizos A, Arapaki A, Mariolis A (2007) Warfarin versus aspirin for stroke prevention (BAFTA). Lancet 370: 1606-1607.
- Reeve E, Denig P, Hilmer SN, Ter MR (2016) The Ethics of Deprescribing in Older Adults. J Bioeth Inq 13: 581-590.
- Clyne B, Cooper JA, Boland F, Hughes CM, Fahey T, et al. (2017) Beliefs about prescribed medication among older patients with polypharmacy: a mixed methods study in primary care. Br J Gen Pract 67: e507-e518.
- Curtin D, Dukelow T, James K, O'Donnell D, O'Mahony D, et al. (2019) Deprescribing in multi-morbid older people with polypharmacy: agreement between STOPPFrail explicit criteria and gold standard deprescribing using 100 standardized clinical cases. Eur J Clin Pharmacol 75: 427-432.
- Neefs J, Klamer TA, Krul SPJ, de Groot JR (2019) Should Every Patient With Atrial Fibrillation and a CHA2DS2-VASc Score of 1 Be Anticoagulated? A Systematic Review of 37,030 Patients. Cardiol Rev 27: 249-255.
- Thijs VN, Brachmann J, Morillo CA, Passman RS, Sanna T, et al. (2016) Predictors for atrial fibrillation detection after cryptogenic stroke: Results from CRYSTAL AF. Neurology 86:261-269.
- Bacchini M, Bonometti S, Del ZF, Lechi A, Realdon F, et al. (2019) Opportunistic Screening for Atrial Fibrillation in the Pharmacies: A Population-Based Cross-Sectional Study. High Blood Press Cardiovasc Prev 10: 334.
- Halcox JPJ, Wareham K, Cardew A, Gilmore M, Barry JP, et al. (2017) Assessment of Remote Heart Rhythm Sampling Using the AliveCor Heart Monitor to Screen for Atrial Fibrillation: The REHEARSE-AF Study. Circulation 2017 136: 1784-1794.
- Desteghe L, Raymaekers Z, Lutin M, Vijgen J, Dilling-Boer D, et al. (2017) Performance of handheld electrocardiogram devices to detect atrial fibrillation in a cardiology and geriatric ward setting. Europace 19: 29-39.
- Levine GN, Bates ER, Bittl JA, Brindis RG, Fihn SD, et al. (2016) 2016 ACC/AHA Guideline Focused Update on Duration of Dual Antiplatelet Therapy in Patients With Coronary Artery Disease: A Report of the American College of Cardiology/American Heart Association Task Force on Clinical Practice Guidelines. J Am Coll Cardiol 68: 1082-1115.
- Wang D, Yang XH, Zhang JD, Li RB, Jia M, et al. (2018) Compared efficacy of clopidogrel and ticagrelor in treating acute coronary syndrome: a meta-analysis. BMC Cardiovasc Disord 18: 217-0948.
- Grajek S, Olasinska-Wisniewska A, Michalak M, Solomon RS (2019) Triple versus double antithrombotic therapy in patients with atrial fibrillation and stent implantation. A meta-analysis of randomized trials. Kardiol Pol 10.
- Korjian S, Braunwald E, Daaboul Y, Mi M, Bhatt DL, et al. (2018) Usefulness of Rivaroxaban for Secondary Prevention of Acute Coronary Syndrome in Patients With History of Congestive Heart Failure (from the ATLAS-ACS-2 TIMI-51 Trial). Am J Cardiol 122: 1896-1901.
- Badjatiya A, Rao SV (2019) Advances in Antiplatelet and Anticoagulant Therapies for NSTE-ACS. Curr Cardiol Rep 21: 3-1090.
- Liberman AL, Prabhakaran S (2017) Stroke Chameleons and Stroke Mimics in the Emergency Department. Curr Neurol Neurosci Rep 17: 15-0727.