Background: Cerebral small vessel disease (SVD) is the most common cause of vascular dementia and age-related cognitive decline. In India the prevalence of vascular dementia is 31.9 / 1000 population.radiological evidence of leukoaraiosis is very common in persons in the 8th decade but it does not always correlates with clinical evidence of cognitive decline. Therefore an attempt is made to identify any factor/factors which are concerned with progression to cognitive impairment in some of these persons.
Patients and methods: 120 cases and 104 controls who satisfied the radiological criteria for SVD were included and evaluated with complete neuropsychological assessment. Genotype analysis for 10 SNPs (ACE I/D, rs4343, rs4351, AGT M235T, CYP11B2 344T/C, AT1R 1166A/C, AT1R -153A/G, eNOS 4b/4a, eNOS 786T/C, eNOS 894G/T), ACE activity and Plasma NOx levels were determined.
Results: Genotype frequency distribution for ACE I/D, rs4343, rs4351, AGT M235T, and CYP11B2 344T/C, did not find any significant difference between cases and control. Mutant genotype eNOS 4b/4a and 786T/C SNPs showed a possible protective role, and TT genotype of 894G/T SNP showed a risk of 10.79 fold. The odds ratio for all the SNPs was not statistically significant. Although significant increase ACE activity in subjects with DD genotype was observed, no significant difference was observed when cases were compared with controls. Plasma NOX concentration was not significantly different between cases and controls for the selected eNOS polymorphisms.
Conclusions: Analysis of cognitive function test score with genotypes indicated significant variation in NNPB - scores of control subjects with ACE gene polymorphisms with mutant genotypes of the selected ACE gene SNPs showing higher score than wild genotypes. The differently prevalent genotype identified in this study has to be applied to larger population to confirm the protective or the otherwise role of the above SNPs.
cerebral small vessel disease, vascular cognitive impairment, determinants
Conversion of radiological small vessel disease to vascular dementia is multifactorial and probably there is an imbalance between the protective and non-protective factors in those who become symptomatic. Angiotensin converting enzyme inhibitors are probably the drugs of choice in high blood pressure treatment in view of the role of rennin angiotensin aldosterone pathway in the pathogenesis of hypertension and small vessel disease. The OR values for wild v/s mutant genotypes eNOS 4b/4a and 786T/C SNPs showed a possible protective role, and TT genotype of 894G/T SNP showed a risk of 10.79 fold.
Dementia of vascular origin is the end result of several factors both protective and destructive. Small vessel disease (SVD) of the brain is very special as they behaves in a wide spectrum of patterns varying from just a radiological appearance to frank dementia. Clinical features are often closer to degenerative dementia showing a steady deterioration, rapid progression if not attended to, static or even regressive course. Therefore probably it may be one which can have more modifiable factors which protects some of these persons and just leaves them as radiologically isolated cases and others severely demented.
SVD results from ischemia in the distribution of deep perforating arteries and presents as lacunar infarction, leukoaraiosis and micro bleeds. In India the prevalence of vascular dementia is about 31.9 per thousand populations [1]. Radiological evidence of leukoaraiosis is a very common finding in the normal elderly and is considered as the radiological correlate of Binswanger’s disease [2]. 10 % of people aged 50 to 75 years show this feature but its relationship to disease is more complex. CSF and serum albumin ratio in patients with vascular cognitive dysfunction correlates with the degree of leukoaraiosis suggesting there is blood brain barrier damage [2]. Failure of endothelial dysfunction and non-amyloid angiopathy are also considered responsible and it is found to predict risk of strokes, falls, and dementia [3]. Fazekas et al demonstrated small punctate hyperintensities to confluent lesions, which are ischemic with myelin loss, gliosis and micro infarction [2]. The commonly associated cognitive deficits are information processing speed and executive function [4,5]. However, it is observed that even fully quantitative volumetric measurements of leukoaraiosis correlate weakly with cognitive and physical dysfunctions. Fazekas et al (1987) scoring gives global information on the white matter changes [6]. These lesions were common in patients with hypertension [7]. And distribution of lesions did have influence on the phenotype [8]. The factors which are considered contributory are Diabetes mellitus, Substance dependence, Trauma, Radiation, Psychotropic drugs, Western type of diet habits apart from genetic factors and levels of neurotropic factors in cerebrospinal fluid [9,10]. However factors protective or otherwise with reference to dementia in persons with asymptomatic small vessel vasculopathy [11]. may be of help in identifying treatment options in these patients
Postmortem studies indicate that 15% to 34% of dementia patients show significant vascular pathology, either alone or in combination with Alzheimer disease (AD) pathology suggesting substantial overlap between AD and vascular dementia [12]. Vascular amyloid angiopathy is the most common vascular lesion reported in AD. Vascular risk factors such as hypertension, arterial disease or atherosclerosis, ischemic heart disease, raised homocysteine, smoking, and diabetes mellitus are also risk factors for AD, and markers of systemic vascular disease (eg: hypercholesterolemia) are associated with the etiopathogenesis of AD. These vascular pathologies may cause localized or global hypo perfusion (oligaemia), which may lead to AD pathology, white-matter lesions, or both. Genetic factors such as apolipoprotein E may modify the progression of even AD in the presence of vascular disease [13,14].
The common risks are Age, gender , vascular risk factors, genetic factors and inflammation, exposure to pesticide, psychological stress or life events, dietary fat intake, family history of stroke, etc. potential protective factors are high educational attainment, eating fish or shellfish, physical exercise, use of supplementary antioxidants like Vitamins E and C, use of Vitamin B12, Mediterranean diet, etc.
Post-stroke dementia may be the direct consequence of vascular lesions in the brain or pre-existing neuropathology related to AD, genetic factors like HCHWA-D (a syndrome of primarily hemorrhagic strokes and dementia), caused by a mutation in the gene for amyloid precursor protein (APP) that causes abnormal deposition of amyloid in the walls of leptomeningeal arteries and cortical arterioles , cerebral amyloid angiopathy [CAA]. NOTCH3 gene mutation causeing CADASIL etc. Second class of gene are those that render the brain more or less susceptible to injury in response to cerebrovascular disease. Evidence for the existence of such response genes is that patients with apparently similar loads of vascular pathology have different clinical course.
Fabry's an X-linked disease .gene polymorphisms of interleukin 6and 1, endothelial nitric oxide synthase, factor V, and protein Z ,TNFα, toll-like receptor 4, P-selectin and E-selectin, C-reactive protein, lipid metabolism (apolipoprotein E, paraoxonase, epoxide hydrolase), nitric oxide release, and extracellular matrix (matrix metalloproteinases) .Genes in the AD pathway, the presenilins, APP, and apolipoprotein E (apoE), are known to cause VCI .
Therefore factors which will convert a radiological small vessel disease to vascular cognitive impairment is probably multi factorial and insight in to the factors may be of great clinical relevance as there is degeneration and vascular pathology coexistent in both vascular and degenerative dementias. .
Persons with radiological evidence of SVD were included for the study. Proper informed consent was taken from all patients. They were submitted for all mandatory work up for dementia including detailed neuropsychiatry work up and demographic details of vascular risks. Patients with subcortical infarction >1.5 cm diameter, cortical infarction of any size, a potential source of cardiac source of embolism (Adams et al., 1993), and large vessel cerebrovascular disease, defined as carotid or vertebral artery stenosis >50%, mixed dementia, and past history of CNS dysfunction were excluded.. Then they were grouped in to study group consisting of persons who had features of cognitive dysfunction and control group who did not have cognitive dysfunction. A total of 404 persons with entry criteria of significant radiological SVD were identified. However 4 of them passed away and rest could not complete the mandatory work up due to personal reasons as all patients were evaluated on outpatient basis only and therefore only 224 persons could be included. 120 cases and 104 controls who had radiological evidence of SVD but no cognitive dysfunction. They were evaluated for comorbidities as well as the following.
Hindi Mental Status Examination (HMSE), DSMIV for vascular cognitive decline and Hachinski Ischemic Scores, Angiotensin converting enzyme (ACE) gene polymorphisms rs 4646994, SNP rs4343 and rs4351 ,AGT-M235T(rs699), Aldosterone synthase polymorphism (CYP11B2-344T/C),(rs1799998), Angiotensin receptor gene polymorphism (ATIR 1166A/C,-153A/G),Endothelial nitric oxide gene polymorphism (eNOS4b/4a,786T/C,894G/T) were done. Biochemical tests done were serum angiotensin converting enzyme activity (ACE), plasma nitric oxide levels (NOx).
After explaining details of the research to the participating subjects and obtaining a written informed consent, the following have been carried out. The participants were reviewed by one neurophysician and senior resident in neurology as per protocol. 5 ml venous blood collected after an overnight fast from the median cubital vein for the genotyping and biochemical assay.
Duration of study: 3 years from 01-02-2013 to 31-03-2016.
Statistical analysis was done using SPSS 16.0 (IBM CORPORATION USA) and Graphpad prism v.5.0.1 (graph pad software USA) categorical variables analyzed using chi-square test and continuous parameters using t-test. The allele frequencies were compared between groups with the chi-square test. Univariate odds ratio (OR) and 95% confidence intervals (CI) were estimated. The combined effect was determined by the generation of a contingency table for logistic regression analysis, p value <0.05 was considered to be statistically significant.
MRI, axial T2-weighted images were assessed using Fazekas score for white matter changes as this scale has been shown to reflect pathological severity of cerebral SVD in a post-mortem studies [15]. Leukoaraiosis rated as: 1= absent or mild (equivalent to Fazekas periventricular score <2); 2= moderate (Fazekas scale 3); 3 = severe (more than half of the hemispheric white matter involved). In addition we have scored the number of lacunar infarcts and as follows: 1 = <2 lesions; 2 = 3 ± 5 lesions; 3 = >5 lesions. Separate scores were generated for small (<5 mm maximal diameter) and large (6 ± 14 mm maximal diameter) focal lesions. Isolated lacunar infarction has been defined as at least one focal lesion and a leukoaraiosis score of 1 (absent or mild). Ischemic leukoaraiosis have been defined as at least one focal lesion and a leukoaraiosis score of 2±3, Fazekas scoring 4 (figure 1 & 2).
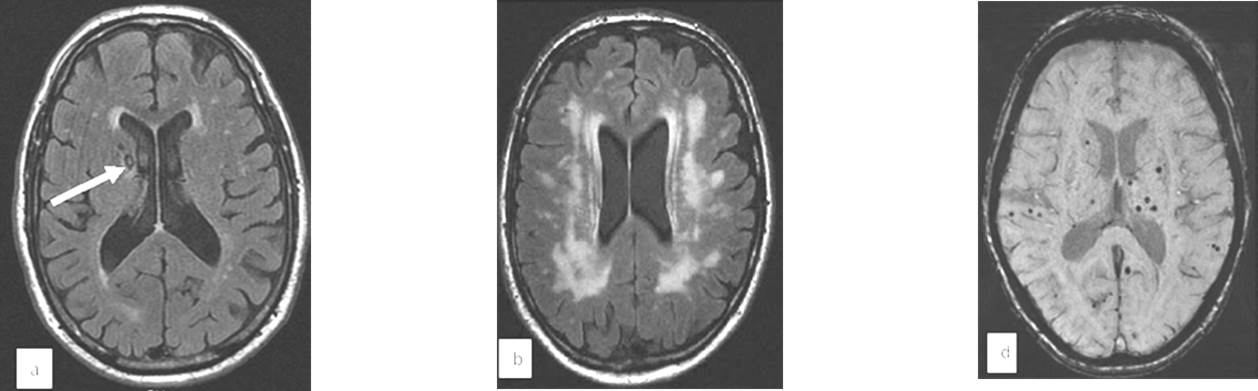
Figure 1. shows MRI features of SVD. Leukoaraiosis, micro bleeds and lacunar strokes.
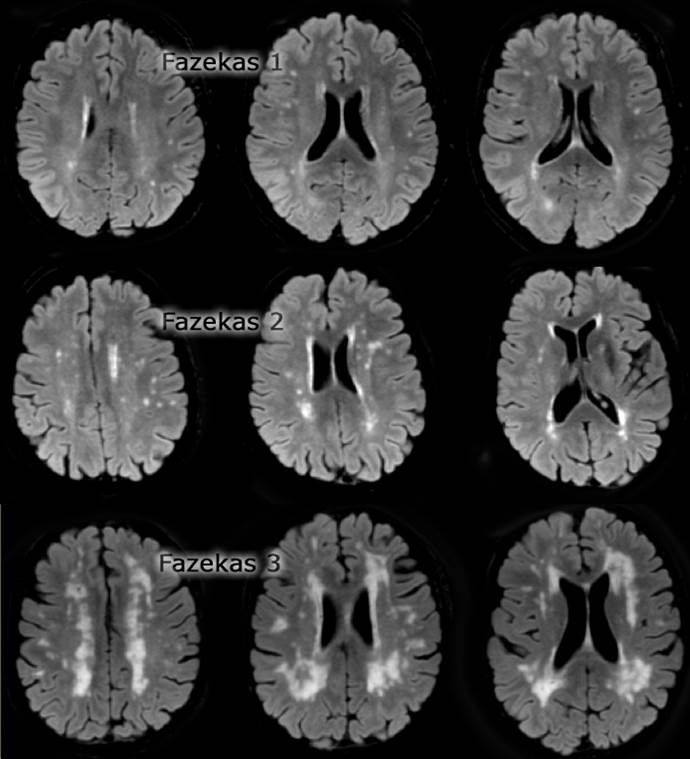
Figure 2. Fazekas scoring of Leukoaraiosis.
1. Finger tapping test and digit symbol substitution test for Mental and motor speed,
2. Digit vigilance, digit forward and digit backward for attention,
3. Category fluency, phonemic fluency, tower of London test, Wisconsin card sorting test, for executive function,
4. Auditory verbal learning test for comprehension learning and memory,
5. Stick test/complex figure of ray for visuospatial construction test
The information obtained with the above test was compared with data of age, education, and gender matched control normative data.
DNA Isolation
DNA was isolated from EDTA blood using phenol-chloroform-isoamyalcohol protocol (Sambrook et.al. 2001).
Quantification of DNA:
Quantification of DNA was done using Nanodrop ® 2000C (Thermo scientific, USA) according to manufacturer instruction.
Genotyping
Determination of genotypes was performed by RFLP (restriction fragment length polymorphism) and RT-PCR (real time-polymerase chain reaction) methods. DNA sequencing of samples with known genotype was carried out to confirm the results.
Angiotensin converting enzyme (ACE) gene polymorphisms (rs4646994, rs4343, rs4351)
ACE I/D (Angiotensin converting enzyme - insertion/deletion, rs4646994) polymorphism was studied by direct PCR method using forward primer5’-CTG GAG ACC ACT CCC ATC CTT TCT-3’ and 5’GAT GTG GCC ATC ACA TTC GTC AG-3’ as reverse primer. Amplification reaction was performed using reaction mixture of 25μl containing 50-100ng DNA template, PCR buffer (1X), 1.5mMol MgCl2, 200 μMol of each dNTPs, 10pmoles each primer, and 2.5U of Taq polymerase. DNA was amplified for 35cycles with denaturation at 94°C/30sec, annealing at 58°C/20 sec and extension at 72°C/30sec using Eppendorf thermal cycle (Eppendorf India. Pvt. ltd). The PCR product was analyzed on 2.0% agarose gel electrophoresis and captured using gel documentation system (Bio-rad, USA). A single band of 190bp was observed in DD genotype, 490bp in II genotype, and both bands in heterozygous ID genotype (Figure 3)
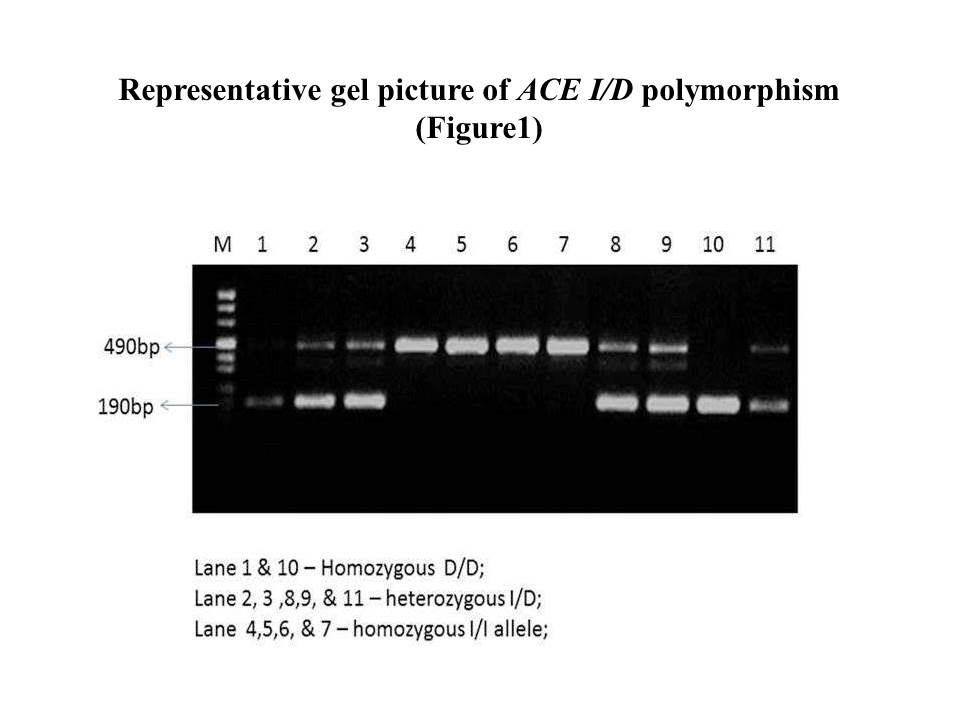
Figure 3. ACE Insertion /Deletion polymorphism.
SNP genotype analysis of ACE 2350A>G (rs4343), ACE 63492371G>A (rs4351) polymorphism were determined by real-time PCR using TaqMan®Genotype probe assay. The RT-PCR method was performed according to the manufacturer’s instruction (Invitrogen bioscience India Pvt. Ltd., India). The PCR reaction mix contains 5μl TaqMan® genotype Master Mix (# 4371353), 0.25μl TaqMan®genotype probe, 1μl of 5-20ng template DNA, and nuclease free water to make up total reaction volume to 10μl. The reaction conditions were 95°C /10min enzyme activation, followed by 40cycles of 95°C/15sec for denaturation, 60°C for 1min annealing and extension. The genotype was determined based on the difference in fluorescence (ΔRn) of the reporter dye (VIC/FAM) associated with the probe (Figure 4).
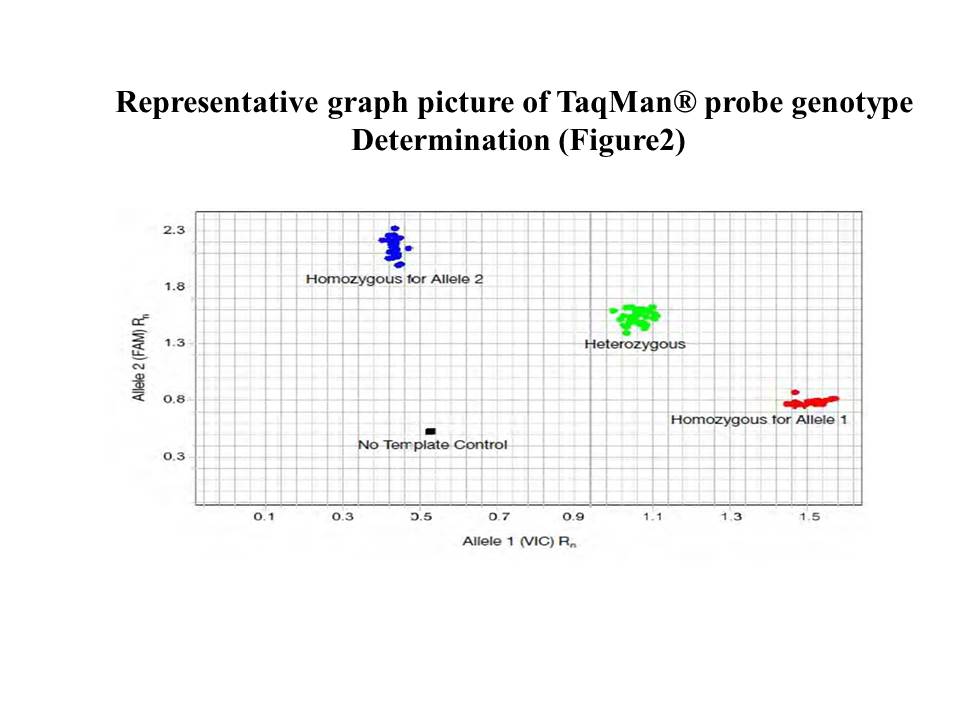
Figure 4. allelic discrimination plot of TaqMan® probe genotype determination
II. Angiotensinogen (AGT) gene polymorphism -AGT M235T (rs699)
AGT M235T (rs699) is a polymorphism in angiotensinogen gene that encodes a functional change in amino acid sequence from methionine (M) to threonine (T). AGT M235T is also known as AGT C4072T polymorphism, where C allele encodes for threonine variant. The SNP determination was performed similarly to rs4343 and rs4351 with TaqMan®Genotype probe assay by RT- PCR.
III. Aldosterone synthase polymorphism - CYP11B2 -344T/C (rs1799998) (Figure 5)
Aldosterone synthase gene polymorphism (CYP11B2-344T/C) was identified by PCR-RFLP method. PCR reaction was performed in a 25μl reaction mixture containing 50-100ng DNA, PCR buffer (1X), 1.5mMol MgCl2, 200μmol of each dNTPs, 10pmoles each primer (Forward 5’-GAGATTCCTCACATGGAACCA-3’and reverse 5’-AAGTCCTGCTGGTCTGAGGAT-3’), and 2.5U of Taq polymerase. The reaction was subjected to 35cycles with denaturation at 94°C for 30sec, annealing at 59.1°C for 30sec and extension at 72°C for 40sec. The resultant PCR product of 307bp was restriction digested with HaeIII restriction enzyme (New England Biolabs, USA). The restriction reaction was carried out in 15μl reaction mixture containing 10μl of PCR product, 5U of enzyme and 1X buffer at 37°C for 4hours. The digested product was analysed on 2.5% agarose gel electrophoresis and documented (Bio-rad gel documentation system, USA). The TT alleles lack a restriction site(GGCC) for HaeIII enzyme, detected with two bands of 224bp and 83bp, CC allele was detected with three bands of 153bp,83bp, and 71bp, and TC heterozygous allele was detected with all the four bands of 224bp,153bp, 83bp, and 71bp (Figure 5)
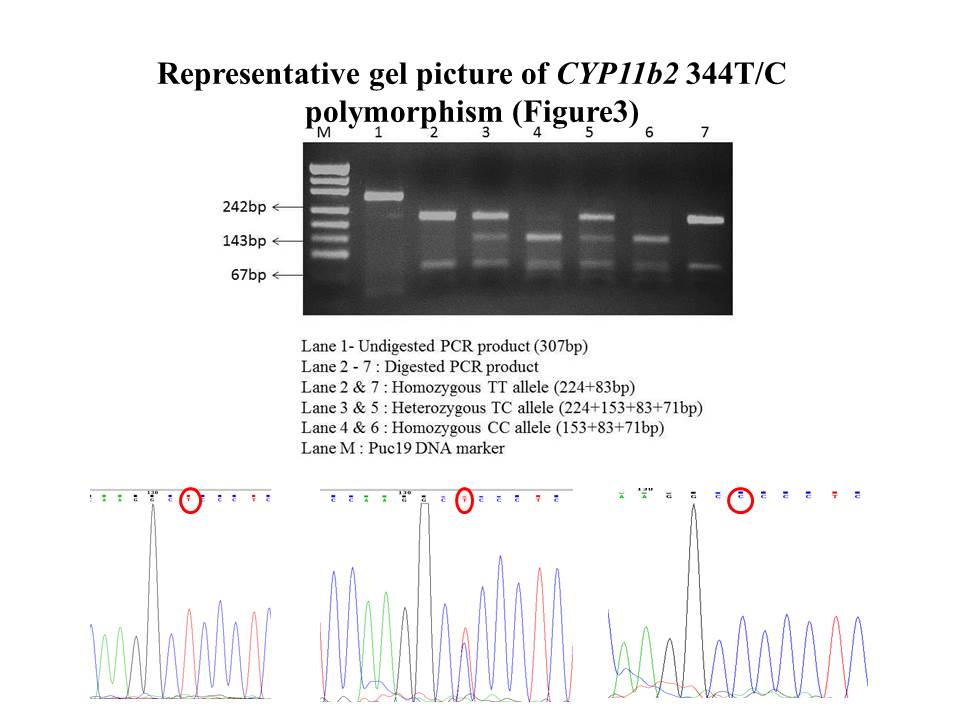
Figure 5. CYP11B2 -344T/C (rs1799998) polymorphism )
IV. Angiotensin receptor (ATR) gene polymorphisms (AT1R 1166A/C, -153A/G)
Polymerase chain reaction of ATIR 1166A/C gene region was performed in a 20μl reaction mixture containing 2.5U Taq polymerase, PCR buffer (1X), 15mM MgCl2, 100μMol of dNTPS, 10pmoles of each primer and 50-100ng of DNA. The primers sequence for the gene segment AT1R 1166A/C is as follows: 5’-AGAAGCCTGCACCATGTTTT-3’ (forward) and 5’-TGTGGCTTTGCTTTGTCTTG-3’ (reverse). The reaction conditions were initial denaturation 95 °C 5 min, then 35 cycles of denaturation at 94 °C for 30sec, annealing 55 °C for 45sec, and elongation 72 °C for 45sec, final elongation 72 °C for 7min. The resultant PCR product of 232bp was digested by 5 U of Dde I at 37°C for 12h respectively. The digested fragments were separated by electrophoresis on 2.5% agarose gel. The desired nucleotide band of digested PCR product for homozygous AA genotype was 232bp, homozygous CC 118bp & 114bp, heterozygous AC 232, 118 &114bp (Figure 6).
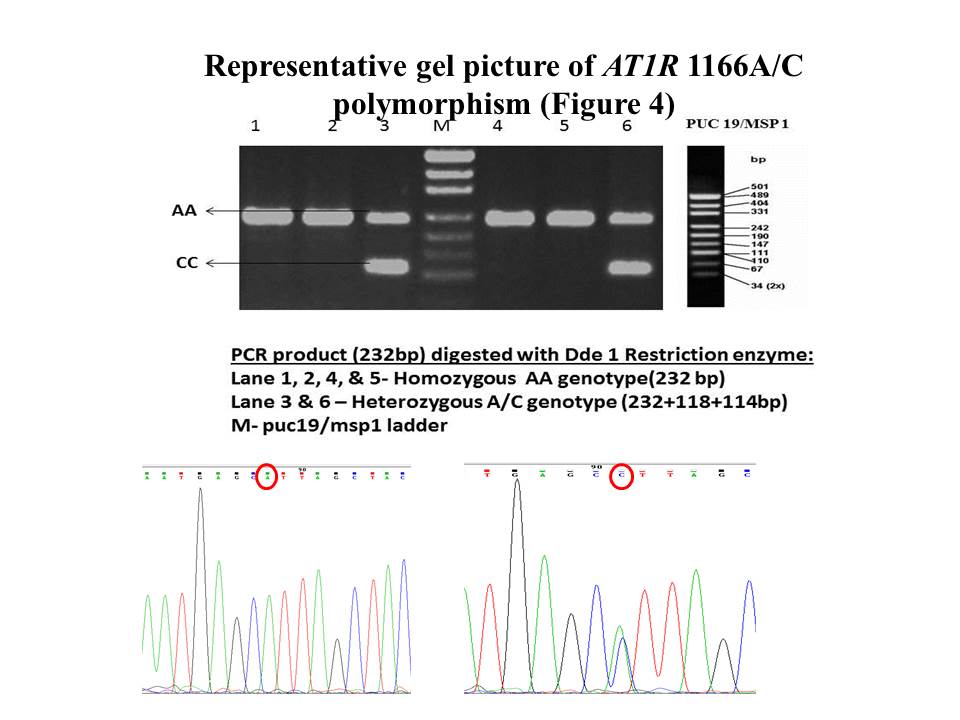
Figure 6. gel picture of AT1R 1166A/C polymorphism
AT1R -153A/G gene region was amplified by PCR in a 20μl reaction mixture. The reaction mixture consist of 50-100ng DNA template, PCR buffer (1X), 15mMolar Mgcl2, 100μmoles of dNTPs, 10pmoles of each primer (forward 5’-CCTCACGACCCCTCGCTAGG-3’ & reverse 5’-TGTCAGGCGCTGGAATCATT-3’), 2.5U Taq polymerase, nuclease free water to make up the total reaction volume to 20μl. The reaction conditions were as follows: initial denaturation 95 °C 5 min, followed by 35 cycles of denaturation at 94 °C for 30sec, annealing at 60°C for 45sec, and elongation 72 °C for 45sec, final elongation 72 °C for 7min. The resultant PCR product of 256bp was digested by 5U Hpy188III at 37°C for 12h respectively. The digested fragments were separated by electrophoresis on 2.5% agarose gel. The fragment length of digested PCR product is as follows: homozygous AA genotype 157, 72, 24, & 4bp, homozygous GG genotype 228, 24, & 4bp bands, and heterozygous AG 224, 157, 72, 24 & 4bp bands (Figure 7a&b).
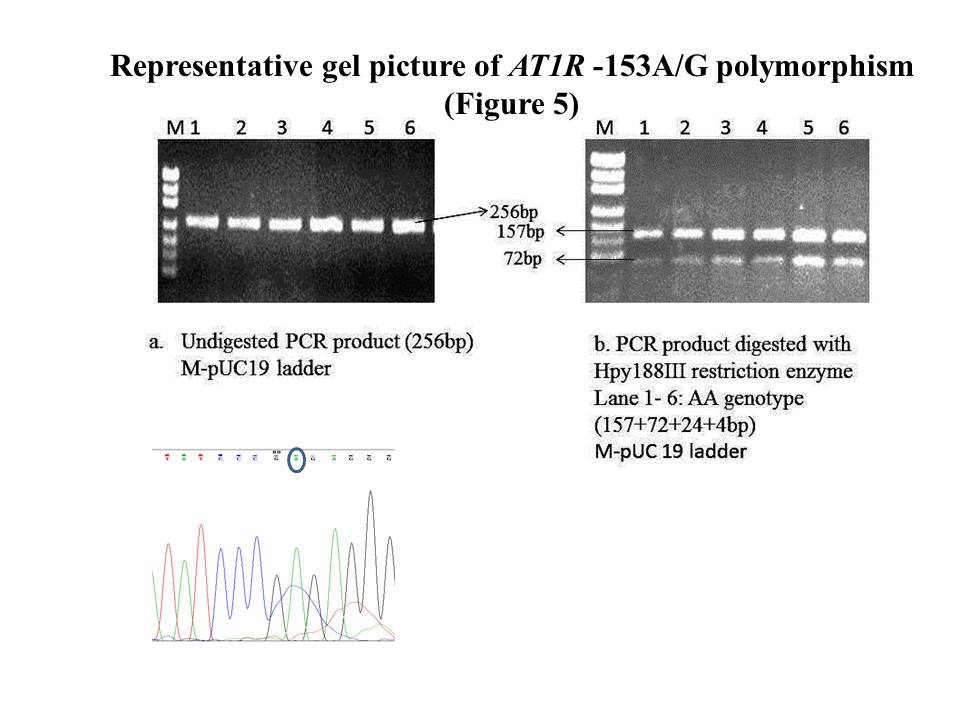
Figure 7 A & B. gel picture of AT1R -153A/G polymorphism
V. Endothelial nitric oxide (eNOS) gene polymorphisms ( eNOS 4b/4a , 786 T/C, 894 G/T)
eNOS 4b/4a an intronic variation on 27bp tandem repeats was studied by direct PCR method. PCR reaction was carried out in a 15μl reaction containing 2.5U of taq polemerase, 1.5mMol Mgcl2, PCR buffer (1X), 1mmol dNTPs, and 10pmoles forward 5’-AGG CCC TA TGG TAG TGC CTT-3’ and reverse 5’-TCT CTT TAG TGC TGT GGT CAC-3’, primers each and 1μl of template DNA (50ng-100ng/μl concentration) at an annealing temperature of 59°C. The reaction time was followed as; activation at 94C°C/ 5min, initial denaturation at 94°C /30sec, annealing at 59°C /45sec, elongation at 72°C /45sec, with 35 cycle repeat. The PCR product was determined on 2% agarose gel electrophoresis. Homozygous 4b variant was identified by the presence of 421 bp band ,homozygous 4a with 393bp band and heterozygous if both bands are present. (Figure 8)
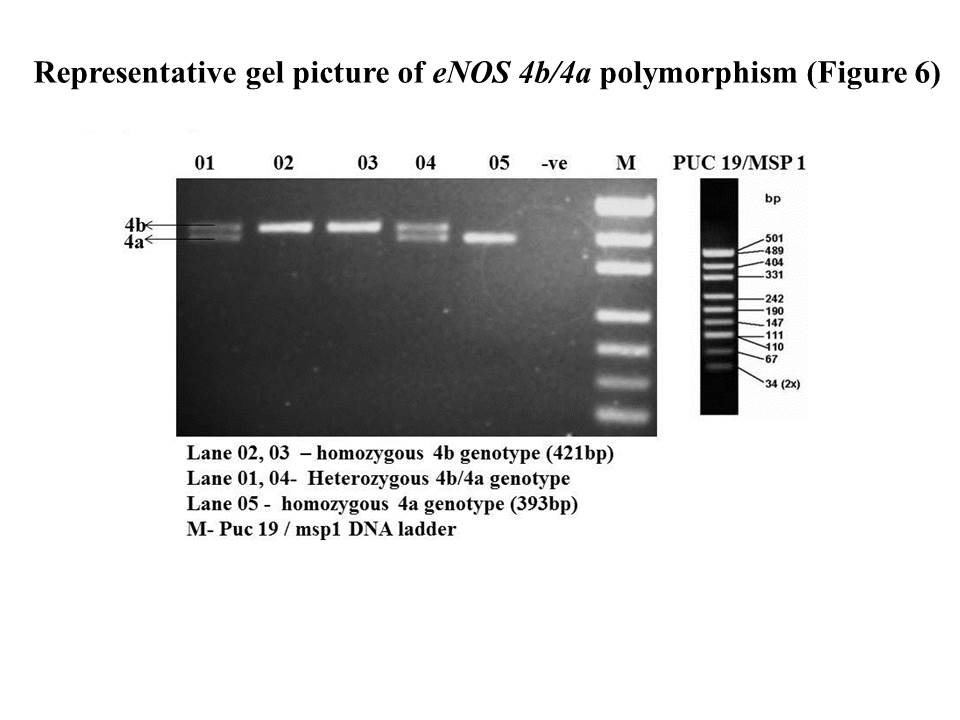
Figure 8. eNOS 4b/4a polymorphism
eNOS 786 T/C single nucleotide variation in the 5’ flanking region of nitric oxide synthase gene was analyzed using PCR - RFLP method. The PCR reaction was carried out in a 20μl reaction mix containing 10pmoles of primers, 2.5 unit taq polymerase, 1.5mmol Mgcl2, PCR buffer (1X), 1mmol dNTPs, and 1μl of template DNA. The desired gene fragment was amplified using forward primer 5′-GCA GGT CAG CAG AGA GAC TA-3′and reverse primer 5′-GAC ACA GAA CTA CAA ACC CC-3′ respectively and the annealing temperature at 58.2°C.The PCR time includes Initial activation at 94°C/5min, denaturation at 94°C /30sec, annealing at 58.2°C /30sec, and extension at 72°C /45sec with 35cyles repeat. The desired PCR product with 178bp length was examined on 2% agarose gel electrophoresis. The SNP genotyping was assessed by subjecting the PCR product to digestion using Msp1 restriction enzyme for 1hour at 37°C. The digested product was examined on 2.5% agarose gel electrophoresis for determining the SNP. The homozygous TT genotype was characterized by the presence of undigested PCR product band of 178bp, homozygous CC genotype by digested PCR product of 137bp and 41bp length bands, and heterozygous TC genotype by the presence of all three bands of length 178bp, 137bp and 41bp ( Figure.9).
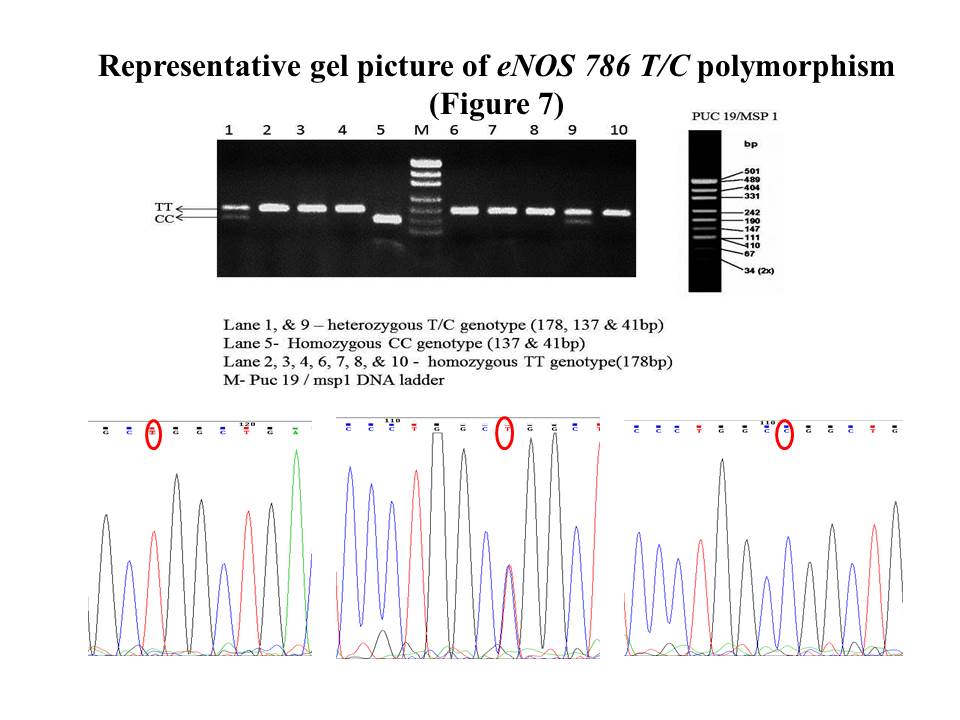
Figure 9. gel picture of eNOS 786 T/C polymorphism
eNOS 894G/T polymorphism in exon 7 of nitric oxide synthase gene was analyzed with PCR-RFLP method. The PCR reaction mix of 20μl containing PCR buffer (1X), 1.5mMol MgCl2, 1mmol dNTPs, 10pmole of both forward and reverse primer, 2.5 units of taq polymerase, and 1μl of template DNA. The nucleotide sequence of primers used were 5′-GTC CCT GAG GAG GGC ATG AG-3′and 5′-TCC AGC AGC ATG TTG GAC AC-3′for forward and reverse primers respectively. The reaction condition was 94°C /5min, 94°C /30sec, 61.1°C /1min, 72°C /1.30min, with 35cycles repeat, and final elongation at 72°C /7min and cooling at 4°C. The PCR product of 371bp was restricted digested with Ban II restriction enzyme at 37°C for one hour. The digested product was analyzed on 2.5% agarose gel electrophoresis. The homozygous TT genotype was identified with undigested 371bp band, homozygous GG with two bands of 223bp and 139bp length, and Heterozygous GT genotype with all three bands of 371bp, 223bp, and 139bp products (Figure.10)
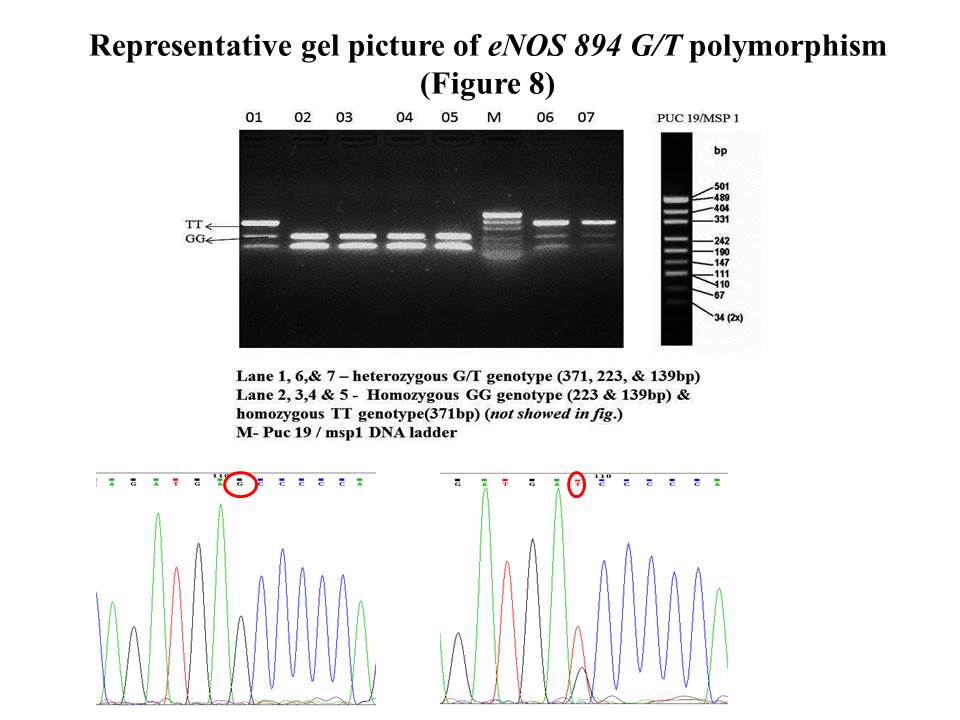
Figure 10. gel picture of eNOS 894 G/T polymorphism
Serum angiotensin converting enzyme activity (ACE)
ACE activity in serum was measured spectrophotometrically using N-[3-(2-Furyl)acryloyl]- L -phenylalanyl-glycyl-glycine (FAPGG) as substrate according to Simonetta Ronca-Testoni method (Clin Chem 1986., 29/6, 1093-1096).
Plasma nitric oxide (NOx) level
Plasma nitric oxide (NOx) level was determined by measuring the stable metabolites, nitrite and nitrate by enzymatic reduction of nitrate to nitrite using nitrate reductase enzyme and combined detection with the acidic Griess reagent using the method of Verdon et al (1995).
Results The demographic profile clinical features of the study is enclosed in Table 1.The distribution of Fazekas score in subjects is enclosed in table 2,allelic frequency of selected gene polymorphisms in table 3 ,odds ratio of ACE Gene SNPs in table 4, ACE levels vs I/D genotype in table 5, genotype frequency distribution and or for AGT M 235T and CYP11b2 344t/c polymorphism in table 6 ,odds ratio (OR) Enos gene polymorphism in table 7 , Plasma NOx concentration v/s eNOS gene polymorphism (table 8) Genotype frequency distribution in AT1R 1166 A/C and-153A/G polymorphism in table 9 )
Table 1. Demographic and clinical features of the study participants.
Features |
Cases (n=120) |
Controls (n=104) |
P value |
Gender (male/female) |
72/48 |
72/32 |
0.164 |
Mean age (years + SD) |
63.74 ± 13.13 |
68.12 ± 12.31 |
0.226 |
Obesity (%) |
10.2 |
13.5 |
0.643 |
Smoking (%) |
38.3 |
33.0 |
0.469 |
Hypertension (%) |
59.7 |
51.5 |
0.226 |
Diabetes mellitus (%) |
36.9 |
38.7 |
0.883 |
Dyslipidemia (%) |
18.0 |
22.1 |
0.572 |
Hyperhomocysteinemia (%) |
31.7 |
25.53 |
0.664 |
Dementia (%) |
100 |
0 |
|
Depression (%) |
7.14 |
0 |
0.0088* |
Behavioral problems (%) |
16.32 |
2.17 |
0.0009* |
Speech abnormality (%) |
6.12 |
3.26 |
0.35 |
Giddiness and vertigo (%) |
4.08 |
15.2 |
0.008* |
Cranial nerve palsy not due to 7th nerve (%) |
1.02 |
2.17 |
0.52 |
Headache (%) |
7.14 |
16.30 |
0.03* |
Extrapyramidal symptoms (%) |
2.04 |
1.08 |
0.6 |
Hemiplegia (%) |
23.46 |
43.47 |
0.003* |
Gait abnormality nor due to hemiplegia (%) |
3.06 |
0 |
0.05* |
Transient ischemic attack (%) |
3.06 |
14.1 |
0.0058* |
Others (%) |
3.06 |
5.43 |
0.41 |
SD- standard deviation, *P value <0.05 considered as statistically significance
Table 2. Distribution of subjects with respect to Fazekas grade
Grades |
Cases (n=107) |
Controls (n=100) |
P value |
Grade 1 |
9(8.4) |
11(11) |
0.696 |
Grade 2 |
29(27.1) |
31(31) |
Grade 3 |
28(26.1`) |
27(27) |
Grade >3 |
41(38.3) |
31(33) |
*P value <0.05 considered as statistically significance
Table 3. Allele frequency of selected gene polymorphisms
SNP |
Cases |
Controls |
Major allele |
Minor allele |
Major allele |
Minor allele |
ACE I/D |
0.52 |
0.48 |
0.53 |
0.47 |
rs4343(A/G) |
0.6 |
0.4 |
0.58 |
0.42 |
rs4351(A/G) |
0.64 |
0.36 |
0.58 |
0.42 |
AGT M235T |
0.35 |
0.65 |
0.39 |
0.61 |
Cyp11b2 344T/C |
0.66 |
0.34 |
0.67 |
0.33 |
eNos4b/4a |
0.84 |
0.16 |
0.78 |
0.22 |
eNos786T/C |
0.83 |
0.17 |
0.82 |
0.19 |
eNos894G/T |
0.80 |
0.20 |
0.81 |
0.19 |
AT1R1166 A/C |
0.93 |
0.07 |
0.92 |
0.08 |
AT1R -153A/G |
1.0 |
0.0 |
1.0 |
0.0 |
Table 4. Odds ratio of ACE gene SNPs
Genotype |
Genotype frequency |
Adjusted OR
(95% CI) |
P value |
Cases
n=118(%) |
Controls
n=102(%) |
ACE I/D |
II |
42 (35.5) |
33 (32.4) |
1 (Ref) |
|
ID |
40 (34.5) |
43 (42.2) |
0.674(0.352-1.290) |
0.23 |
DD |
36 (29.0) |
26 (25.5) |
1.121(0.552-2.278) |
0.75 |
ID+DD v/s II (Dominant) |
|
|
0.84(0.47-1.49) |
0.55 |
II+ID v/s DD (Recessive) |
|
|
1.36(0.74-2.5) |
0.31 |
rs4343 |
AA |
45 (38.1) |
36 (35.3) |
1 (Ref) |
|
AG |
51 (43.2) |
48 (47.1) |
0.839(0.458-1.538) |
0.57 |
GG |
22 (18.6) |
18 (17.6) |
1.019(0.690-1,507) |
0.92 |
AG+GG v/s AA (Dominant) |
|
|
0.898(0.510-1.570) |
0.70 |
AA+AG v/s GG (Recessive) |
|
|
1.130(0.56-2.270) |
0.73 |
rs4351 |
AA |
52 (44.1) |
33 (32.4) |
1 (Ref) |
|
AG |
49 (41.5) |
54 (52.0) |
0.615(0.339-1.114) |
0.10 |
GG |
17 (14.4) |
16 (15.7) |
0.888(0.579-1.362) |
0.58 |
AG+GG v/s AA (Dominant) |
|
|
0.642(0.360-1.120) |
0.12 |
AA+AG v/s GG (Recessive) |
|
|
0.975(0.450-2.080) |
0.94 |
*P value <0.05 is considered as significant
Table 5. ACE activity v/s I/D genotype
ACE I/D |
ACE activity (U/L) (Mean ± sd)(n) |
P value |
Cases
n=118 |
Controls
n=102 |
II |
18.2 ± 7.6(42) |
21.9 ± 10.5(33) |
0.08 |
ID |
22.5 ± 10.4(40) |
26.3 ± 9.6(43) |
0.08 |
DD |
30.18 ± 13.5(36) |
37.9 ± 16.1(26) |
0.04 |
*P value <0.05 is considered as significant
Table 6. Genotype frequency distribution and OR for AGT M235T and CYP11b2 344T/C polymorphism
SNP |
Frequency |
Adjusted OR
(95% CI) |
P Value |
Cases
n=118(%) |
Controls
n=102(%) |
AGT M235T |
MM |
15 (12.7) |
13 (12.7) |
1 (Ref) |
|
MT |
53 (44.9) |
53 (52.0) |
0.81(0.35-1.91) |
0.639 |
TT |
50 (42.4) |
36 (35.3) |
1.07(0.69-1.66) |
0.746 |
MT+TT v/s MM (dominant) |
0.95(0.426-2.31) |
0.909 |
MM+TT v/s TT (recessive) |
1.33(0.76-2.32) |
0.309 |
Cyp11b2 344T/C |
TT |
53 (45.3) |
46 (46.0) |
1(Ref) |
|
TC |
50 (42.7) |
43 (43.0) |
1.0(0.56-1.77) |
0.998 |
CC |
14 (12.0) |
11 (11.0) |
1.12(0.7-1.768) |
0.621 |
TC+CC v/s TT(dominant) |
1.04(0.60-1.80) |
0.878 |
TT+TC v/s CC(recessive) |
1.21(0.52-2.84) |
0.661 |
*P value <0.05 is considered as significant
Table 7: Odds ratio (OR) for eNOS gene polymorphisms
Genotype |
Cases
n=117(%) |
Controls
n=101(%) |
Adjusted OR
(95% CI) |
P value |
|
|
|
|
|
4b/4a |
|
|
|
|
4b |
80 (68.4) |
64 (63.4) |
1(Ref) |
|
b/a |
36 (30.8) |
29(28.7) |
0.95(0.52-1.74) |
0.870 |
4a |
1 (0.9) |
8 (7.9) |
0.28(0.09-0.83) |
0.021* |
4a+b/a v/s 4b (Dominant) |
|
|
0.75(0.42-0.133) |
0.328 |
4b+b/a v/s 4a (Recessive) |
|
|
0.07(.009-0.658) |
0.019* |
|
|
|
|
|
786T/C |
|
|
|
|
TT |
77 (65.8) |
70 (69.3) |
1(Ref) |
|
TC |
39 (33.3) |
24 (23.8) |
1.48(0.86-2.74) |
0.204 |
CC |
1 (0.9) |
7 (6.90) |
0.33(0.11-0.97) |
0.044* |
TC+CC v/s TT (Dominant) |
|
|
1.15(0.65-2.05) |
0.625 |
TT+TC v/s CC (Recessive) |
|
|
0.09(0.011-0.78) |
0.028* |
|
|
|
|
|
894G/T |
|
|
|
|
GG |
76 (65.00) |
63 (62.4) |
1(Ref) |
|
GT |
35 (29.9) |
38(37.6) |
0.88(0.48-1.59) |
0.689 |
TT |
6 (5.10) |
0 (0.00) |
10.7(0.59-195.2) |
0.107 |
TG+GG v/s GG (Dominant) |
|
|
1.04(0.58-1.86)ƍ |
0.857 |
GG+TG v/s TT (Recessive) |
|
|
11.8(0.6-212.7)ƍ |
0.09 |
*P value <0.05 is considered as significant
Table 8: Plasma NOx concentration v/s eNOS gene polymorphism
Genotype |
Plasma NOx µM/L (Mean ± SD)(n) |
P value |
Homozygous wild |
Heterozygous |
Homozygous mutant |
4b/4a |
|
|
|
|
Cases |
23.4 ± 13.4(80) |
22.67 ± 11.7(36) |
33.71(1) |
0.691 |
Controls |
26.62 ± 16.0(64) |
27.3 ± 12.6(29) |
33.4 ± 20.3(8) |
0.510 |
786T/C |
|
|
|
|
Cases |
22.73 ± 12.3(77) |
24.36 ± 14.07(39) |
23.75(1) |
0.814 |
Controls |
26.5 ± 15.2(70) |
26.5 ± 13.6(24) |
38.7 ± 21.1(7) |
0.130 |
894G/T |
|
|
|
|
Cases |
23.8 ± 13.2(76) |
21.28 ± 11.8(35) |
28.06 ± 13.9(6) |
0.408 |
Controls |
29.13 ± 16.4(63) |
24.4 ± 13.5(38) |
- |
0.139 |
*P value <0.05 is considered as significant
Table 9: Genotype frequency distribution in AT1R 1166 A/C and -153A/G polymorphism
Genotype |
AT1R 1166A/C |
AT1R -153A/G |
Cases n=117(%) |
Controls n=101(%) |
Cases n=117(%) |
Controls n=101(%) |
Wild (AA) |
100 (85.5) |
83 (82.2) |
117 (100) |
101 (100) |
Hetero (Aa) |
17 (14.5) |
18 (17.8) |
0 (0.00) |
0 (0.00) |
Mutant (aa) |
0 (0.0) |
0 (0.0) |
0 (0.00) |
0 (0.00) |
2021 Copyright OAT. All rights reserv
Depression, gait abnormality and extrapyramidal signs were significant statistically among patients among cases than controls, severity in Fazekas grading did not correlate with HMSE and Neuropsychological scores ,Genotype frequency distribution for ACE I/D, rs4343, rs4351, AGT M235T, and CYP11B2 344T/C, was not significantly different between cases and control.
The OR values for wild v/s mutant genotypes eNOS 4b/4a and 786T/C SNPs showed a possible protective role, and TT genotype of 894G/T SNP showed a risk of 10.79 fold
ACE activity did show significant difference between the genotypes of ACE I/D polymorphism, with increased activity in subjects with DD genotype
Plasma NOx concentration was not significantly different either between the genotypes or between the cases and control (Table1)
The present study was undertaken to assess the genetic, demographic, psychological, biochemical, neuropsychological determinants of cognitive impairment in cerebral small vessel disease. Most of our patients with SVD among both cases and controls belonged to the 7th decade. Statistical significance was observed between cases and controls with respect to some clinical features like depression, gait abnormality and extrapyramidal signs which were more common among cases than controls, but actual correlation could not be established due to limited sample number. It was also observed that, severity in Fazekas grading did not correlate with HMSE and Neuropsychological scores. Premorbid educational status did not alter the cognitive scores or HMSE scores and this indicates lack of association with cognitive reserve as per this study.
Genotyping studies were done for 7 SNPs spanning 4 genes of Renin-angiotensin-aldosterone (RAAS) system and 3 SNPs of endothelial-nitric oxide synthase gene. Genotype frequency distribution for ACE I/D, rs4343, rs4351, AGT M235T, and CYP11B2 344T/C, was not significantly different between cases and control. The OR values for wild v/s mutant genotypes eNOS 4b/4a and 786T/C SNPs showed a possible protective role, and TT genotype of 894G/T SNP showed a risk of 10.79 fold. ACE activity did show significant difference between the genotypes of ACE I/D polymorphism, with increased activity in subjects with DD genotype. No significant difference was observed when cases were compared with controls. Plasma NOx concentration was not significantly different either between the genotypes or between the cases and control.
The SNPs analysis in hypertensive subjects also did not establish significant role of hypertension in cognitive impairment in SVD. Analysis of genotype in male and female subjects to assess the role of gender in contributing to cognitive impairment was not statistically significant. Analysis of cognitive function tests score with genotypes indicated significant variation in NNPB - scores in control subjects with mutant genotypes of the selected ACE gene SNPs showing higher score than wild genotypes.
The present study aids in collection of genotype data of the selected 10 SNPs in south Indian population. There is absence of minor allele of AT1R 1166 A/C polymorphism, and both heterozygous and minor allele of AT1R -153A/G polymorphism in the selected population. Hypertension and Non vegetarian diet is a major risk factor for cerebral small vessel disease However due to small sample size definite conclusion regarding the role of any of the selected genotypes in promoting cognitive dysfunction in persons having radiological evidence of SVD cannot be postulated. The OR values for wild v/s mutant genotypes eNOS 4b/4a and 786T/C SNPs showed a possible protective role, and TT genotype of 894G/T SNP showed a risk of 10.79 fold.
The differently prevalent genotype identified in this study has to be studied in larger population to confirm the protective or the otherwise role of the above SNPs.
The authors thank National Institute of Mental Health and Neurosciences (NIMHANS), Bangalore, Karnataka, South India and Indian Council of Medical Research for providing the facilities to carry out the research work.
The authors do not have any conflict of interests related to the study. The authors did not receive any financial funding for the present study.
Dr. Sadanandavalli Retnaswami Chandra, Professor of Neurology is the primary author for this work and chose the topic of research, examined and identified all probable cases for study,went through all data and chose patients as per inclusion criteria, facilitated genetic analysis in the Department of Neurochemistry and wrote the paper. Dr. Rita Christopher, Professor and Head, Department of Neurochemistry, helped in the research idea as well as Biochemical and Genetic analysis. Mr. Mubashar Mujawar, Junior Research Officer, Department of Neurochemistry, did the genetic analysis on the samples.
- Shaji S, Promodu K, Abraham T, Roy KJ, Verghese A (1996) An epidemiological study of dementia in a rural community in Kerala, India. Br J Psychiatry 168: 745-749. [Crossref]
- O'Sullivan M (2008) Leukoaraiosis. Pract Neurol 8: 26-38. [Crossref]
- Hassan A, Hunt BJ, O’Sullivan M, Parmar K, Bamford JM, et al. (2003) Markers of endothelial dysfunction in lacunar infarction and ischaemic leukoaraiosis. Brain 126: 424-32. [Crossref]
- Prins ND, van Dijk EJ, den Heijer T, Vermeer SE, Jolles J, et al. (2005) Cerebral small-vessel disease and decline in information processing speed, executive function and memory. Brain 128: 2034-41. [Crossref]
- O’Sullivan M, Morris RG, Huckstep B, Jones DK, Williams SC, et al. (2004) Diffusion tensor MRI correlates with executive dysfunction in patients with ischaemic leukoaraiosis. Journal of Neurology, Neurosurgery & Psychiatry 75: 441-7. [Crossref]
- Van Straaten EC, Fazekas F, Rostrup E, Scheltens P, Schmidt R, et al. (2006) Impact of white matter hyperintensities scoring method on correlations with clinical data. Stroke 37: 836-40.
- Verhaaren BF, Vernooij MW, de Boer R, Hofman A, Niessen WJ, et al. (2013) High blood pressure and cerebral white matter lesion progression in the general population. Hypertension 61: 1354-1359. [Crossref]
- Marquine MJ, Attix DK, Goldstein LB, Samsa GP, Payne ME, et al. (2010) Differential patterns of cognitive decline in anterior and posterior white matter hyperintensity progression. Stroke. 41:1946-50. [Crossref]
- Shakersain B, Santoni G, Larsson SC, Faxén-Irving G, Fastbom J, et al. (2016) Prudent diet may attenuate the adverse effects of Western diet on cognitive decline. Alzheimers Dement 12: 100-109. [Crossref]
- Kawamura T, Umemura T, Imamine R, Umegaki H, Kawano N, et al. (2015) Factors Associated with Brain Atrophy Estimated with Automatic Voxel-Based Morphometry of Structural Magnetic Resonance Images in Elderly Diabetic Patients: Impact of Albuminuria on Hippocampal Atrophy. J Diabetes Metab
- Wengenroth M, Saam T, Hähnel S (2016) [Neuroimaging of cerebral vasculitis]. Radiologe 56: 52-69. [Crossref]
- Ringman JM, Younkin SG, Pratico D, Seltzer W, Cole GM, et al. (2008) Biochemical markers in persons with preclinical familial Alzheimer disease. Neurology 71: 85-92. [Crossref]
- Erkinjuntti T, Gauthier S. (2002) Vascular cause of cognitive impairment-the perspective. By Erkinjuntti T, Gauthier S. London Martin Dunitz 643-51.
- T O'Brien J, Erkinjuntti T, Reisberg B, Roman G, Sawada T, et al. (2003) Vascular cognitive impairment. The Lancet Neurology 2: 89-98.
- Matsusue E, Sugihara S, Fujii S, Ohama E, Kinoshita T, et al. (2006) White matter changes in elderly people: MR-pathologic correlations. Magn Reson Med Sci 5: 99-104. [Crossref]