The purpose of this study was to determine if exposure to media’s “ideal body types” influences women’s eating patterns, body satisfaction and drive for muscularity. A primary objective of this study was to examine the difference in drive for muscularity and the risk for the development of muscle dysmorphia (MD) between female athletes and non-athletes. A series of magazine covers were viewed, ranging from thin to muscular and toned, either before or after the Body Appreciation Scale (BAS) was administered. It was hypothesized that exposure to images of what society defines as “ideal” body types before an assessment of self-perception and body appreciation will result in a stronger level of body dissatisfaction. It was also hypothesized that a drive for muscularity would be present in female competitive athletes, more so than non-athletes. Surveys were administered to measure body satisfaction, eating patterns, drive for muscularity and susceptibility for the development of MD. These surveys included the Intuitive Eating Scale (IES), Drive for Muscularity Scale (DMS) and the Muscle Dysmorphia Index (MDI). The results suggest that a higher Body Mass Index (BMI) is correlated with non-athletes striving for thinness, while a lower BMI is correlated with competitive athletes developing a drive for muscularity and risking the development of MD. This research is important to determine the effects of media on female body appreciation and drive for muscularity. Furthermore, this study indicates that competitive female athletes may exhibit a higher level of drive for muscularity and thus, more characteristics of muscle dysmorphia.
body image dissatisfaction, drive for muscularity, female athletes, muscle dysmorphia
Body image is described as cognitions, perceptions, and attitudes toward one’s body [1]. Subjective feelings of dissatisfaction with one’s physical appearance can lead to the development of body image dissatisfaction (BID) [2]. BID is a predictor of one's self-esteem [1]. The growing concern of BID in women relates to previous studies that support the notion that women today develop high levels of BID, possibly due to the drastic objectifications and body type expectations presented to women. Recent studies reported that children as young as five and six years old desire body figures thinner than their own [2]. There is some evidence that the increasing prevalence of BID may be a result of media’s influence on thinness and weight control in women [3].
The preoccupation with the idea that one’s body is not toned or muscular enough is defined as muscle dysmorphia (MD), one of the many body dysmorphic disorders (BDD) that may result from the societal body expectations, especially aimed towards men [4]. MD is considered a type of BDD, where individuals have a preoccupation with their muscularity and a fear that their bodies are too small [5,6]. The characteristics of MD are associated with those of BDDs including “an obsession with muscle tone and body building” [7]. MD has previously been explored in men; however, there are few studies with regard to women’s risk for the development of MD. Previous studies indicate that there has been an increased desire for more muscular physiques in men, usually weightlifters, which further potentiates a greater risk for the use of supplements and other drugs and for the development of MD [4,8,9]. Studies regarding BID have raised the question of whether or not muscularity has an influence over one’s level of body satisfaction and what truly influences these preoccupations.
Many factors contribute to society’s expectations for body types and appearances. The thin ideal is spread and reinforced in the home by parents, peers and through media [10]. Media has been found to be one of the most influential mediums that spreads these expectations while also leading to negative impacts on self-esteem and further developing the drive for muscularity [11]. One reason may be that media establishes a standard for the ideal body types and shapes regarding attractiveness, gender and weight management [12]. A sociocultural model states that media, along with other channels, spreads the existing societal ideal of beauty, which leads to body dissatisfaction [13]. This model also highlights that these societal ideals for body type are unrealistic, irrational and unobtainable for a typical woman [14]. Popular magazines expose women to images of body types below the average weight, while instructing readers how to become as thin and toned as the social standard [15]. According to previous research, 70% of girls who read these popular magazines use them as their primary source for their self-expectations and fitness information [16,17].
The skill of eating due to physical hunger rather than to boredom, emotional satisfaction or to reach a specific weight goal can be defined as intuitive eating [18,19]. Eating patterns often change as a result of exposure to these societal standards which can lead to eating disorders and BDD. Today, the female standard can be represented by a thin, well-toned appearance [15]. Overall, media and societal standards can influence some individuals to attempt to reach unrealistic goals which can ultimately lead to unhealthy habits [12].
The objectives of this study were to determine whether or not media images influence body image and self-perception, to determine whether or not muscle dysmorphia is present in women, to determine if muscle dysmorphia and/or a drive for muscularity is more apparent in women who participate in competitive athletics and to determine if women who show a drive for muscularity also exhibit intuitive eating skills.
It was hypothesized that women who view the media exposure after completing the Body Appreciation Scale (BAS) will select higher scores on the BAS, thus demonstrating greater body satisfaction. However, women who view the media exposure prior to completing the BAS will select lower scores, thus demonstrating lower body satisfaction. It was also hypothesized that women who select higher scores on the Drive for Muscularity Scale (DMS) will select lower scores on the Muscle Dysmorphia Index (MDI) subscales, indicating that they are at a lower risk for developing muscle dysmorphia.
Participants
Participants were recruited through word of mouth, e-mail invitations and social media. Two Google Forms links were publicized. Participants were gathered from the University of Wisconsin- La Crosse campus as well as the Long Island area. All subjects (n=302) were women ranging from the ages 18-65 and characterized as either athletic or non-athletic by self-report. Approximately half of the participants randomly received a link to the surveys with exposure to media generated images before completing the BAS (n=159), while the other half received a link to the surveys with exposure to media generated images after completing the BAS (n=143). The responses to the surveys were anonymous and a PIN number identified each participant.
Study Design
The independent variables of this study were type of athlete (competitive, recreational or non-athlete) and time of media exposure. Groups were randomized into either viewing the media exposure prior to completing the BAS (the “before” group) or after completing the BAS (the “after” group).
Procedure
Participants were first asked to give consent to complete the surveys and were given a brief description of the purpose and content of the study, without revealing information to skew any survey responses. Following the informed consent, participants were asked to complete a series of surveys including the Intuitive Eating Scale (IES), the BAS, the DMS and the MDI. A group of magazine covers with varying female body types, ranging from a thin, bony physique to extremely muscular, were viewed by participants either before or after completing the BAS. After viewing the exposure, the DMS, MDI and a closing survey were completed.
Body Appreciation Scale: This survey assesses body satisfaction and self-perception. The survey contains thirteen questions that assess the attitude and behaviors towards one’s body. This survey utilizes a Likert-type scale with responses ranging from 1 (never) to 5 (always) [19].
Intuitive Eating Scale: This survey assesses intuitive eating skills and overall eating patterns. The survey contains twenty-one questions that assess one’s eating habits and relationship with food. This survey utilizes a Likert-type scale with responses ranging from 1 (Strongly Disagree) to 5 (Strongly Agree) [19].
Drive for Muscularity Scale: This survey assesses one’s level of drive for muscularity. The survey contains fifteen questions that assess one’s exercise habits and muscle tone desire. This survey utilizes a Likert-type scale with responses ranging from 1 (always) to 6 (never) [20].
Muscle Dysmorphia Index: This survey assesses one’s susceptibility for the development of MD. The survey contains twenty-five questions that assess one’s fitness behaviors, both healthy and unhealthy. This survey is divided into six subscales. These include the Diet, Physique Protection, Exercise Dependence, Size/Symmetry, Supplement and Pharmacological Subscales. Each subscale receives its own score, rather than a total score on the survey. This survey utilizes a Likert-type scale with responses ranging from 1 (never) to 6 (always) [7].
Closing Survey: This demographic questionnaire asked for the individual’s age, height, weight, ethnicity, menopausal status and type of athlete (TOA) (competitive, recreational or non- athlete). The Body Mass Index (BMI) of the individual was calculated using the height and weight reported.
Statistical analysis
The independent variables of this study were type of athlete (competitive, recreational, or non-athlete) and time of media exposure. R version 3.4.1 was used to calculate descriptive statistics (means and standard deviations) and to perform logistical and linear regressions [21]. Estimate values, standard error values, t-values and p-values were calculated for all relationships analyzed. Additionally, percentages of TOA and age, along with BMI means and standard deviations were calculated for the “before” and “after” groups (Table 1).
Table 1. Participant Demographics.
|
Before |
After |
Total (n, %) |
n=159, 53% |
n=143, 47% |
Average BMI (SD) |
26.61 (6.12) |
27.02 (5.50) |
TOA % |
Competitive |
9% |
4% |
Recreational |
45% |
54% |
Non-athlete |
46% |
42% |
Age % |
18-30 |
24% |
19% |
31-45 |
37% |
36% |
46-60 |
35% |
42% |
60 over |
3.80% |
2.80% |
302 women completed a variety of measures in order to explore the effect of media exposure on the body satisfaction and the drive for muscularity in women. These measures included the Intuitive Eating Scale, Body Appreciation Scale, Drive for Muscularity Scale, Muscle Dysmorphia Index and a closing survey.
Body appreciation scale
BAS scores were compiled and compared to IES scores, TOA specified, time of media exposure, and BMIs calculated. It was found that as a participant’s IES score increased, BAS score showed a significant decrease by an average of 0.27 points (t=-3.845, p=0.000149).
Figure 1 represents the relationship between time of media exposure and BAS score. It was found that participants who viewed the media exposure prior to taking the BAS scored a mean of 2.59 points lower on the BAS than those who viewed the images after completing the BAS (t=-2.474, p=0.013910).
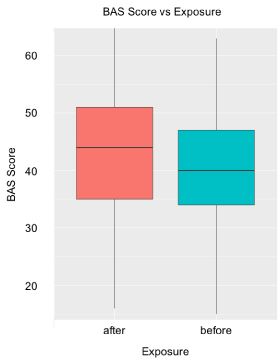
Figure 1. BAS vs Exposure: Difference in mean BAS score before (40.34 (9.5)) and after (43.42 (10.06)) is statistically significant (p=0.013910).
Figure 2 depicts the relationship between BMI and BAS scores. As the BMI of the participant increased, BAS score was found to decrease by 0.56 points, suggesting an inverse relationship (t=-5.507, p= 8.17e-08). The slopes between the before exposure and after exposure groups were slightly different in relation to BMI and BAS score; however, this difference was not significant.
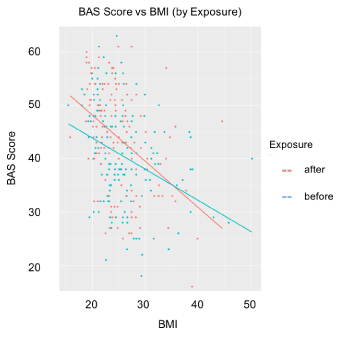
Figure 2. BAS Score vs. BMI: Both exposures resulted in a statistically significant decrease in BAS score as BMI increased (p=8.17e-08); however, there is no significant difference seen between the different exposure times.
Figure 3 depicts the relationship between TOA (competitive, recreational or non-athlete) and BAS score. Recreational athletes did not show a significant difference in BAS score as compared to competitive athletes; however non-athletes scored a mean of 4.82 points lower on the BAS than competitive athletes (t=-2.219, p=0.027280).
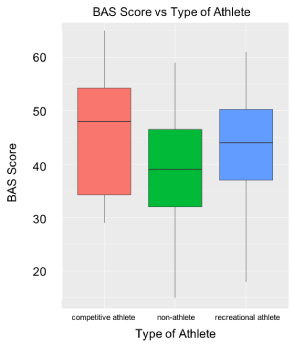
Figure 3. BAS Score vs. Type of Athlete: Non-athletes scored significantly lower on the BAS than competitive athletes (p=0.027280).
Muscle dysmorphia index subscales
The MDI is divided into six subscales. These include the Diet, Physique Protection, Exercise Dependence, Size/Symmetry, Supplement and Pharmacological Subscales. These subscales were analyzed in comparison to several different measures. These subscales examine the breakdown of intensity of exercise habits and risk for the development of MD. MDI subscales were compared to TOA specified, DMS score and BMI. Although the Pharmacology Subscale of the MDI had little significance due to almost all of the responses being “1” or “never,” the other subscales showed significant correlations in relation to TOA, DMS score and BMI.
Figure 4 shows the Diet Subscale in relation to TOA. On average, competitive athletes scored 1.62 times higher than non-athletes scored on this scale (t=-4.994, p=1.03e-06). Although the relationship between competitive athletes and non-athletes for this subscale was significant, competitive athletes’ scores compared to those of recreational athletes’ for this subscale were not significant.
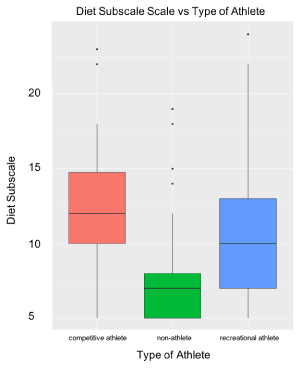
Figure 4. Diet Subscale Score vs. Type of Athlete: Competitive athletes scored significantly higher than non-athletes on the Diet Subscale (p=1.03e-06). Recreational athletes and competitive athletes did not show a significant difference in scores.
Figure 5 represents the Physique Protection Subscale in relation to TOA. Different from the Diet Subscale, the Physique Protection Subscale resulted in a significant difference between competitive athletes’ scores and recreational athletes’ scores instead of non-athletes’ scores. An average of a score 1.15 times higher was calculated for competitive athletes compared to recreational athletes (t=-2.377, p=0.0181).
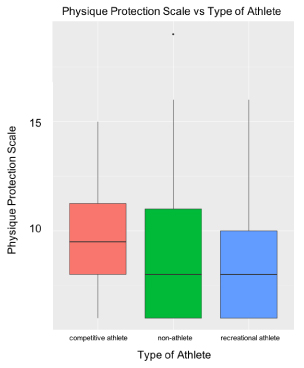
Figure 5. Physique Protection Subscale Score vs. Type of Athlete: There was a significant difference between competitive and recreational athletes’ scores on the Physique Protection Subscale (p=0.0181). There was no significant difference between competitive athletes and non-athletes.
Figure 6 shows the Exercise Dependence Subscale in relation to TOA. Competitive athletes scored an average of 1.17 times higher than non-athletes scored on this subscale (t=-2.053, p=0.0409). The competitive athletes’ scores compared to recreational athletes’ scores are not significant for this subscale.
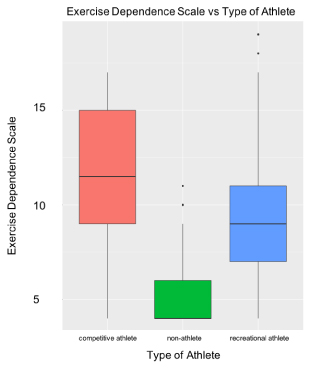
Figure 6. Exercise Dependence Subscale Score vs. Type of Athlete: Competitive athletes scored significantly higher than non-athletes on the Exercise Dependence Subscale (p=0.0409).
Figure 7 represents the Size/Symmetry Subscale in relation to TOA. Competitive athletes scored an average of 1.69 times higher than non-athletes on this subscale (t=-2.045, p=0.0417). The competitive athletes’ scores compared to recreational athletes’ scores are not significant for this subscale.

Figure 7. Size/Symmetry Subscale Score vs. Type of Athlete: Competitive athletes scored significantly higher on the Size Symmetry Subscale than non-athletes (p=0.0417).
The Supplement Subscale compared to TOA is represented in Figure 8. The responses to this subscale were mostly “4” or “often,” so the responses were categorized into a binary response, “response = 4” or “response > 4.” Non-athletes were 18% as likely as competitive athletes to score a response > 4 (z=-2.782, p=0.00540), whereas recreational athletes were 29% as likely to score a response > 4 (z=-2.137, p=0.03257).
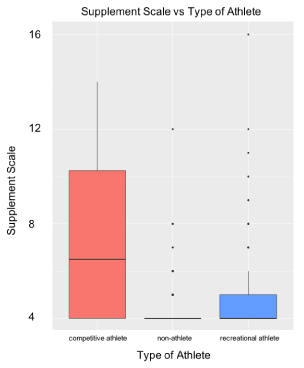
Figure 8. Supplement Subscale Score vs. Type of Athlete: Non- athletes and recreational athletes were less likely to score a “response > 4” on the Supplement Scale (p=0.00540; p=0.03257).
Drive for muscularity scale
DMS scores were analyzed based on TOA. Competitive athletes scored an average of 8.26 points lower on the DMS compared to those of non-athletes (t=3.573, p=0.000411). Competitive athletes scored a mean of 5.18 points lower than recreational athletes scored on the DMS (t=2.262, p=0.024400) (Figure 9).
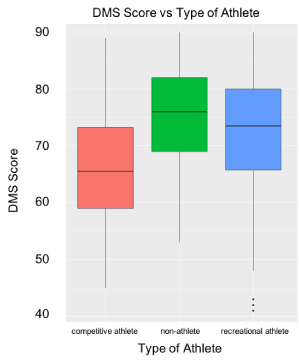
Figure 9. DMS vs. Type of Athletes: Competitive athletes scored significantly lower on the DMS than non-athletes and recreational athletes (p=0.000411; p=0.024400).
All subscales of the MDI were then compared to overall DMS scores. The scoring of the scales on the DMS and the MDI is inverted (both are 5-point scales: 1=always on DMS, 1=never on MDI). Figure 10 depicts all of the subscale scores individually compared to the overall DMS scores. As the DMS score increased by one point, all subscale scores decreased: The Diet Subscale score by an average of 2% (t=-6.319, p=1.02e-9), the Physique Protection Subscale score by an average of 0.5% (t=-3.271, p=0.0012), the Exercise Dependence Subscale score by an average of 1% on average (t=-6.328, p=9.22e-10) and the Size/Symmetry Subscale score by 6% (t=-6.619, p=1.71e-10). Participants were 89% more likely to score a Supplement Subscale score “response > 4” (z=-5.915, p=3.32e-9).
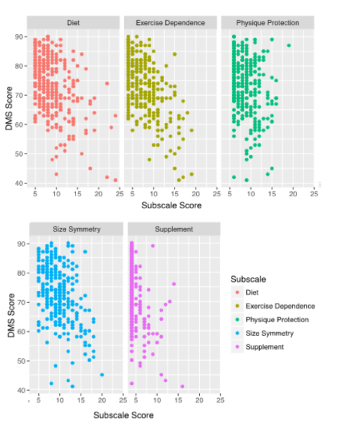
Figure 10. DMS vs. Subscales: All subscale scores decreased significantly as DMS score increased. Diet (p=1.02e-9), Exercise Dependence (p=0.0012), Physique Protection (p=9.22e-10), Size Symmetry (p=1.71e-10). Participants were more likely to score a “response > 4” on the Supplement Subscale (p=3.32e-9).
BMI analysis
BMI scores were compared to all subscale scores of the MDI. Figure 11 reflects the participants’ BMI scores analyzed in comparison to the subscale scores. Only the Diet, Physique Protection and Supplement Subscales were found statistically significant in relation to BMI scores. As the BMI scores increased by one, the Diet Subscale score, on average, decreased by 2% (t=-3.061, p=0.00241) and the Physique Protection Subscale score increased by an average of 1% (t=2.091, p=0.0374). On the Supplement Subscale, for every additional point in BMI, participants were 90% more likely to score a “response > 4” (z=-2.602, p=0.00927).
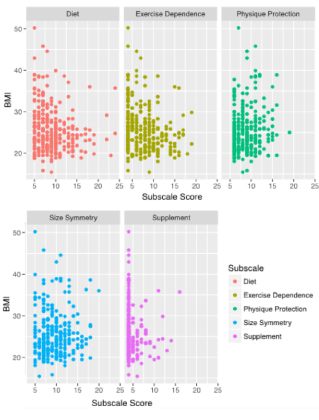
Figure 11. BMI vs. Subscales: As the BMI increased, the Diet Subscale score significantly decreased and Physique Protection Subscale scores increased. Diet (p=0.00241), Physique Protection (p=0.0374). Participants with higher BMIs were more likely to score a “response > 4” on the Supplement Subscale (p=0.00927).
Previous research indicates a strong relationship between body dissatisfaction and drive for muscularity, to the point of the development of muscle dysmorphia in some male populations, mostly weightlifters [22,23]. In the present study, it was determined that there is a similar link between body appreciation and drive for muscularity among certain female populations as well. In general, research suggests that women desire a relatively thinner body type than their own, even if they are perceived as having a “normal” body [2].
The first hypothesis stated that participants who viewed the media exposure prior to taking the BAS would score lower on the BAS. This hypothesis was supported by the data, suggesting that the images shown triggered a body type self-analysis by the participant, causing her to evaluate herself more harshly. The effects of the images shown support the conclusions of previous studies, in which magazines serve as a primary form of media to promote unrealistic societal ideals, causing a more negative body appreciation [15].
Intuitive eating was found to have a negative correlation with the BAS scores. This may have been because the IES showed the amount of awareness of the participants when it comes to their eating habits, which may mean that they are constantly monitoring their food intake; i.e., portion size and content, even if they eat intuitively.
BMI scores had an inverse relationship with the scores from the BAS, indicating that as BMI increases, the body satisfaction of the individual decreases. This shows that there was an increase in body image dissatisfaction as the participants’ BMIs increased, due to the desire to be thinner. BMI was also shown to have an effect on the MDI subscale scores; an increase in BMI led to a decrease in the Diet MDI subscale scores and an increase in the Physique Protection subscale scores, indicating that the higher the BMI of the participant, the less drive for muscularity; therefore, a lower susceptibility to MD. However, participants with higher BMIs showed a higher level of body dissatisfaction. This could potentially lead to other forms of BDDs, if not a muscle-related BDD. These results support a recent study in which BMI has a negative effect on body appreciation [24]; however, the reason a lower drive for muscularity is not clear, but there was a clear drive for thinness within the higher BMI participants.
The second hypothesis was supported by the data of this study. The results showed a clear drive for muscularity among women, especially among competitive athletes. Non-athletes were found to score lower on the BAS than any type of athlete, which is inferred to be due to athletes’ higher confidence levels because of their exercise habits. Any form of athletics may act as a protective factor in regards to body appreciation, as athletes showed more of a body appreciation than non-athletes; however, athletes also showed a higher level of a drive for muscularity [25]. Athletes exhibited a higher risk for the development of muscle dysmorphia as seen in the relationship between DMS scores and MDI subscale scores. The DMS results showed that competitive athletes scored lower on the survey than non-athletes, indicating that they have a stronger drive for muscularity. This was further supported by the results of the MDI for competitive athletes as well. Competitive athletes scored higher on the MDI subscales than the other TOAs which indicates a higher risk for the development of MD. Competitive athletes often chose the answers from “often” to “always” where the questions ask about exercise habits that reflect a risk for the development of MD and other BDDs. This supports a previous research study where women restrict their food intake [19]. Lacking intuitive eating skills due to an increased drive for muscularity was shown overall in this study; however, the previous study was not particular to athletes. These athletes scored higher on all the subscales depicting that they have a strict workout schedule, use supplements, restrict their eating and perform other tasks to reach their specific muscle/weight goals.
Overall, the results of the present study indicate a shift in female body type desire. While a desire to be thin remains, there is a prevailing drive for muscularity in some women, which is leading to a higher susceptibility to MD, especially those who participate in competitive athletics.
It is important to examine women’s perception of their bodies, for this study had little evidence of the true self-perception of the participants. The insight of self-perception was only acknowledged through the BAS and DMS; however, these were appreciation questions rather than self-assessments. It is difficult to determine the true effects of media on body appreciation and drive for muscularity among women because this study does not address all age groups. Future research should include an adolescent/teen target group to further support the results of this study. This will allow for a wider range of input from various age groups rather than just adult women.
The study of the link between drive for muscularity and body satisfaction in women is extremely important because it allows for the understanding that the risk of the development of muscle dysmorphia may not be isolated to men. Media has been found to influence various realms of body image in both men and women; however, the prevailing drive for muscularity among women and media’s negative impact on female body satisfaction drives the necessity of research in this field. This study is one of the first to investigate women’s drive for muscularity and their risk for the development of muscle dysmorphia. Previous studies have included men and their drive for muscularity, but little is known with regard to whether or not the same patterns exist among women. Studies that have focused on MD in men have examined the consequences of this BDD which include physique protection and steroid or other supplement use [4,6]. This study suggests that media plays a significant role in women’s body image satisfaction and their interest in changing their body shape.
All authors contributed to the design, preparation, editing, and final review of the manuscript.
Authors thank Mrs. Barbara Franklin, research advisor at John F. Kennedy High School in Bellmore, NY for her contributions and guidance in the study procedure and manuscript development.
- Anderson-Fye E (2012) Anthropological Perspectives on Human Appearance and Body Image, The Encyclopedia of Body Image and Human Appearance. Ed. T. Cash, London: Elsevier Press, pp: 15-22.
- Skemp-Arlt KM, Rees KS, Mikat RP, Seebach EE (2006) Body Image Dissatisfaction among Third, Fourth, and Fifth Grade Children. Calif J Health Promot 43: 58-67
- Moore DC (1988) Body image and eating behavior in adolescent girls. Am J Dis Child 142: 1114-1118. [Crossref]
- Skemp KM, Mikat RP, Schenck KP, Kramer N (2013) Muscle Dysmorphia: Risk may be influenced by goals of the weightlifter. J Strength Cond Res 27: 2427-2432. [Crossref]
- Robert CA, Munroe-Chandler KJ, Gammage KL (2009) The Relationship Between the Drive for Muscularity and Muscle Dysmorphia in Male and Female Weight Trainers. J Strength Cond Res 23: 1656-1662. [Crossref]
- Pope HG Jr, Gruber AJ, Choi P, Olivardia R, Phillips KA (1997) Muscle dysmorphia. An underrecognized form of body dysmorphic disorder. Psychosomatics 38: 548-557. [Crossref]
- Rhea DJ, Lantz CD, Cornelius AE (2004) Development of the Muscle Dysmorphia Inventory (MDI). J Sports Med Phys Fitness 44: 428-435. [Crossref]
- Choi PY, Pope HG Jr, Olivardia R (2002) Muscle Dysmorphia: A New Syndrome in Weightlifters. Br J Sports Med 36: 375-377. [Crossref]
- McCreary DR (2011) Body image and muscularity. In Cash TF, Smolak L (Eds.) Body image: A handbook of science, practice, and prevention. New York, NY, US: Guilford Press, pp: 198-205.
- Dohnt H, Tiggemann M (2006) The Contribution of Peer and Media Influences to the Development of Body Satisfaction and Self-Esteem in Young Girls: A Prospective Study. Dev Psychol 42: 929-936. [Crossref]
- Cramblitt B, Pritchard M (2013) Media's influence on the drive for muscularity in undergraduates. Eat Behav 14: 441-446. [Crossref]
- Levine MP, Smolak L (1996) Media as a context for the development of disordered eating. In: Smolak L, Levine M, editors. The Developmental Psychopathology of Eating Disorders: Implications for Research, Prevention, and Treatment. Hillsdale, NJ: Lawrence Erlbaum Associates Inc.
- Clark L, Tiggemann M (2007) Sociocultural Influences and Body Image in 9- to 12-year-old Girls: The Role of Appearance Schemas. J Clin Child Adolesc Psychol 36: 76-86. [Crossref]
- Fallon AE (1990) Culture in the mirror: Sociocultural determinants of body image. In Cash TF, Pruzinsky T (Eds.) Body images: Development, deviance, and change. New York: Guilford, pp: 80-109.
- Steinfeldt JA, Halterman AW, Gomory A, Gilchrist GA, Steinfeldt MC (2011) Drive for Muscularity and Conformity to Masculine Norms Among College Football Players. Psychol Men Masc 12: 324-338.
- Levine MP, Smolak L, Hayden H (1994) The relation of sociocultural factors to eating attitudes and behaviors among middle school girls. J Early Adolesc 14: 471-490.
- Thompson JK, Heinberg LJ (1999) The Media's Influence on Body Image Disturbance and Eating Disorders: We've Reviled Them, Now Can We Rehabilitate Them? J Soc Issues 55: 339-353.
- Avalos LC, Tylka TL (2006) Exploring a model of intuitive eating with college women. J Couns Psychol 53: 486-497.
- Tylka TL (2006) Development and psychometric evaluation of a measure of intuitive eating. J Couns Psychol 53: 226-240.
- McCreary DR (2013) Drive for Muscularity Scale (DMS). Measurement Instrument Database for the Social Science. Retrieved from www.midss.ie
- Dean CB, Nielsen JD (2007) Generalized linear mixed models: a review and some extensions. Lifetime Data Anal 13: 497-512. [Crossref]
- Bergeron DP (2007) The Relationship Between Body Image Dissatisfaction and Psychological Health: An Exploration of Body Image in Young Adult Men, Ph.D. The Ohio State University.
- Pope CG, Pope HG, Menard W, Fay C, Olivardia R, et al. (2005) Clinical Features of Muscle Dysmorphia among Males with Body Dysmorphic Disorder. Body Image 2: 395-400. [Crossref]
- Zawawi, JA (2014) Relationships between Body Mass Index, Body Image Dissatisfaction and Psychological Distress among Fitness Center Female Users in Zarqa-Jordan. Int J Humanit Soc Sci 4: 109-130.
- Karr TM (2010) Factors of Body Image Dissatisfaction among High School Female Athletes, Ph.D. Loyola University Chicago.