Abstract
Two simple spectrophotometric methods (I and II) are described for the determination of rivaroxaban in bulk and tablets. Method I is based on the reaction of rivaroxaban with 4-Chloro-7-nitrobenzo-2-oxa-1,3-diazole in alkaline medium. Method II involved the reaction of rivaroxaban with p-Dimethylaminocinnamaldehyde in acidic medium. The reactions products were measured at 405 nm and 545 nm for methods I and II, respectively. Beer's law was obeyed over the concentration ranges of 2-20 μg/mL and 25-125 μg/mL with lower limits of detection of 0.110 μg/mL and 0.483 μg/mL for Methods I and II, respectively. Percent recovery of rivaroxaban for both methods I and II were found in the range of 99.74-100.51% with relative standard deviation in the range of 0.621-0.900%. The proposed methods I and II were successfully applied for quantification of rivaroxaban in tablet dosage forms with good accuracy and precision. Hence, the proposed methods I and II can be suitably adopted for routine analysis of rivaraxaban.
Key words
Rivaroxaban,4-chloro-7-nitrobenzo-2-oxa-1,3-diazole, p-dimethylaminocinnamaldehyde, tablets, spectrophotmetric analysis.
Introduction
Rivaroxaban (RXN), chemically also known as (S)-5-Chlor-N-{2-oxo-3-[4-(3-oxomorpholin-4-yl) phenyl]-1,3-oxazolidin-5-ylmethyl}thiophen-2-carbamide. RXN is a novel, oral, direct Factor Xa inhibitor approved for the management of deep vein thrombosis and pulmonary embolism [1-3]. RXN is also employed to cut down the danger of forming a blood clot in the legs and lungs of adult patients who have undergone hip or knee replacement surgery [4,5]. RXN is a direct Factor Xa inhibitor, which binds directly to free and clot bound factor Xa. After binding, it effectively blocks the amplification of the coagulation cascade, preventing the formation of thrombus [6].
A variety of analytical methods have been proposed for the estimation of RXN in bulk, pharmaceutical dosage form and biological fluids. They include factor Xa specific chromogenic substrate assay [7], anti-Factor Xa chromogenic assay [8-10], prothrombin time assay [11], HPLC-MS/MS [12-14], HPTLC [15,16], HPLC [16-26] and UPLC [27]. The above reported methods suffer from drawbacks such as time consuming, cumbersome procedure, costly and require an expertise operational personal [7-27]. Some of the methods are applicable only for the plasma samples [7-14].
Spectrophotometry is an analytical technique for the enhancement of sensitivity, simplicity, cost effectiveness and specificity in quantitative analysis of a variety of pharmaceutical compounds. In the existing literature, there are few reports regarding the use of spectrophotometry for the quantification of RXN in bulk and tablet dosage forms. Determination of RXN in the presence of its alkaline degradation products by two different approaches is proposed by Lories et al. [16]. The first method is the zero-crossing first-order spectrophotometry technique, in which 236 nm is chosen as λmax for the determination of RXN. The second method is the first derivative ratio spectra in which the absorption spectra of RXN with different concentrations were recorded in the range of 200-400 nm and the spectra obtained were divided by a spectrum of alkaline degradates. The ratio spectra were smoothed with Δλ=4 intervals and their first derivatives were traced with the same Δλ. The concentration of RXN was determined by measuring the amplitude at λmax 234 nm.
Muralikrishna & Kasad [28] and Sekaran et al., [29] described UV spectrophotometric methods for the quantification of RXN. Measurement of the absorbance of methanolic solution of RXN at 248.6 nm and dimethyl sulphoxide solution of RXN at 270 nm has served as the basis for the determination of RXN in the methods of Muralikrishna & Kasad [28] and Sekaran et al., [29], respectively. The area under curve spectrophotometry technique proposed by Kasad & Muralikrishna [30] involves the calculation of integrated value of absorbance of RXN in methanol solution with respect to the wave length between two selected wave lengths 241 nm and 260 nm. The UV spectrophotometric methods [16,28-30] are simple but they suffer from lack of selectivity as they involve measurements at shorter wavelength. Sekaran et al., [29] method is not applied to tablet dosage forms.
Satyanarayana & Madhavi have proposed five visible spectrophotometric methods (A-E) for the quantification of RXN in formulations [31]. The reaction schemes involved in the five methods are: oxidation of RXN with ferric chloride and the estimation of Fe (II) produced after chelation with 2,2’-bipyridyl (method A); Schiff’s base formation of the RXN with 4-amino phenazone (method B); Charge transfer complexation of RXN with haematin formed from the reaction between haematoxyline and chloramine T in basic media (method C); Condensation of RXN with isonicotinic hydrazide (method D); and Condensation of RXN with 1,2-napthaquinone-4-sulfonic acid sodium in alkaline media (method E). The Satyanarayana & Madhavi [31] methods suffers from one or more disadvantages like less sensitive, lack of accuracy & precision and requirement of extraction procedure. The Satyanarayana & Madhavi [31] methods were not fully validated according to ICH guidelines. The reaction optimization details, method validation parameters such as selectivity, robustness and ruggedness were not reported in the methods of Satyanaryana & Madhavi [31].
As an electroactive halide reagent, 4-Chloro-7-nitrobenzo-2-oxa-1,3-diazole (NBD) was used as an analytical reagent for the estimation of a number of amines and amino acids [32]. NBD has been used as a fluorogenic or chromogenic reagent in pharmaceutical analysis. The analysis of different compounds/drugs either in pharmaceuticals/biological samples was performed after derivatization with NBD followed by measuring the resulted product by means of spectrophotometry [33-38] and spectrofluorimetry [39,40]. Due to electrophilic properties, NBD has also been used in charge transfer reactions. This property is used in the quantification of various β-blockers [41], skeletal muscle relaxant [33] and antihistaminic drugs [33].
Under the appropriate conditions, enamines are formed by the condensation of a secondary amine with an aldehyde or ketone in the presence of an acid catalyst [42,43]. The formation of enamine forms the basis for the quantification of compounds of pharmaceutical significance using spectrophotometry [44-46]. The condensation of p-dimethylaminocinnamaldehyde (PDAC), also referred as Renz and Loew reagent [47], with compounds having secondary amine to form enamines has been applied for their quantification using spectrophotometry [48,49].
In the present study, the authors investigated the reaction of RXN with NBD (method I) & PDAC (method II) and employed these reactions in the development of two new spectrophotometric methods for the determination of RXN in bulk and tablets. The developed methods were fully validated following the ICH guide lines. The performance of the reported and proposed spectrophotometric methods is tabulated in Table 1.
Materials and methods
Instrumentation
- ELICO (Hyderabad, India) double beam model SL 159 digital spectrophotometer with one cm matched quartz cells.
- Kemi (Ernakulam, India) KWB 220 model water bath.
- Essae-Teraoka electronic weighing balance (Goa, India) PG1000 model.
- Elico (Hyderabad, India) LI120 model pH meter.
Reagents: All chemicals were of analytical reagent grade. All the solutions were prepared afresh daily. 0.1% (w/v) NBD (Merck, Mumbai, India) in methanol (Merck, Mumbai, India) and 0.2 M Borate buffer (pH-7.8) were prepared and used in method I. 3% (w/v) PDAC (Sd fine Chem Ltd., Mumbai, India) in methanol and sulphuric acid (Sd fine Chem Ltd., Mumbai, India) were used in method II.
Standard solutions: Pharmaceutical grade RXN was obtained as gifted sample from MSN laboratories, Hyderabad, India. RXN was used as received. Tablet dosage forms of RXN (Xeralto tablets, Bayer India Limited Mumbai, India, labeled to contain 10 mg of RXN/tablet) were employed in the present investigation. A stock standard solution containing 1 mg/mL of RXN was prepared in methanol. Working standard solution equivalent to 100 μg/mL (method I) and 500 μg/mL (method II) of RXN were obtained by appropriate dilution of stock solution with methanol.
General analytical method
Method I: Into a series of boiling test tubes, different volumes (0.2-2.0 mL) of RXN (100 μg/mL) were pipetted. To each test tube, 3 mL of borate buffer and 1.0 mL of 0.1% NBD were added, mixed well, and heated on a water bath at 60°C for 25 min. The tubes were cooled at room temperature, and then the contents of the tubes were transferred to 10 mL volumetric flasks. To each flask 0.2 mL of HCl was added and diluted to volume with methanol. The absorbance of each solution was measured at 405 nm against a reagent blank treated similarly except without drug.
Method II: Into a series of 10 mL volumetric flasks, different volumes (0.5-2.5 mL) of RXN (500 μg/mL) were pipetted. To each test tube, 2 mL of 3% PDAC and 1.0 mL of H2SO4 were added, mixed well, and kept aside for 10 min at room temperature. The contents of the flasks were diluted to volume with methanol. The absorbance of each solution was measured at 545 nm against a reagent blank treated similarly except without drug.
Construction of calibration curve: For both the proposed methods (A and B), the calibration curves were constructed by plotting the absorbance against the final concentration of the drug. The corresponding regression equations were derived. The concentration of the unknown samples were read from the corresponding calibration graph or computed from the corresponding regression equation.
Procedure for the analysis of RXN in tablet dosage forms: Twenty Xeralto tablets (Bayer India Limited Mumbai, India) claimed to contain 10 mg of RXN were weighed and pulverized. An amount of powder equivalent to 100 mg of RXN was weighed into a 100 ml volumetric flask, 50 mL of methanol was added and shaken thoroughly for about 10 min. The volume of the flask was diluted up to the mark with the same solvent, mixed well and filtered using a quantitative filter paper. The filtered solution was suitably diluted with the methanol. Convenient aliquots were subjected to analysis by the procedures described under methods I and II. The nominal content of RXN in the tablet was calculated from the corresponding calibration curve or regression equation.
Results and discussion
Basis of the color reaction
Method I: Novel spectrophotometric methods were developed through derivatization of the secondary amino group of the drug with NBD, which is known to react with primary and secondary amines forming stable condensation colored products. The method I is based on condensation of secondary amine in the RXN with NBD in the presence of alkaline borate buffer (pH 7.8). The colored complex has a characteristic absorption spectrum with a maximum absorption at 405 nm against the reagent blank (Figure 1). The proposed reaction scheme is presented in (Figure 2).
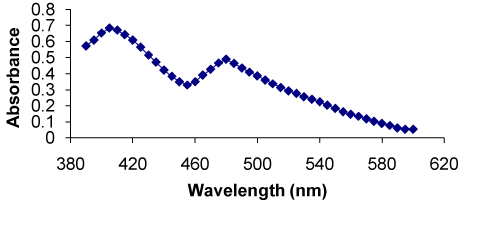
Figure 1. Absorption spectra of RXN-NBD complex
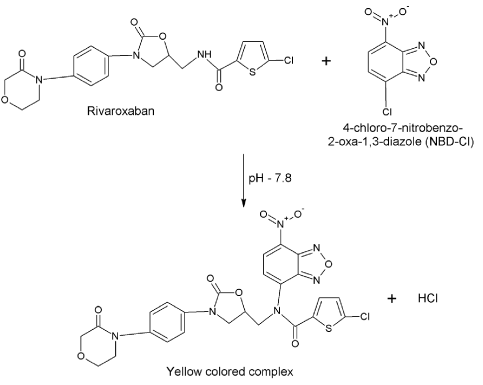
Figure 2. Condensation reaction between rivaroxaban and 4-chloro-7-nitrobenzo-2-oxa-1,3-diazole
Method II: Primary and secondary amino groups present in the drug undergo condensation with carbonyl reagents (such as p-dimethylaminobenzaldehyde, p-dimethylamino cinnamaldehyde and vanillin) in acidic condition to form colored chromogen with characteristic absorption maxima. This reaction was utilized in the present investigation for the determination of RXN by the method II. The secondary amino group of RXN was found to react with PDAC in the presence of sulphuric acid as a catalyst resulting in formation of a red colored enamine complex. The colored complex has a characteristic absorption spectrum with a maximum absorption at 545 nm against the reagent blank (Figure 3). The probable reaction mechanism is given in (Figure 4).
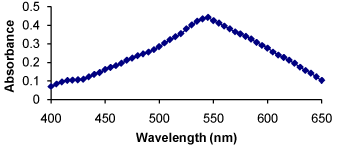
Figure 3. Absorption spectra of RXN-PDAC complex
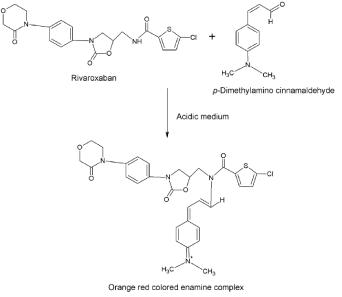
Figure 4. Enamine complex formation between rivaroxaban and p-dimethylamino cinnamaldehyde
Optimization of experimental conditions
The experimental conditions in method I were established by studying the effect of various parameters like volume and concentration of NDB, buffer pH, temperature and reaction time for the maximum and stable color development. The results are incorporated in (Table 2) (Figure 5-8).
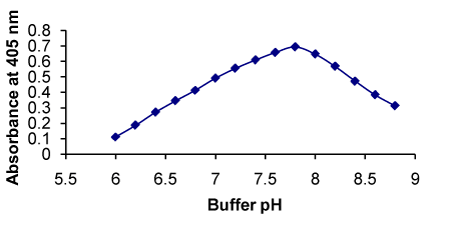
Figure 5. Effect of pH on the formation of RXN-NBD complex
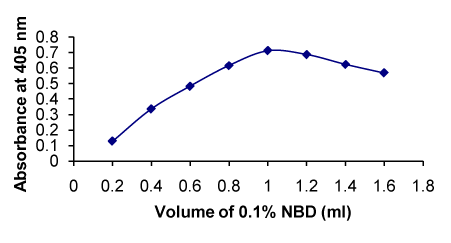
Figure 6. Effect of concentration of NBD on the formation of RXN-NBD complex
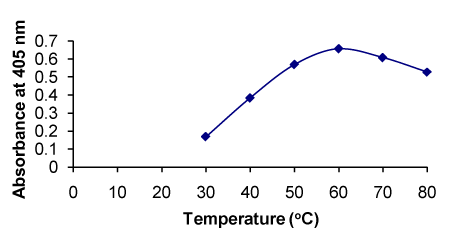
Figure 7. Effect of temperature on the formation of RXN-NBD complex
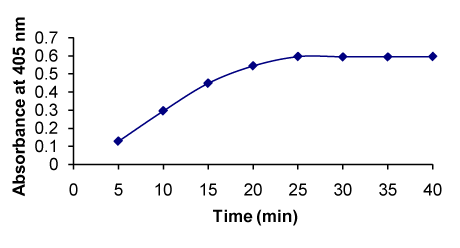
Figure 8. Effect of time on the formation of RXN-NBD complex
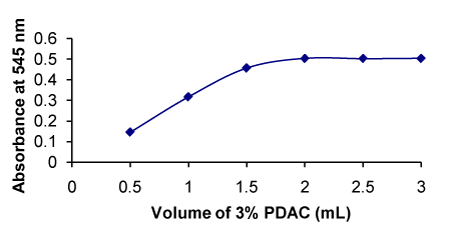
Figure 9. Effect of concentration of PDAC on the formation of RXN-PDAC complex
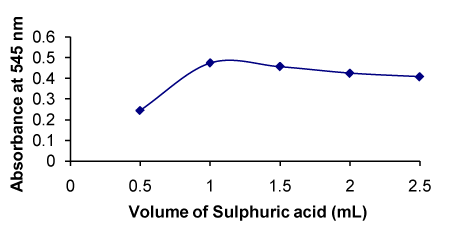
Figure 10. Effect of concentration of sulphuric acid on the formation of RXN-PDAC complex
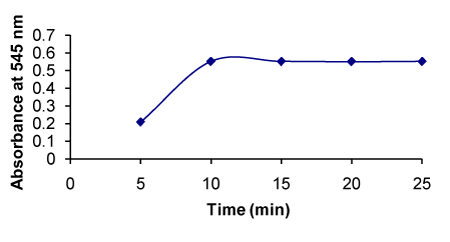
Figure 11. Effect of time on the formation of RXN-PDAC complex
Sl
no. |
Reagent/
sovent |
λ max
(nm) |
linearity (µg/mL) |
LOD & LOQ (µg/mL) |
RSD
(%) |
Recovery
(%) |
Reference |
1 |
ACN |
237.4 |
16-224 |
0.52 & 1.86 |
1.329 |
99.52 |
16 |
2 |
ACN |
amplitude at 234 |
16-224 |
0.62 & 0.65 |
0.639 |
100.84 |
3 |
MeOH |
248.6 |
2-12 |
0.09842 & 0.2982 |
0.023-0.915 |
100.85 |
28 |
4 |
DMSO |
270 |
2-20 |
0.212 & 0.642 |
0.01- 0.50 |
99.82-100.50 |
29 |
5 |
MeOH |
241 & 260 |
2-12 |
0.059 & 0.179 |
0.297-0.537 |
99.31 |
30 |
6 |
BPD |
470 |
2-20 |
0.03 & 0.1 |
0.47 |
98.17 |
31 |
7 |
AP |
450 |
3-21 |
0.15 & 0.5 |
0.88 |
98.58 |
8 |
HMN |
740 |
30-90 |
9 & 10 |
0.94 |
98.53 |
9 |
INH |
470 |
5-30 |
0.15 & 0.5 |
0.52 |
99.30 |
10 |
NQS |
500 |
15-90 |
1.5 & 5 |
1.02 |
99.25 |
11 |
NBD |
405 |
2-20 |
0.110 & 0.333 |
0.252-0.487 |
99.75-100.20 |
Proposed method I |
12 |
PDAC |
545 |
25-125 |
0.483 & 1.463 |
0.408-0.692 |
99.74-100.50 |
Proposed method II |
Table 1. Performance of proposed and reported spectrophotometric methods for the assay of RXN
(ACN-Acetonitrile; MeOH-Methanol; DMSO-dimethyl sulphoxide; BPD-2,2-Bipyridine; AP-4-Amino phenazone; HMN- Haematoxylin; NQS-1,2-Naphthaquinone-4-sulphonate; 1,10-PTL-1,10-Phenanthroline; CH3CHO/CRL-Acetaldehyde/Chloranil; NBD- 4-Chloro-7-nitrobenzo-2-oxa-1,3-diazole; PDAC- p-Dimethylaminocinnamaldehyde).
Parameter |
Investigation conditions |
Optimized condition |
Remarks |
Effect of pH of buffer |
6.0-8.8 |
7.8 |
The absorbance increases in the media of pH from 6.0-7.8 and there is a decrease in the absorbance with the further raise in pH (Figure 5) |
Volume of 0.1% NDB (mL) |
0.2-1.6 |
1.0 |
One mL of NDB gave maximum absorbance. There is decrease in the absorbance with further increase in the volume of reagent (Figure 6) |
Temperature (0 C) |
30–80 |
60 |
The absorbance increased with increasing temperature up to 60°C, and higher temperature had negative effect (Figure 7). |
Effect of reaction time (min) |
5 – 40 |
25 |
Maximum absorbance was obtained after 25 min of heating and remained constant up to 40 min (Figure 8). |
Table 2. Optimization of conditions for the assay of RXN by Method I.
The experimental conditions in method II were established by studying the effect of various parameters like volume and concentration of PDAC, H2SO4 and effect of reaction time for the maximum color development. The results are incorporated in (Table 3) (Figure 9-11).
Parameter |
Investigation conditions |
Optimized condition |
Remarks |
Volume of 3% PDAC (mL) |
0.5-3.0 |
2.0 |
One mL of PDAC gave the highest absorbance value and there is no change in the absorbance with further raise in the volume (Figure 9). |
Volume of H2SO4 (mL) |
0.5-2.5 |
1.0 |
The absorbance was increased with increasing volume of H2SO4 and became constant at 1.0 mL; above this volume, the absorbance slightly decreased (Figure 10). |
Effect of reaction time (min) |
5 – 25 |
10 |
Maximum absorbance was obtained after 10 min and remained constant with increase in time (Figure 11). |
Table 3. Optimization of conditions for the assay of RXN by Method II
Method validation
The developed methods were validated by following ICH guidelines [50].
Beer’s law and sensitivity: Calibration graph for the quantification of RXN was prepared under the optimum experimental conditions. Method I obeys Beer’s law in the concentration range of 2-20 µg/mL with the regression equation A405 = 0.0348x + 0.0103 (x=concentration of RXN in µg/mL). The Sandell’s sensitivity and molar absorptivity of method A are 2.73 x 10⁻³ µg/cm2 and 1.590 x 10⁵ L/mol/cm of RXN, respectively.
Method II obeys Beer’s law in the concentration range of 10-100 µg/mL with the equation A545 = 0.0061x + 0.0087 (x=concentration of RXN in µg/mL). The Sandell’s sensitivity and molar absorptivity of method B are 1.48 × 10⁻² µg/cm2 and 2.929 x 10⁴ L/mol/cm of RXN, respectively.
The regression coefficient value of the standard curves for methods I and II were found to be 0.9993, showing good linearity of the developed methods. The calculated limits of detection and quantitation values were 0.110 µg/mL and 0.333 µg/mL, respectively, for method I, and their respective values for method II were 0.483 µg/mL and 1.463 µg/mL.
Precision and accuracy: The precision and accuracy of the proposed methods I and II were determined using intra-day and inter-day analyses of three standard concentrations of RXN (method I – 2, 10 and 20 µg/mL: method II – 25, 60 and 125 µg/mL) in replicates (n = 5). The results are shown in Table 4. The percent relative standard deviation and percent recovery values show that the precision and accuracy, respectively, is satisfactory for both the proposed methods Table 4.
Method |
Concentration of RXN (μg/mL) |
Recovery
(%) |
RSD
(%) |
Taken |
Found* |
Intra-day analysis |
I |
2 |
1.985 |
99.25 |
0.252 |
10 |
9.962 |
99.62 |
0.371 |
20 |
20.065 |
100.32 |
0.294 |
II |
25 |
24.982 |
99.92 |
0.460 |
60 |
60.115 |
100.19 |
0.606 |
125 |
124.955 |
99.96 |
0.627 |
Inter-day analysis |
I |
2 |
2.005 |
100.25 |
0.299 |
10 |
10.055 |
100.55 |
0.487 |
20 |
19.986 |
99.93 |
0.485 |
II |
25 |
24.995 |
99.98 |
0.408 |
60 |
59.945 |
99.91 |
0.692 |
125 |
124.855 |
99.88 |
0.534 |
Table 4. Evaluation of precision and accuracy of the proposed methods (*Average of five determinations).
Recovery study: The accuracy of the proposed methods was further evaluated using recovery studies. Samples of tablet solution were spiked with pure RXN at three concentration levels (50,100 and 150 % of that in tablet). The total concentration of RXN was determined by the proposed methods. The results of recovery studies were given in Table 5. The percent recovery values indicated that the recovery was good. The co-formulated substances in the tablet did not interfere in the determination of RXN by the proposed methods.
Selectivity: The selectivity of the proposed methods was established by observing any interference from the common tablet excipients. A placebo blank containing starch (20 mg), hydroxyl cellulose (25 mg), acacia (15 mg), lactose (20 mg), sodium citrate (30 mg), talc (20 mg), sodium alginate (25 mg) and magnesium stearate (25 mg) was prepared by mixing all the excipients into a homogeneous mixture. 100 mg of the placebo blank was precisely weighed and transferred to a volumetric flask (100 mL) and its solution was prepared as explained under section “Procedure for the analysis of RXN in tablet dosage forms”. The placebo blank solution was analyzed by following the general analytical methods I and II. The absorbance values of placebo blank solution and the reagent blank solutions of the proposed methods were almost equal. The results obtained from analysis of placebo blank shown that common excipients used in the tablet preparation did not obstruct the assay of RXN.
Robustness: The robustness of proposed methods was tested by changing the following experimental parameters:
Method I
- Buffer pH (7.8 ± 0.2)
- Volume of 0.1% NBD (1.0 ± 0.1 mL)
- Temperature (60 ± 2 0C)
- Reaction time (25 ± 2 min)
- Volume of HCl (0.2 ± 0.05 mL)
Method II
- Volume of 3 % PDAC (2.0 ± 0.2 mL)
- Volume of H2SO4 (1.0 ± 0.1 mL)
- Reaction time (10 ± 2 min)
The robustness of the methods was evaluated at two different concentration levels (method I – 2 and 20 µg/mL: method II – 25 and 125 µg/mL). The results are shown in Table 6. The results showed no statistical differences suggesting that the proposed methods were robust.
Method |
Nominal amount (mg/tablet) |
Amount of RXN
added (mg) |
Found* |
RSD
(%) |
Recovery
(%) |
A |
10 |
5 |
15.036 |
0.652 |
100.24 |
10 |
10 |
19.952 |
0.621 |
99.76 |
10 |
15 |
24.963 |
0.941 |
99.85 |
B |
10 |
5 |
14.968 |
0.641 |
99.79 |
10 |
10 |
20.102 |
0.900 |
100.51 |
10 |
15 |
24.934 |
0.770 |
99.74 |
Table 5. Results of recovery study of the proposed methods (*Average of five determinations).
Method |
Parameter |
Concentration of RXN (μg/mL) |
Recovery (%) |
RSD
(%) |
Taken |
Found* |
I |
Buffer pH
(7.8 ± 0.2) |
2 |
2.021 |
101.05 |
0.445 |
20 |
19.962 |
99.81 |
0.606 |
Volume of 0.1% NBD (1.0 ± 0.1 mL) |
2 |
1.988 |
99.40 |
0.505 |
20 |
20.014 |
100.07 |
0.569 |
Temperature
(60 ± 2 0C) |
2 |
2.035 |
101.75 |
0.640 |
20 |
19.949 |
99.75 |
0.631 |
Reaction time
(25 ± 2 min) |
2 |
1.965 |
98.25 |
0.765 |
20 |
20.046 |
100.23 |
0.688 |
Volume of HCl
(0.2 ± 0.05 mL) |
2 |
1.978 |
98.90 |
0.964 |
20 |
20.041 |
100.21 |
0.763 |
II |
Volume of 3 % PDAC
(2.0 ± 0.2 mL) |
25 |
25.055 |
100.22 |
0.754 |
125 |
124.965 |
99.97 |
0.613 |
Volume of H2SO4
(1.0 ± 0.1 mL) |
25 |
24.962 |
99.85 |
0.833 |
125 |
124.955 |
99.96 |
0.674 |
Reaction time
(10 ± 2 min) |
25 |
24.935 |
99.74 |
0.786 |
125 |
124.929 |
99.94 |
0.530 |
Table 6. Evaluation of robustness of the proposed methods (*Average of three determinations).
Ruggedness: Ruggedness of the proposed methods was determined by the analysis of RXN standard solutions (method I – 2 and 20 µg/mL: method II – 25 and 125 µg/mL)) by two different instruments and two different analysts using the same experimental conditions. The selected variables evaluated in the ruggedness testing are given in Table 7. No significant statistical difference was observed in the results, thus demonstrating that the proposed methods were rugged.
Method |
Parameter |
Concentration of RXN (μg/mL) |
Recovery (%) |
RSD
(%) |
Taken |
Found* |
I |
Analyst I |
2 |
1.987 |
99.35 |
0.604 |
20 |
20.054 |
100.27 |
0.573 |
Analyst II |
2 |
2.005 |
100.25 |
0.399 |
20 |
19.944 |
99.72 |
0.476 |
Instrument I |
2 |
1.985 |
99.25 |
0.756 |
20 |
19.826 |
99.13 |
0.570 |
Instrument II |
2 |
1.995 |
99.75 |
0.501 |
20 |
20.070 |
100.35 |
0.827 |
II |
Analyst I |
25 |
25.015 |
100.06 |
0.628 |
125 |
124.568 |
99.65 |
0.448 |
Analyst II |
25 |
24.755 |
99.02 |
0.686 |
125 |
125.042 |
100.03 |
0.521 |
Instrument I |
25 |
24.96 |
99.84 |
0.781 |
125 |
124.445 |
99.56 |
0.387 |
Instrument II |
25 |
24.995 |
99.98 |
0.816 |
125 |
125.065 |
100.05 |
0.454 |
Table 7. Evaluation of ruggedness of the proposed methods (*Average of three determinations)
Application of the proposed methods to tablets: Both the methods were applied successfully to the analysis RXN in tablets (Xeralto tablets, labeled to contain 10 mg of RXN per tablet). Satisfactory results were obtained (Table 8). The results are in good agreement with label claim. The proposed methods, therefore, are suitable for the determination of RXN in tablets with adequate accuracy and precision.
Method |
Labeled claim (mg/tablet) |
Found* |
RSD
(%) |
Recovery
(%) |
I |
10 |
9.965 |
0.722 |
99.650 |
II |
10 |
10.024 |
0.738 |
100.240 |
Table 8. Determination of RXN in tablets by the proposed methods (*Average of five determinations).
Conclusion
The present study reported the successful evaluation of 4-Chloro-7-nitrobenzo-2-oxa-1,3-diazole (method I) and p-Dimethylaminocinnamaldehyde (method II) as chromogenic reagents in the development of two spectrophotometric methods for the precise and accurate determination of RXN in bulk and in its tablet dosage forms. The developed methods are fully validated as per the ICH guidelines. The developed methods do not need expensive sophisticated apparatus. The proposed methods are sensitive, selective, robust, rugged, precise and accurate. The colored complexes produced in methods I and II remains stable for at least 60 min. This gives the high throughput property to the proposed methods. Therefore, the methods A and B are valuable for its routine application in quality control laboratories for analysis of RXN.
Acknowledgement
One of the authors, B. S. V. Seshamamba is grateful to the Department of Food Chemistry and Nutrition, College of Food Science and Technology, Bapatla for their continuous support & encouragement and for providing the necessary facilities.
Conflict of interest
The authors have no conflict of interest in this study.
References
- Singer AJ, Xiang J, Kabrhel C, Merli GJ, Pollack C, et al. (2016) Multicenter trial of rivaroxaban for early discharge of pulmonary embolism from the emergency department (MERCURY PE): Rationale and design. Acad Emerg Med 23: 1280-1286.
- Ewa H, Marzena O (2016) Rivaroxaban – a safe therapeutic option in patients with antiphospholipid syndrome? Our experience in 23 cases. Reumatologia 54: 146-149.
2021 Copyright OAT. All rights reserv
- Michael BS, Giancarlo A, Jean MC, Mark C, Sabine E, et al. (2016) Guidance for the treatment of deep vein thrombosis and pulmonary embolism. J Thromb Thrombolysis 41: 32–67.
- Duggan ST, Scott LJ, Plosker GL (2009) Rivaroxaban: A review of its use for the prevention of venous thrombo embolism after total hip or knee replacement surgery. Drugs 69: 1829-1851.
- Guang-Zhi N, Shun-Li K, Ling-Xiao C, Lei S, Shi-Qing F, et al. (2016) Rivaroxaban for thromboprophylaxis after total hip or knee arthroplasty: a meta-analysis with trial sequential analysis of randomized controlled trials. Sci Rep 6: 23726.
- Elisabeth P, Susanne R, Alexander S, Dagmar K, Wolfgang M, et al. (2010) Rivaroxaban: A new oral factor Xa inhibitor. Arterioscler Thromb Vasc Biol 30: 376-381.
- Harenberg J, Kramer R, Christina G, Svetlana M, Christel W, et al. (2011) Determination of rivaroxaban by different factor Xa specific chromogenic substrate assays: reduction of interassay variability. J Thromb Thrombolysis 32: 267-271.
- Asmis LM, Alberio L, Angelillo-Scherrer A, Korte W, Mendez A, et al. (2012) Rivaroxaban: Quantification by anti-FXa assay and influence on coagulation tests A study in 9 Swiss laboratories. Thromb Res 129: 492-498.
- Mani H, Rohde G, Stratmann G, Hesse C, Herth N, et al. (2012) Accurate determination of rivaroxaban levels requires different calibrator sets but not addition of antithrombin. Thromb Haemost 108: 191-198.
- Samama MM, Contant G, Spiro TE, Perzborn E, Guinet C, et al. (2012) Rivaroxaban anti-factor xa chromogenic assay field trial laboratories. Evaluation of the anti-factor Xa chromogenic assay for the measurement of rivaroxaban plasma concentrations using calibrators and controls. Thromb Haemost 107: 379-387.
- Samama MM, Contant G, Spiro TE, Perzborn E, Flem LL, et al. (2012) Rivaroxaban prothrombin time field trial laboratories. Evaluation of the prothrombin time for measuring rivaroxaban plasma concentrations using calibrators and controls: results of a multicenter field trial. Clin Appl Thromb/Hemost 18: 150-158.
- Rohde G (2008) Determination of rivaroxaban--a novel, oral, direct Factor Xa inhibitor--in human plasma by high-performance liquid chromatography-tandem mass spectrometry. J Chromatogr B Analyt Technol Biomed Life Sci 872: 43-50.
- Ramisetti NR, Kuntamukkala R (2014) Development and validation of a stability indicating LC-PDA-MS/MS method for separation, identification and characterization of process related and stress degradation products of rivaroxaban. RSC Adv 4: 23155–23167.
- Reddy GS, Reddy SLNP, Reddy LSK (2016) Development and validation of Hplc-Ms/Ms method for rivaroxaban quantitation in human plasma using solid phase extraction procedure. Orient J Chem 32: 1145-1154.
- Darshna V, Pinak P (2014) High performance thin layer chromatographic method with densitometry analysis for determination of rivaroxaban from its tablet dosage form. Int J Pharm Pharm Sci 6: 383-386.
- Lories IB, Mostafa AA, Girges MA (2013) High performance liquid chromatography, TLC densitometry, First-derivative and First-derivative ratio spectrophotometry for determination of rivaroxaban and its alkaline degradates in bulk powder and its tablets. J Chromatogr Sep Tech 4: 1-6.
- Satyanarayana PVV, Madhavi AS (2012) RP-HPLC method development and validation for the analyisis of rivaroxaban in pharmaceutical dosage forms. Int J Sci Inno Dis 2: 226-231.
- Chandra sekhar K, Vani PS, Dhana lakshmi A, Devi CHLL, Anupama B, Narendra D (2012) A new method development and validation for analysis of rivaroxaban in formulation by RP HPLC. Res Desk 1: 24-33.
- Kasad PA (2013) Photolytic-thermal degradation study and method development of rivaroxaban by RP-HPLC. Int J PharmTech Res 5: 1254-1263.
- Kasad PA, Muralikrishna KS (2013) Method development and acid degradation study of rivaroxaban by RP-HPLC in bulk. Asian J Pharm Anal 3: 62-65.
- Kasad PA, Muralikrishna KS (2013) Design and validation of dissolution profile of rivaroxaban by using RP-HPLC method in dosage form. Asian J Pharm Anal 3: 75-78.
- Celebier M, Recber T, Kocak E, Altınoz S (2013) RP-HPLC method development and validation for estimation of rivaroxaban in pharmaceutical dosage forms. Brazilian J Pharm Sci 49: 359–366
- Seshamamba PSV, Veera PV, Sekaran CB (2014) Application of stability indicating HPLC method with UV detector to the analysis of rivaroxaban in bulk and tablet dosage form. Chem Sci Trans 3: 1546-1554.
- Hetal J, Batuk D, Madhavi P, Yashwant sinha J, et al. (2015) Stress study and estimation of a potent anticoagulant drug rivaroxaban by a validated HPLC method: Technology transfer to UPLC. J Chem Pharm Res 7: 65-74 .
- Maurício EW, Rafaela FP, Francielle SDS, Clóvis DACJ, Iorhann SS, et al. (2015) Development and validation of a stability-indicating RP-HPLC method for the determination of rivaroxaban in pharmaceutical formulations. Lat Am J Pharm 34: 1503-1510.
- Çelebier M, Reçber T, Koçak E, Altınöz S, Kır S (2016) Determination of rivaroxaban in human plasma by solid-phase extraction-high performance liquid chromatography. J Chromatogr Sci 54: 216-220.
- Rao PSP, Cholleti VK, Reddy VR (2015) Stability-indicating UPLC method for determining related substances and degradants in rivaroxaban. Int J Res Pharm Sci 5: 17– 24.
- Muralikrishna KS, Kasad PA (2013) Spectrophotometric method for determination of rivaroxaban in bulk and tablet formulation and its validation. Inventi Rapid: Pharm Analysis & Quality Assurance 2013: Article ID- " Inventi:ppaqa/699/13".
- Sekaran CB, Bind VH, Damayanthi MP, Sireesha A (2013). Development and validation of UV spectrophotometric method for the determination of rivaroxaban. Der Pharma Chemica 5: 1-5.
- Kasad PA, Muralikrishna KS (2013) Area under curve spectrophotometric method for determination of rivaroxaban in bulk and tablet formulation and its validation. Asian J Res Pharm Sci 3: 109-113.
- Satyanarayana PVV, Madhavi AS (2012) New spectrophotometric methods for the quantitative estimation of rivaroxaban in formulations. Int J Res Rev Pharma Appl Sci 2: 611-620.
- Saleh HM, Al-Ghannam ShM (2000) Colourimetric determination of aromatic amino acids. Alex J Pharm Sci 14: 25-29.
- Saleh HM, El-Henawee MM, Ragab GH, El-Hay SS (2007) Utility of NBD-Cl for the spectrophotometric determination of some skeletal muscle relaxant and antihistaminic drugs. Spectrochim Acta A Mol Biomol Spectrosc 67: 1284-1289.
- Rageh A, El-Shaboury S, Saleh G, Mohamed F (2010) Spectophotometric method for determination of certain cephalosporins using 4-chloro-7-nitrobenzo-2-oxa-1,3-diazole (NBD-Cl). Natural Science 2: 828-840.
- Elbashir AA, Amira ABA (2013) Development and validation of spectrophotometric method for determination of penicillamine (pa) in pharmaceutical formulation using 4-choro-nitrobenzo-2-oxa-1,3-diazol (NBD-CL). World J Anal Chem 1: 18-22.
- Onal A (2011) Spectrophotometric and spectrofluorimetric determination of some drugs containing secondary amino group in bulk drug and dosage forms via derivatization with 7-Chloro-4-Nitrobenzofurazon. Quim Nova 34: 677-682.
- Walash MI, Metwally ME, Eid M, El-Shaheny RN (2012) Validated spectrophotometric methods for determination of alendronate sodium in tablets through nucleophilic aromatic substitution reactions. Chem Cent J 6: 25.
- Wahed MGA, El Sheikh R, Gouda AA, Taleb SA (2014) Kinetic spectrophotometric determination of gemifloxacin mesylate and moxifloxacin hydrochloride in pharmaceutical preparations using 4-chloro-7-nitrobenzo-2-oxa-1,3-diazole. J Spectrosc 2014: Article ID 917234, 12 pages.
- Al-Majed AA (2000) Specific spectrofluorometric quantification of d-penicillamine in bulk and dosage forms after derivatization with 4-fluoro-7-nitrobenzo-2-oxa-1,3-diazole. Anal Chim Acta 408: 169–175.
- Hassan ME, Belal F, Al-Deeb OA, Khalil NY (2001) Spectrofluorimetric determination of vigabatrin and gabapentin in dosage forms and spiked plasma samples through derivatization with 4-chloro-7-nitrobenzo-2-oxa-1,3-diazole. J AOAC Int 84: 1017-1024.
- Amin AS, Ragab GH, Saleh H (2002) Colorimetric determination of β-blockers in pharmaceutical formulations. J Pharm Biomed Anal 30: 1347-1353.
- Joseph BL, Wallace RB (1930) Condensations of secondary amines with aldehydes and naphthols. J Am Chem Soc 52: 1655–1659.
- Youngman MA, Dax SL (2001) Solid-phase Mannich condensation of amines, aldehydes, and alkynes: investigation of diverse aldehyde inputs. J Comb Chem 3: 469-472.
- Manikya ST, Ramakrishna K (2009) New spectrophotometric methods for the estimation of lercanidipine hydrochloride. Indian J Chem Technol 16: 431-436.
- Enoche FO (2010) Spectrophotometric determination of isoniazid in pure and pharmaceutical formulations using vanillin. Int J Pharma Pharm Sci 2 (suppl 1): 55-58.
- Siddappa K, Mahesh T, Mallikarjun M, Mallikarjun K (2011) Spectrophotometric methods for the determination of sulfamethaxazole by a Schiff’s Base reactions in pure and pharmaceutical dosage forms. J Pharma Res 4: 308-311.
- Ehmann A (1977) The van URK-Salkowski reagent - a sensitive and specific chromogenic reagent for silica gel thin-layer chromatographic detection and identification of indole derivatives. J Chromatogr A 132: 267–201.
- Bose A, Dash PP, Sahoo MK (2010) Simple spectrophotometric methods for estimation of aceclofenac from bulk and formulations. Pharm methods 1: 57-60.
- Khan PS, Raveendra Reddy P, Krishna Reddy V (2013) Visible spectrophotometric methods for the determination of zolmitriptan in bulk and pharmaceutical formulations using aromatic aldehydes and Folin’s reagent. Int J ChemTech Res 5: 2941-2946.
- International Committee on Harmonization. Validation of Analytical Procedures: Text and Methodology, Q2(R1), Nov. 2005.


