Objectives: The purpose of this study was to evaluate the rates of salivary clearance at two different locations (labial surface of an upper incisor (UAB) and buccal surface of an upper first molar (UPB)) in the mouth and to monitor the pH changes at these locations with ion-sensitive field-effect transistor (ISFET) pH electrodes.
Methods: Diffusion chambers which held 1 mol/l KCl in a 1.0% agarose matrix were initially placed in the above locations and were then removed at selected time intervals and the gels transferred quantitatively to flasks containing 400 ml of 100 ppm NaCl for K assay by atomic absorption spectrophotometry. The electrodes were fixed by adhesive resin on the two locations and then 2-point calibration was carried out by using cotton balls soaked in buffer. After the pH stabilized, a mouth rinse with 15 ml of an acid beverage solution (pH: 3.3) was used for 10 seconds, and pH changes were monitored at the two locations simultaneously. Subjects were 6 adults with sound dentition.
Results: The clearance halftimes (the time for the initial potassium concentration in the gels to decrease by half) were significantly lower (p<0.01) in the UPB than in the UAB, both when salivary flow was unstimulated and stimulated. After the calibration, the pH of the UPB for all subjects was lower than at the UAB for 10 minutes until rinsing by the beverage. After rinsing with orange juice, the pH dropped to around 3.3, and then gradually recovered. At the UPB the mean time of recovery to pH 5.4 was 4.4 ± 4.3 seconds, but at the UAB the pH for all subjects did not recover to pH 5.4 by 30 minutes.
Conclusions: The pH in the mouth differs in different locations. After swallowing an acidic beverage, the pH is influenced by the amount and buffer capacity of the saliva which reaches a particular location.
Lecomte and Dawes [1] and Watanabe [2] introduced agar containing potassium chloride into the mouth and measured the rate at which potassium diffused out into the saliva. Weatherell, et al. [3] rinsed the mouth with a fluoride solution and measured the quantity of fluoride remaining at various positions in the mouth. According to these reports, salivary clearance rates differ among positions in the mouth. The highest rates occur on the lingual surfaces of the mandibular anterior teeth and the lowest on the labial surfaces of the maxillary anterior teeth. Using these results, Dawes, et al. [4] estimated the velocity of the salivary film at various positions in the mouth and reported a tenfold difference between that at the lingual surface of the mandibular incisor teeth and that at the labial surface of the maxillary incisor teeth.
The pH of saliva is reported to differ depending on the quantity and origin of its component secretions. Oster, et al. [5] reported an average pH of 5.97 (range: 5.73 to 6.15) in saliva secreted from the submandibular gland at rest. Schmidt-Nielsen [6] and Suddick, et al. [7] reported higher pH values in saliva from the submandibular gland at rest than from the parotid gland at rest. The pH of saliva can exert a significant influence on environmental changes at various positions in the mouth but few studies using continuous measurements have been made of the pH in the mouth.
Millward, et al. [8] and Simpson, et al.[9]monitored the pH on palatal surfaces of the dentition following consumption of acidic beverages by using glass electrodes but these studies did not clarify the site-specificity of the pH variations.
The purpose of this study was to evaluate the rates of salivary clearance at two different locations (buccal surface of an upper first molar (UPB) and labial surface of an upper incisor (UAB) in the mouth and to monitor the pH changes at these locations with ion-sensitive field-effect transistor (ISFET) pH electrodes after an acidic beverage had been swallowed.
Six adults (four males and two females, mean age 29 years) with caries-free, healthy dentitions were selected. Subjects were instructed not to eat or drink, clean their mouths, smoke cigarettes, or engage in physical exercise for two h prior to the experiment. In consideration of the circadian rhythm in salivary secretion, the experiment was started at 15:00 each day.
Two different sites in the mouth were chosen for measurements.These were the upper posterior buccal (UPB) and upper anterior buccal (UAB).The flow rates of unstimulated and stimulated whole saliva were also measured on each occasion. The unstimulated flow rate was measured for 5 min by allowing saliva to drip off the lower lip into a weighed container [10]. The flow rate of saliva was also measured in a similar manner after 15 ml of 100% orange juice (pH, 3.4) was rinsed around the mouth for 20 s and then swallowed. For the experiment, informed consent was received from each subject in advance.
Determination of the rate of potassium chloride clearance
This was done by the method of Lecomte and Dawes [1]. A 1‐mol/l solution of potassium chloride was mixed with sufficient agarose (Electrophoresis Purity Reagent;BioRad Laboratories, Richmond, Calif.,USA) to give a 1.0% solution which was heated until the agarose dissolved. Aliquots were pipetted into the wells of diffusion chambers and allowed to set against a microscope slide,flush with the surface of the diffusion chamber.
The acrylic chambers were rectangular (13 mm in length,7 mm wide, and 2 mm thick) with a cylindrical central depression (3 mm diameter and 1.5 mm depth) to hold the gel.The design of the diffusion chambers was very similar to that of a previous study [1].To reduce interference with normal patterns of salivary flow in the mouth, the chambers were somewhat smaller than those used by Lecomte and Dawes [1].The weight of the agarose held in the center well of each chamber was measured six times using an electronic balance (FX‐3200;A &D, Tokyo, Japan), and chambers in which the mean weight of agarose was more than 2 SD from the mean (12.2 ± 0.7 mg) were excluded.
Two chambers,initially covered with a layer of Parafilm (American Can,Greenwich,Conn. USA), were attached bilaterally by floss to the teeth, with the gel surface away from the teeth.The chambers were attached to the first molars for the posterior sites (UPB) and to both incisors for the anterior site (UAB).After temperature and salivary flow equilibration, the Parafilm was removed at time 0.The first diffusion chamber was removed from the mouth after being exposed to saliva for a selected period of time and the gel transferred to flasks containing 400 ml of (100 ppm) sodium chloride [11].Subsequently the second chamber was removed and the potassium chloride extracted by the same procedure.The fluid was agitated intermittently for 1 h and the potassium concentration assayed by atomic absorption spectrophotometry(Shimadzu AA‐6105,Kyoto,Japan). The times were chosen so that between about 30 and 60% of the potassium chloride would have diffused from the agarose discs.The initial KCI concentration in agarose discs which had not been put into the mouth was also measured. A least-squares straight line was fitted by computer to the mean potassium concentration plotted against the square root of time, for calculation of the halftime [1].
Method of pH Measurement
ISFET electrodes with a tip 6 mm long, 1 mm wide, and 0.2 mm thick (Model 50-1314, BAS, Tokyo) were used. A plaster model of the dentition was created for each subject. On the model, small partial dentures were made at the UPB and UAB sites by light-cured composite resin (Shofu, LITE FILL, Tokyo). The resin was hardened on contact with the ISFET electrodes (Figure 1). The ISFET electrode was connected to a model 50-1400 ISFET mV/pH meter (BAS, Tokyo) and data were collected with Mac Lab/4s (AD Instrument, Tokyo) using software on a personal computer. For a reference electrode, a silver-silver chloride skin electrode was secured to the forehead with surgical tape. For electrode calibration, pH stability was tested after device attachment. Using pH standard solutions (pH 4.01 and 6.86) containing no preservatives (DKK Corporation, Tokyo), two-point adjustment was performed in the mouth.
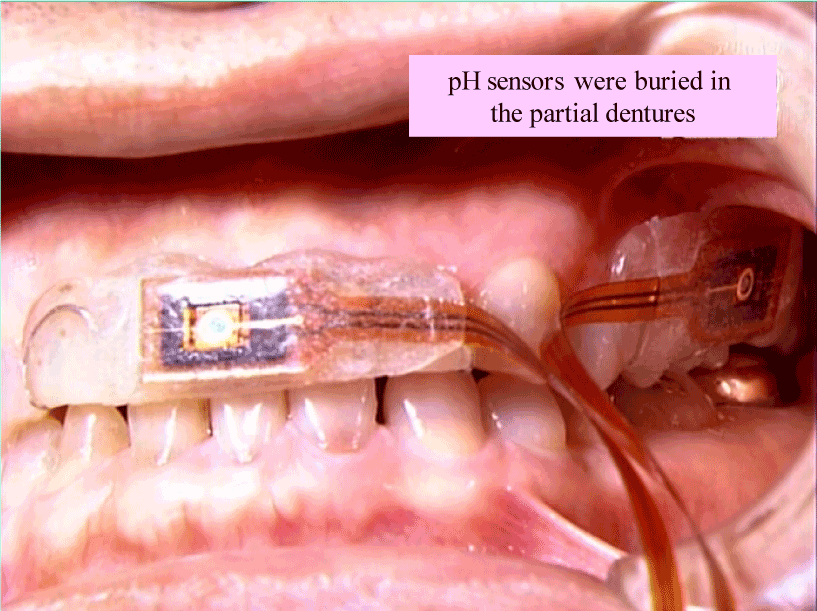
Figure 1. pH electrodes in the mouth.
At the start of the experiment, the pH at rest was measured simultaneously at the two positions in the mouth for 20 min. The subject then rinsed the oral cavity with 15 ml of orange juice (pH 3.4) for 20 s. After swallowing the orange juice, the pH was monitored for 30 min. To control for the effects of temperature on pH, the orange juice was adjusted to the temperature of the oral cavity of each subject. Measurement periods were limited to 20 min at rest and 30 min after stimulation out of consideration for subject fatigue. Reproducibility was again checked following calibration.
Statistical analyses
Each site,and with both salivary flow rates was studied on two occasions,and the mean halftimes were calculated.For determination of the effects of salivary flow and of site, analysis of variance was used and then a Duncan new multiple range test was applied to test for significant individual differences.
For the pH experiment, after statistical processing by Stat View (Abacus Concepts, USA), significant differences in pH between at rest and after stimulation at each position were analyzed using a multiple comparison test (Fisher's PLSD).
Table 1 shows the clearance halftimes (the time for the initial potassium concentration in the gels to decrease by half) at UPB and UAB sites. The halftime was significantly lower (p<0.01) in the UPB than in the UAB both when salivary flow was unstimulated and stimulated.
Table 1. Halftimes (mean ± SD) for potassium release at UPB and UAB sites when salivary flow was unstimulated or stimulated.
|
UPB |
UAB |
Unstimulated, Half time, min |
13.1 ± 6.7* |
23.8 ± 10.8* |
Flow rate, ml/min |
0.5 ± 0.3 |
0.4 ± 0.2 |
Stimulated, Half time, min |
6.8 ± 0.8** |
10.8 ± 3.8** |
Flow rate, ml/ min |
3.6 ± 1.6 |
3.2 ± 1.4 |
Statistical comparisons were carried out between UPB and UAB *, ** p<0.01
Figure 2 shows the results for the salivary flow rate and the pH changes after swallowing orange juice. The unstimulated salivary flow rates were 0.4 ± 0.1 ml/min before swallowing, and the highest value was 3.5 ± 2.2 ml /min just after the swallowing. The pH showed the lowest pH of 6.2 ± 2.5 for the measurement period immediately after the swallowing. The pH then rose at each subsequent measurement and exceeded the first pH during the 30-60 second period, when it was pH 7.9 ± 2.2. The pH decreased gradually afterwards, returning to the pH before the swallowing during the 300-600 second period.
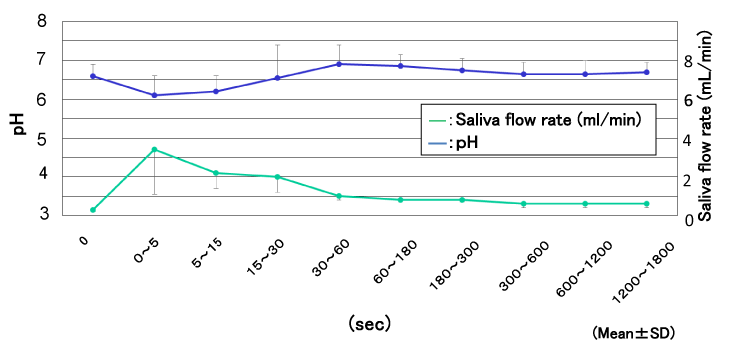
Figure 2. The salivary flow rate and the pH changes after swallowing orange juice.
Table 2 shows the mean pH just before swallowing orange juice and the mean recovery times to pH 6.5 after the swallowing. Before swallowing, the pH in the UPB was higher than that in the UAB (p<0.01). Just after swallowing, the pH dropped to around 3.3, and then gradually recovered. At the UPB the mean time of recovery to pH 6.5 was 4.4 ± 4.3 seconds, but at the UAB the pH for all subjects had not recovered to pH 6.5 by 30 minutes.
Table 2. The mean pH just before swallowing the orange juice and the mean times of recovery to pH 5.4 after swallowing.
|
UPB |
UAB |
pH |
6.8 ±0.4* |
7.1 ± 0.4* |
Time |
4.4 ± 4.3 sec. |
>30 min |
* P<0.01
Figure 3 shows typical data of the pH changes before and after the orange juice was swallowed.
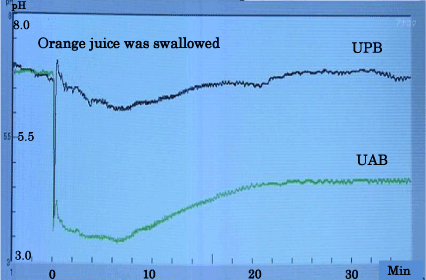
Figure 3. One of the typical data of the PH changes.
According to reports by Macpherson and Dawes[12] sucrose released intra-orally from food is generally not distributed uniformly throughout the mouth, and the rate of salivary clearance also varies according to position. In this experiment, similar values were found on the salivary flow at UAB and UPB sites and the pH decreases were almost equivalent in the two positions, as subjects rinsed their mouths so that the acidic orange juice would be uniformly distributed. However, the pH demonstrated very different rates of recovery at the two positions. The pH at UPB recovered to resting levels in just over a minute, presumably due to the influence of parotid saliva. At UAB, the pH did not return to the original levels even after 30 min. The reason for this late recovery may be because the UAB is not as accessible to saliva as the UPB and the minor mucous secretions in the UAB region are poorly buffered, as they contain no bicarbonate[13].
Millward, et al. [8] monitored the pH at the palatal surface of the upper left central incisor and upper right first permanent molar after drinking 1% (w/v) citric acid. A maximal decrease in pH to values of 2-3 was observed after 1 min followed by a slower recovery which was above pH 5.5 within 2 min at the former site and in 4-5 min at the latter site. As the sites chosen were different from those in our study, it is not possible to compare the results. In this experiment, subjects remained at rest without moving their lips or tongues after rinsing their mouths. In real scenarios, however, movement of the lips and tongue would assist pH recovery.
Orange juice seems to be a beverage drunk all over the world because it is cheap and it is high in vitamin C. It was confirmed that the potential influence of the acid on the oral mucosa and teeth was reduced by the pH adjustment mechanisms salivary flow. It was also clarified by this research that the rate of saliva secretion and the pH were different at different locations in the mouth. These results suggest that acid erosion of the teeth from acidic is likely to show site-specificity.
After an acidic drink, the pH in the mouth differs in different locations and it is influenced by the amount and buffer capacity of saliva which reaches a particular site.
- Lecomte P, Dawes C (1987) The influence of salivary flow rate on diffusion of potassium chloride from artificial plaque at different sites in the mouth. J Dent Res 66: 1614-1618. [Crossref]
- Watanabe S (1992) Salivary clearance from different regions of the mouth in children. Caries Res 26: 423-427. [Crossref]
- Weatherell JA, Strong M, Robinson C, Ralph JP (1986) Fluoride distribution in the mouth after fluoride rinsing. Caries Res 20: 111-119. [Crossref]
- Dawes C, Watanabe S, Biglow-Lecomte P, Dibdin GH (1989) Estimation of the velocity of the salivary film at some different locations in the mouth. J Dent Res 68: 1479-1482. [Crossref]
- Oster RH, Proutt LM, Shipley ER, Pollack BR, Bradley E (1953) Human salivary buffering rate measured in situ in response to an acid stimulus found in some common beverages. J app Physiol 6: 348-354. [Crossref]
- Schmidt-Nielsen B (1964) The pH in parotid and mandibular saliva. Acta physiol Scand 11: 104-110.
- Suddick RP, Hyde RJ, Feller RL (1980) Salivary water and electrolytes and oral health. In : The Biologic Basis of Dental Caries, Menaker L (ed) Harper and Row, New York.
- Millward A, Shaw L, Harrington E, Smith AJ (1997) Continuous monitoring of salivary flow rate and pH at the surface of the dentition following consumption of acidic beverages. Caries Res 31: 44-49. [Crossref]
- Simpson A, Shaw L and Smith AJ (2001) Tooth surface pH during drinking of black tea. Br Dent J 190: 374-376. [Crossref]
- Dawes C (1987) Physiological factors affecting salivary flow rate, oral sugar clearance, and the sensation of dry mouth in man. J Dent Res 66: 648-653. [Crossref]
- Dawes C (1969) The effects of flow rate and duration of stimulation on the concentration of protein and the main electrolytes in human parotid saliva. Arch Oral Biol 14: 277-294. [Crossref]
- Macpherson LMD, Dawes C (1991) Effects of salivary film velocity on pH changes in an artificial plaque containing Streptcoccus oralis, after exposure to sucrose. J Dent Res 70: 1230-1234. [Crossref]
- Dawes C, Wood CM (1973) The contribution of oral minor mucus gland secretions to the volume of whole saliva in man. Archs oral Biol 18: 343-346.