Abstract
Objective: Obstructive sleep apnea (OSA) is independently associated with atrial fibrillation (AF). We hypothesized that renal sympathetic denervation (RSD) could decrease the occurrence of AF and apnea/hypopnea index (AHI) in patients with controlled hypertension and OSA. We aimed to compare the impact of continuous positive airway pressure (CPAP) and CPAP+RSD in such patients.
Methods: This prospective, longitudinal study included 36 patients recruited between January 2013 and January 2015 at the Arrhythmias and Artificial Cardiac Pacing Service at Hospital e Clínica São Gonçalo. Subjects were divided into two groups: a control group (n=22) receiving CPAP and RSD group (n=14) receiving CPAP+RSD. All patients underwent 6-month follow-up. Primary and secondary endpoints were decreased in AHI (by polysomnography) and the 30-s occurrence of AF (24-hour Holter monitoring).
Results: From baseline to the 6-month follow-up, AHI decreased from 40.3 ± 10.9 to 12.5 ± 6.2 events/hour, and from 39.8 ± 12.1 to 3.6 ± 7.4 events/hour in the control (P<0.0001) and RSD groups (P<0.0001), respectively. After 6 months, AF occurrence was significantly higher in the control group (72.73%) than in the RSD group (21.43%) (odds ratio: 9.778, 95% confidence interval: 1.904-38.780, P=0.0054). Six-month post-RSD, left atrial volume (P=0.0001), and left ventricular mass indexed by body surface area (P=0.0064) significantly decreased. No patients presented RSD-related complications.
Conclusions: The results of this preliminary study indicate that in patients with controlled hypertension, OSA, and paroxysmal AF, RSD significantly and safely decreased AF occurrence, AHI, left atrial volume, and left ventricular mass indexed by body surface area.
Key words
atrial fibrillation, obstructive sleep apnea, renal sympathetic denervation, hypertension, sympathetic hyperactivity
Introduction
Obstructive sleep apnea (OSA) may lead to atrial fibrillation (AF), a common cardiac arrhythmia. In a previous report, AF occurred in 4.8% of patients in the breathing sleep disorder group (N=228), but only in 0.9% of those without such disorders (P=0.003) [1]. Further, AF can be a contributing factor for various diseases such as cerebral or systemic embolism [2]. Thus, AF conversion is crucial to reduce cardiovascular morbidity and mortality [3,4]. Particularly, OSA is a risk factor for stroke and hypertension [5,6]. Further, continuous positive airway pressure (CPAP) reduces death and cardiovascular events and improves hypertension control [7,8]. Furthermore, OSA has been shown to be independently associated with AF development9, with a prevalence rate as high as 50% [10]. Several underlying mechanisms are attributable for OSA-induced AF. The main mechanism is intermittent nighttime desaturation [1,11]. Nighttime hypoxemia secondary to OSA may cause atrial remodeling and dilatation, conduction abnormalities, vagal tone hyperfunction, pulmonary vasoconstriction/hypertension, or increase in inflammatory markers [11-16].
Accentuated sympathetic nerve activity is a robust risk factor for cardiovascular events, such as cerebral infarction and myocardial infarction [17]. Peripheral sympathetic nerve activity is accentuated in patients with hypertension, congestive heart failure, OSA, obesity, diabetes, and chronic renal illnesses. At least 50% of hypertensive subjects show potentiated sympathetic nerve activity [18,19].
We hypothesized that renal sympathetic denervation (RSD) can reduce the occurrence of AF and apnea/hypopnea index (AHI) in patients with controlled hypertension and OSA by modulation of their sympathetic hyperactivity. This prospective study aimed to compare the impact of CPAP vs. CPAP+RSD in controlled hypertensive patients with paroxysmal AF.
Methods
This prospective, longitudinal study involved 36 patients with controlled hypertension, normal renal function, or chronic kidney disease, and a history of symptomatic paroxysmal AF (PAF). The study was conducted in accordance with the Helsinki declaration and was approved by the ethics committee of our institution. All patients signed the informed consent before inclusion.
Study subjects
Patients were recruited between January 2013 and January 2015 at the Arrhythmias and Artificial Cardiac Pacing Service at Hospital e Clínica São Gonçalo, Rio de Janeiro, Brazil. Patients who met the following criteria were consecutively enrolled: (i) mean 24-hour systolic ambulatory blood pressure measurements (ABPM) of ≥100 and <130 mmHg, (ii) essential hypertension for >1 year, (ii) age between 18 and 70 years; (iii) structurally normal heart to cardiovascular magnetic resonance (CMR), without ischemia, fibrosis area, or any other disease; (iv) paroxysmal atrial fibrillation (PAF) registered on electrocardiogram (ECG) or 24-hour-Holter monitoring (PAF was defined as AF episodes lasting <7 days with spontaneous termination) at baseline; (v) treatment of PAF with antiarrhythmic drug (sotalol hydrochloride or propafenone) in maximal tolerated doses; (vi) severe obstructive sleep apnea syndrome, defined as AHI >30 events/hour; (vii) glomerular filtration rate estimated by the Chronic Kidney Disease Epidemiology Collaboration (CKD-EPI equation, [20]. eGFR > 60 mL/min/1.73 m2 without microalbuminuria); and (viii) capacity to read, comprehend, and sign the informed consent form and attend the clinical tests.
Patients that presented any of the subsequent criteria were excluded: (i) pregnancy; (ii) valvular disease with significant adverse sequelae; (iii) unstable angina, myocardial infarction, transient ischemic attack or stroke 6 months before the procedure; (iv) renovascular abnormalities; (v) psychiatric disease; (vi) allergy to ionic contrast medium; (vii) inability to be monitored clinically after the procedure; (viii) known addiction to drugs or alcohol that affects the intellect; (ix) serious health condition that, in the investigator opinion’s, may adversely affect the safety and/or efficacy of the participant or the study; (x) congestive heart failure of functional class II to IV according to the New York Heart Association; (xi) previous AF ablation procedure; or (xii) treatment with amiodarone. Subjects were divided into two groups. In the control group (n=22), patients received continuous positive airway pressure (CPAP). In the RSD group (n=14), patients received CPAP+RSD. All patients were followed up during 6 months to assess sinus rhythm, sleep disorders, and monitor variations in BP, heart rate, body mass index (BMI), renal function, and CMR parameters.
The primary endpoint was decrease in AHI recorded by polysomnography. The secondary endpoint of this study was the 30-s occurrence of AF recorded by the 24-hour Holter monitoring. The 24-hour Holter monitoring was evaluated at baseline and at 6 months after beginning treatment. The tertiary endpoints were evaluation of 24-hour ABPM, 24-hour-Holter monitoring heart rate, BMI, eGFR, albuminuria, and CMR parameters at baseline and 6 months after treatment initiation. Additionally, for subjects that underwent RSD, safety was evaluated by renal arterial duplex scan at baseline and at 6 months after RSD.
Cardiac magnetic resonance
The use of CMR is a strength of our study. The CMR was executed in all patients at baseline and 6 months after RSD using a 1.5-T Achieva magnetic resonance image (MRI) scanner (Philips Healthcare, Best, the Netherlands), 1.5-T Siemens Symphony, or a 1.5-T Siemens Aera MRI system (Siemens Healthcare Sector, Erlangen, Germany). Cine images were acquired using a balanced steady-state free precession sequence during breath-holds of ~10–15 s using VCG gating with patients being positioned in the supine position. Whole-heart coverage from apex to the base was performed as previously reported. [21]. Moreover, late gadolinium enhancement (LGE) was performed in all patients to evaluate the impact of RSD on scar tissue. The LGE imaging was performed 10–15 min after injection of 0.2 mmol/kg gadolinium DTPA using an inversion-recovery 3D spoiled gradient echo sequence. The pre-pulse delay was individually adjusted according to a pre-pulse-delay finder (Look-Locker sequence). All CMR examinations were performed by operators, who were blinded to patient treatment and timing of the measurement (before or after RSD).
Cardiac magnetic resonance analysis
Left ventricular mass (LVM) measurements and ejection fraction: The CMR analyses were performed according to the recommendations of the task force for post-processing of the Society for Cardiovascular MR [22]. Offline CMR analyses were performed using the software Qmass MR Enterprise Solution (version 7.4, Medis, the Netherlands). Endocardial and epicardial borders were traced automatically and corrected manually at end-diastole and end-systole, while the papillary muscles were excluded from the LVM to achieve better reproducibility. [23] Left ventricular volumes and mass were calculated using the summation of slices method [24]. Left ventricular end-systolic (LVESVI) and end-diastolic volume index (LVEDVI) were normalized in every patient for sex, age, height, and weight. Then, LVESVI and LVEDVI were assessed [25]. LVM was then normalized and indexed against body surface area (g/m2) [26]. The left ventricular ejection fraction (LVEF) was calculated by Simpson’s method.
Left atrium: A retrospectively ECG-gated cine-MRI stack was acquired in the short-axis orientation (covering the entire left atrium) with contiguous slices for the assessment of left atrial volume (Simpson’s method) [27]. Simpson’s technique is established according to Simpson’s rules, which for this study, were essentially the sum of the cross-sectional areas of each portion accounting for slice thickness and the interval between slices [28,29]. This was measured at short-axis views of the cine-MRI by means of steady-state free-precession sequences and anatomical landmarks, with exclusion of the pulmonary vein. The left atrial volume was considered normal up to 69 mL in men and 54 mL in women.
Scar tissue: To observe the myocardial fibrosis, LGE MRI was applied using the inversion-recovery gradient-echo series. The LGE images were scored visually by two experienced observers (blinded to other MRI and clinical data) at the time of the examination using a 17-segment model [30]. Each segment was graded using the following point score: 0, absence of enhancement; 1, enhancement of 1%-25% transmurality; 2, enhancement of 26%–50% transmurality; 3, enhancement of 51%-75% transmurality, and 4, enhancement of 76%–100% transmurality [31]. The score per segment at that time was calculated by dividing the total score by 17 based on a 17-segment model [30].
24-hour ABPM: The ABPM was performed during the 24 hours before the procedure with a clinically validated device (CardioMapa; Cardios, São Paulo, Brazil). The device was set to measure BP every 15 minutes from 6:00 to 22:00 hours and every 30 minutes from 22:00 to 6:00 hours. Patients were instructed to continue their regular activities during the recording and go to bed no later than at 23:00 hours. The waking period ranged from 8 to 22 hours and the sleep period from midnight to 6 hours [32]. All individuals were trained to record in a diary the hours during which they were asleep and awake, meals, intake of medications, and symptoms and events that could influence BP during this period. Measurements were transferred to a computer for analysis. Monitoring was repeated as necessary until ≥70% of the daytime and nighttime measured values were satisfactory [33].
Polysomnography: The Epworth Sleepiness Scale was evaluated before the sleep study [34]. The diagnosis of OSA was completed by standard attended polysomnography with an Alice 5 device (Respironics Inc, Murrysville, PA). The electroencephalogram and electromyogram of chin muscles, as well as ECG, were simultaneously recorded. Data on oral-nasal airflow (with thermal and pressure sensing device), thoraco-abdominal respiratory movements, body position, snoring, and oximetry were also acquired. The polysomnographic records were scored manually using 30-second epochs following the criteria of Rechtschaffen and Kales, [35]. for sleep and waking period determinations and sleep staging. Abnormal respiratory events were evaluated according to the standard criteria of the American Academy of Sleep Medicine Task Force [36]. Apnea was defined as a cessation of airflow for ≥10 seconds and hypopnea as >50% decrease in airflow from baseline in the amplitude of a valid measure of breathing during sleep period during ≥10 seconds, associated with either an oxygen desaturation >3% or stimulation. The AHI, reflecting the number of apneic and hypopneic events/hour of sleep and oxygen desaturation index, was calculated. Other parameters acquired were minimal and average nocturnal oxygen saturation and sleep time percentage spent with oxygen saturation of hemoglobin <90%. Idividuals receiving continuous positive airway pressure (CPAP) treatment had polysomnography performed without CPAP. The initial and follow-up polysomnograms were scored and interpreted by an experienced investigator blinded to the patient clinical status.
24-hour Holter monitoring: Patients underwent a 24-h Holter monitoring (Galix Biomedical Instrumentation, Florida, USA). A three-channel recorder was used to record the electrocardiographic traces; calculate the minimum, mean and maximum HR; the rhythm at baseline and quarterly after the performance of procedures during the follow-up period.
Renal sympathetic denervation and safety evaluation of RSD: The RSD procedure has been previously described in detail [37]. Patients remained hospitalized in the ward during 24 h after the procedure. No patient developed procedural complications related to RSD. Real-time renal artery imaging was performed to evaluate eventual structural changes regarding the RSD. Six months after the procedure, all patients in the RSD group underwent a renal artery Doppler scan, which showed no evidence of stenosis or flow limitation.
Statistical analysis
The results are expressed as mean and standard deviation for normally distributed data and as median with interquartile range otherwise. All statistical tests were two-sided. Comparisons between two-paired values were performed with the paired t-test in cases of normally distributed variables, and by the Wilcoxon test in cases of non-normally distributed variables. Comparisons between more than two-paired values were made by repeated-measures analysis of variance or by Kruskal–Wallis analysis of variance as appropriate, complemented by a post-hoc test. Categorical variables were compared with Fisher’s exact test. A P-value <0.05 was considered significant. Correlations between two variables were performed by Pearson’s chi-square test in case of a Gaussian distribution and with the Spearman correlation test otherwise. All statistical analyses were performed using the program Graphpad Prism v 7.0 (Graphpad Software, La Jolla, CA, USA).
Results
Baseline characteristics of patients
The general features of the 36 patients divided into two groups are listed in Table 1. There were no significant differences in age, BMI, sex, ethnicity, or other parameters.
Table 1. General features of patients at baseline |
|
Control group |
RSD group |
P value |
N |
22 |
14 |
--- |
Age, years |
48.5 ± 10.8 |
50.3 ± 9.2 |
0.6097 |
Body mass index, kg/m2 |
27.6 ± 2.8 |
26.5 ± 2.5 |
0.6071 |
Male sex (%) |
16 (73%) |
10 (71%) |
>0.9999 |
White ethnicity (%) |
12 (55%) |
8 (57%) |
>0.9999 |
Type 2 Diabetes Mellitus (%) |
8 (36%) |
3 (21%) |
0.4672 |
Average HR 24-hour-Holter, bpm |
70.3 ± 10.9 |
74.2 ± 14.9 |
0.8532 |
eGFR, mL/min/1.73m² (CKD-EPI) |
100.4 ± 15.6 |
96.5 ± 18.0 |
0.9129 |
LVEF (Simpson), % |
68.0 ± 8.4 |
66.7 ± 7.7 |
0.9617 |
Mean 24-hour ABPM, mmHg |
126.8 ± 8.1/76.4 ± 3.5 |
127.3 ± 7.5/75.5 ± 4.0 |
0.9981/0.9143 |
Paroxysmal atrial fibrillation (%) |
22 (100%) |
14 (100%) |
1.000 |
Apnea/hypopnea index, events/hour |
40.3 ± 10.9 |
39.8 ± 12.1 |
0.9986 |
Antiarrhythmic agents |
|
|
|
Sotalol hydrochloride |
8 (36%) |
4 (29%) |
0.7272 |
Propafenone |
14 (64%) |
10 (71%) |
0.7272 |
Antihypertensive Agents |
|
|
|
ACE inhibitors/ARB |
22 (100%) |
14 (100%) |
1.000 |
Diuretics |
12 (55%) |
8 (57%) |
>0.9999 |
DHP Ca++ channel blockers |
9 (41%) |
5 (36%) |
>0.9999 |
Values are presented as Mean ± SD or %; ABPM, ambulatory blood pressure measurements; ACE, angiotensin-converting enzyme; ARB, angiotensin receptor blocker; CKD-EPI, Chronic Kidney Disease Epidemiology Collaboration; DHP, dihydropyridine; eGFR, estimated glomerular filtration rate; HR, heart rate; LVEF, left ventricular ejection fraction; N, number of patients; RSD, renal sympathetic denervation; SD, standard deviation
. |
BP and heart rate
No significant change was observed in the mean 24-h ABPM and average heart rate 24-hour Holter monitoring from baseline to 6 months within the same group. There were no significant differences between the two groups at the same time points (Table 2).
Table 2. Blood pressure and heart rate parameters at baseline and 6-month follow-up |
|
Parameters |
Control group
(n=22) |
RSD group
(n=14) |
Baseline |
6th month |
P value |
Baseline |
6th month |
P value |
24-hour ABPM, mmHg |
|
|
|
|
|
|
Mean systolic |
126.8 ± 8.1 |
125.7 ± 9.0 |
0.9725 |
127.3 ± 7.5 |
124.8 ± 8.8 |
0.8606 |
Mean diastolic |
76.4 ± 3.5 |
75.1 ± 3.8 |
0.7096 |
75.5 ± 4.0 |
74.3 ± 5.1 |
0.8601 |
24-hour-Holter HR, bpm |
|
|
|
|
|
|
Minimum |
51.2 ± 13.3 |
50.0 ± 9.2 |
0.9823 |
54.2 ± 10.1 |
51.5 ± 8.6 |
0.9088 |
Average |
70.3 ± 10.9 |
68.5 ± 15.5 |
0.9749 |
74.2 ± 14.9 |
70.8 ± 16.0 |
0.9212 |
Maximum |
98.0 ± 16.4 |
95.7 ± 19.0 |
0.9739 |
101.2 ± 17.9 |
96.8 ± 18.5 |
0.9154 |
Values are presented as Mean ± SD; ABPM, ambulatory blood pressure measurements; HR, heart rate; RSD, renal sympathetic denervation; SD, standard deviation. There was no significant difference between parameters of both groups at baseline or at the 6-month follow-up. |
| |
BMI and renal function
The effects of RSD on the BMI, creatinine concentration, eGFR, and albumin:creatinine ratio during the first 6-month follow-up are shown in Table 3. No significant change was observed from baseline to 6 months within the same group. There was no significant difference between parameters in both groups neither at baseline nor at the 6-month follow-up.
Table 3. Body mass index and renal function parameters at baseline and 6-month follow-up |
Parameters |
Control group
(n=22) |
RSD group
(n=14) |
Baseline |
6th month |
P value |
Baseline |
6th month |
P value |
Body mass index, kg/m2 |
27.6 ± 2.8 |
28.0 ± 2.4 |
0.9566 |
26.5 ± 2.5 |
26.8 ± 2.7 |
0.9901 |
Creatinine, mg/dL |
0.90 ± 0.22 |
0.94 ± 0.23 |
0.9241 |
0.92 ± 0.21 |
0.93 ± 0.17 |
0.9993 |
eGFR, mL/min/1.73m2 |
100.4 ± 15.6 |
94.8 ± 19.1 |
0.7094 |
96.5 ± 18.0 |
95.2 ± 16.5 |
0.9972 |
ACR, mg/g |
15.0 ± 6.8 |
17.8 ± 5.1 |
0.5033 |
17.2 ± 8.5 |
13.2 ± 6.4 |
0.3876 |
Values are presented as Mean ± SD; ACR, albumin:creatinine ratio; eGFR, estimated glomerular filtration rate; RSD, renal sympathetic denervation; SD, standard deviation. There was no significant difference between parameters of both groups at baseline or at the 6-month follow-up. |
| |
Cardiac magnetic resonance variables
There was no significant difference between CMR parameters of both groups at baseline. Significant changes between baseline and 6 months post-RSD were evident for left atrial volume (P=0.0001) and LV mass indexed by body surface area (P=0.0064). There was a significant difference for the same parameters between the groups at the 6-month follow-up (P=0.0003 and P=0.0446, respectively) (Table 4).
Table 4. Cardiac magnetic resonance imaging parameters at baseline and 6-month follow-up |
|
Parameters |
Control group
(n=22) |
RSD group
(n=14) |
Baseline |
6th month |
P value |
Baseline |
6th month |
P value |
Left atrial volume, mL |
98.5 ± 10.1 |
96.8 ± 9.4** |
0.9216 |
99.2 ± 8.3 |
83.6 ± 6.4 |
0.0001 |
LVEDVI, mL/m2 |
84.3 ± 4.2 |
83.9 ± 4.1 |
0.9903 |
85.8 ± 5.0 |
84.0 ± 4.5 |
0.7002 |
LVESVI, mL/m2 |
31.0 ± 2.3 |
30.3 ± 3.1 |
0.8284 |
30.2 ± 2.8 |
29.8 ± 2.6 |
0.9798 |
LV mass/BSA, g/m2 |
82.0 ± 8.5 |
80.2 ± 10.1* |
0.9061 |
83.4 ± 9.0 |
72.1 ± 6.8 |
0.0064 |
LVEF, % (Simpson) |
68.0 ± 8.4 |
67.3 ± 7.1 |
0.9908 |
66.7 ± 7.7 |
66.1 ± 8.0 |
0.9970 |
Myocardial scar score, % |
0 |
0 |
─ |
0 |
0 |
─ |
Values are presented as Mean ± SD; BSA, body surface area; LVEDVI, left ventricular end-diastolic volume index; LVESVI, left ventricular end-systolic volume index; LV, left ventricle; EF, ejection fraction; RSD, renal sympathetic denervation; SD, standard deviation. There was no significant difference between parameters of both groups at baseline. **P=0.0003 and *P=0.0446 for comparisons of parameters between groups at the 6-month follow-up. |
| |
Atrial fibrillation monitoring
At the 6-month follow-up, AF occurrence was higher in the control group (72.73%) than in the RSD group (21.43%) (odds ratio [OR] 9.778, 95% confidence interval [CI] 1.904–38.780, P=0.0054) by Fisher’s exact test (Figure 1).
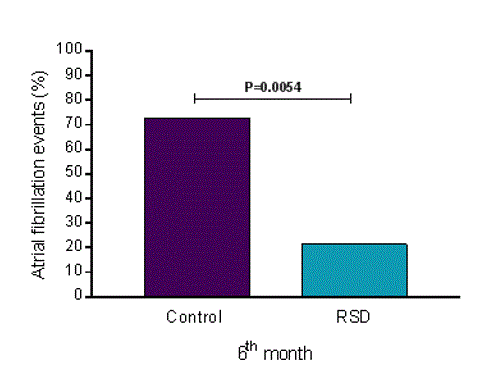
Figure 1. Percentage of paroxysmal atrial fibrillation occurrence at the 6-month follow-up. RSD, renal sympathetic denervation; control group (n=22) and RSD group (n=14).
Monitoring of AHI
Comparing the effects of CPAP alone and CPAP+RSD between baseline and at the 6-month follow-up, the AHI decreased from 40.3±10.9 to 12.5±6.2 events/hour in the control group (P<0.0001), and from 39.8±12.1 to 3.6±7.4 events/hour in the RSD group (P<0.0001). At the 6-month follow-up, AHI was higher in the control group than in RSD group (P=0.0037) (Figure 2).
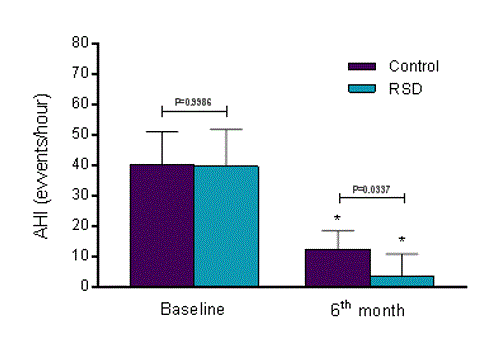
Figure 2. Apnea/hypopnea index (AHI) at baseline and 6-month follow-up. RSD, renal sympathetic denervation; SD, standard deviation; control group (n=22) and RSD group (n=14). Values are presented as Mean±SD. *P<0.0001 vs. respective baseline values.
Discussion
Our results showed that, in patients with controlled hypertension, OSA, and paroxysmal AF, RSD significantly decreased AF occurrence, AHI, left atrial volume, and LV mass indexed by body surface area. Recently, [38]. Kario and colleagues reported in a post hoc analysis that the subset of OSA-resistant hypertensive patients treated with RSD in the SYMPLICITY HTN-3 Trial showed a greater decrease in office systolic blood pressure (SBP) compared with the sham control group at 6 months’ posttreatment. Furthermore, the change in maximum nighttime SBP was greater among OSA subjects treated with RSD than among control subjects, as was the average peak nighttime SBP (−5.6±20.4 vs. 3.2±22.4 mmHg, P=0.02). This difference in nocturnal BP between RSD and sham control subjects was also observed in OSA subjects using CPAP/BiPAP. Linz and colleagues showed in a preclinical model that the increased sympathetic response associated with tracheal obstruction was attenuated with RSD but not with β-blockade [39]. During sleep, OSA patients experience repetitive apneic events that result in hypoxia and hypercapnia, which act via chemoreflexes to elicit high levels of sympathetic nerve traffic [40]. Decreased sympathetic activity in OSA patients as has been achieved by CPAP (decreasing both muscle sympathetic nerve activity and norepinephrine clearance), [41,42]. leads to a decrease in BP, [43] and OSA severity [44]. By decreasing the efferent renal sympathetic drive, RSD might reduce chronic fluid overload and possibly, a peripharyngeal fluid accumulation that may predispose to upper airway obstruction [45]. Previously, Witkowski and colleagues evaluated the 6-month effect of sleep apnea severity in 10 patients with resistant hypertension and OSA treated with RSD. They reported decreases in office SBP, AHI, oxygen desaturation index, Epworth Sleepiness Scale score, and plasma glucose concentration [45]. This decrease in the AHI was also observed in a meta-analysis that included 49 OSA patients treated by RSD [46].
Montesi and colleagues carried out a systematic review and meta-analysis in 2012, [47] which included 32 studies and a total of 2303 patients. The use of CPAP therapy was associated with a significant decrease in SBP, diastolic BP, and mean BP values. Decreases in BP were mainly observed in patients with higher daytime sleepiness, more severe OSA, and more compliance with CPAP therapy. Intermittent ischemic episodes increase BP by the activation of type I angiotensin II receptor. It seems that overactivation of the renin-angiotensin axis occurs independently of other factors [48]. Ablation of afferent renal nervous input decreases central sympathetic output, [49] which might attenuate autonomic triggers of AF and offer the potential for an antiarrhythmic effect superior to medications. As the patients in our study were individuals with controlled hypertension, we believe that we achieved, at least in part, a decrease in the sympathetic output and feedback loop of the renin-angiotensin-aldosterone system. However, in OSA patients with substantial pathology in the atrial substrate, additional intervention might be required to maximize the antiarrhythmic response, also taking into account that the left atrial volume was significantly higher in this population. An enlarged atrial size modulates the electro-anatomic substrate with the presence of increased non-uniform anisotropy and a conduction disturbance, which could promote AF [50]. Fibrosis in the LA plays an important role in determining the dynamics of AF, which could present as an anchor for reentrant circuits and alter wavefront propagation, causing fractionated electrograms, wavebreaks, and conduction delays [51]. We believe that atrial remodeling caused by OSA may contribute to the higher incidence of AF recurrence in OSA patients than in those without OSA. The CPAP+RSD in OSA patients showed an improvement in AF occurrence, left atrial volume and LV mass index at the 6-month follow-up, showing to be superior to CPAP alone. Our results regarding left atrial volume and LV mass index are in concordance with the results reported by Mahfoud and colleagues about the evaluation of cardiovascular magnetic resonance imaging after RSD [52]. The treatment of choice for the management of OSA patients is CPAP. The important implications of morbidity in OSA syndrome make it necessary to seek new therapies that account for the physiological mechanisms related to cardiovascular events in these patients. In this study, CPAP combined with RSD demonstrated superiority compared with CPAP alone for the improvement of AHI, AF occurrence, and atrial remodeling.
Study limitations
This is a nonrandomized, open-label study, on a selected patient population over a limited observational period. Although our data show an independent contribution of RSD in the decrease of AF occurrence in patients with controlled hypertension and OSA, our patient cohort was small. This relatively small sample can be seen as a limitation. To our knowledge, however, the present series is the first to address percutaneous renal artery denervation in patients with concurrently controlled hypertension, OSA, and paroxysmal AF. The use of Doppler echocardiography to assess damage in the renal arteries can also be seen as a limitation. However, early complications secondary to RF application were excluded angiographically at the end of the procedure. Any other method, such as magnetic resonance angiography, computed tomographic angiography or a new angiography of the renal arteries, could be performed.
Conclusions
Our data showed that, in patients with controlled hypertension, OSA, and paroxysmal AF, RSD significantly decreased the AF occurrence, AHI, left atrial volume, and LV mass indexed by body surface area. Even though encouraging, our data are preliminary and need long-term validation in a large population.
Conflict of interest
None declared.
Funding
This study was funded by Pacemed (US $400,000), Rio de Janeiro, Brazil.
Acknowledgements
The authors are grateful to all study participants. The authors also thank Pacemed for contributing to the development of this study and for providing technical support.
References
- Mehra R, Benjamin EJ, Shahar E, Gottlieb DJ, Nawabit R, et al. (2006) Association of nocturnal arrhythmias with sleep-disordered breathing: The Sleep Heart Health Study. Am J Respir Crit Care Med 173: 910-916. [Crossref]
- Kannel WB, Wolf PA, Benjamin EJ, et al. (1998) Prevalence, incidence, prognosis, and predisposing conditions for atrial fibrillation: population-based estimates. Am J Cardiol 82:2N-9N. [Crossref]
- Yan H, Aung TT, Guoqiang Z, Zhengnan Z, Lan J, et al. (2013) Meta-analysis of effect of vernakalant on conversion of atrial fibrillation. BMC Res Notes 6: 94. [Crossref]
- Hess PL, Jackson KP, Hasselblad V, Al-Khatib SM. (2013) Is cardiac resynchronization therapy an antiarrhythmic therapy for atrial fibrillation? A systematic review and meta-analysis. Curr Cardiol Rep 15:330. [Crossref]
- Chobanian AV, Bakris GL, Black HR, Cushman WC, Green LA et al. (2003) The seventh report of the joint national committee on prevention, detection, evaluation, and treatment of high blood pressure: the JNC7 report. JAMA 289:2560-72. [Crossref]
- Dong JY, Zhang YH, Qin LQ (2013) Obstructive sleep apnea and cardiovascular risk: meta-analysis of prospective cohort studies. Atherosclerosis 229: 489-495. [Crossref]
- Drager LF, Bortolotto LA, Figueiredo AC, Krieger EM, Lorenzi GF (2007) Effects of continuous positive airway pressure on early signs of atherosclerosis in obstructive sleep apnea. Am J Respir Crit Care Med 176: 706-712. [Crossref]
- Litvin AY, Sukmarov2021 Copyright OAT. All rights reservsin PV, et al. (2013) Effects of CPAP on "vascular" risk factors in patients with obstructive sleep apnea and arterial hypertension. Vasc Health Risk Manag 9: 229-235. [Crossref]
- Asirvatham SJ, Kapa S (2009) Sleep apnea and atrial fibrillation: the autonomic link. J Am Coll Cardiol 54: 2084-2086. [Crossref]
- Menezes AR, Lavie CJ, DiNicolantonio JJ, O'Keefe J, Morin DP, et al. (2013) Atrial fibrillation in the 21st century: a current understanding of risk factors and primary prevention strategies. Mayo Clin Proc 88: 394-409. [Crossref]
- Gami AS, Pressman G, Caples SM, Kanagala R, Gard JJ, et al. (2004) Association of atrial fibrillation and obstructive sleep apnea. Circulation 110: 364-367. [Crossref]
- Rajagopalan N (2011) Obstructive sleep apnea: not just a sleep disorder. J Postgrad Med 57: 168-175. [Crossref]
- Dimitri H, Ng M, Brooks AG, Kuklik P, Stiles MK, et al. (2012) Atrial remodeling in obstructive sleep apnea: implications for atrial fibrillation. Heart Rhythm 9: 321-327. [Crossref]
- Linz D, Schotten U, Neuberger HR, Böhm M, Wirth K. (2011) Negative tracheal pressure during obstructive respiratory events promotes atrial fibrillation by vagal activation. Heart Rhythm 8:1436-43. [Crossref]
- Shamsuzzaman AS, Winnicki M, Lanfranchi P, Wolk R, Kara T, et al. (2002) Elevated C-reactive protein in patients with obstructive sleep apnea. Circulation 105: 2462-2464. [Crossref]
- Hartmann G, Tschop M, Fischer R, Bidlingmaier C, Riepl R et al. (2000) High altitude increases circulating interleukin-6, interleukin-1 receptor antagonist, and C-reactive protein. Cytokine 12: 246-52. [Crossref]
- Julius S, Jamerson K (1994) Sympathetics, insulin resistance and coronary risk in hypertension: the 'chicken-and-egg' question. J Hypertens 12: 495-502. [Crossref]
- Esler M, Lambert G, Brunner-La Rocca HP, Vaddadi G, Kaye D. (2003) Sympathetic nerve activity and neurotransmitter release in humans: translation from pathophysiology into clinical practice. Acta Physiol Scand 177: 275–284. [Crossref]
- Esler M. (1985) The 2009 Carl Ludwig Lecture: pathophysiology of the human sympathetic nervous system in cardiovascular diseases: the transition from mechanisms to medical management. J Appl Physiol 108: 227-237. [Crossref]
- Levey AS, Stevens LA, Schmid CH, Zhang YL, Castro AF III, et al. (2009) A new equation to estimate glomerular filtration rate. Ann Intern Med 150: 604–612. [Crossref]
- Kelle S, Roes SD, Klein C, Kokocinski T, de Roos A et al. (2009) Prognostic value of myocardial infarct size and contractile reserve using magnetic resonance imaging. J Am Coll Cardiol 54:1770–7. [Crossref]
- Schulz-Menger J, Bluemke DA, Bremerich J, Flamm SD, Fogel MA et al. (2013) Standardized image interpretation and post processing in cardiovascular magnetic resonance: Society for Cardiovascular Magnetic Resonance (SCMR) board of trustees’ task force on standardized post processing. J Cardiovasc Magn Reson 15:35. [Crossref]
- Vogel-Claussen J, Finn JP, Gomes AS, Hundley GW, Jerosch-Herold M, et al. (2006) Left ventricular papillary muscle mass: relationship to left ventricular mass and volumes by magnetic resonance imaging. J Comput Assist Tomogr 30: 426-432. [Crossref]
- Papavassiliu T, Kuhl HP, van Dockum W, Hofman MB, Bondarenko O, et al. (2004) Accuracy of one- and two dimensional algorithms with optimal image plane position for the estimation of left ventricular mass: a comparative study using magnetic resonance imaging. J Cardiovasc Magn Reson. 6: 845–54. [Crossref]
- Maceira AM, Prasad SK, Khan M, Pennell DJ. (2006) Normalized left ventricular systolic and diastolic function by steady state free precession cardiovascular magnetic resonance. J Cardiovasc Magn Reson. 8: 417–26. [Crossref]
- Armstrong AC, Gidding S, Gjesdal O, Wu C, Bluemke DA, et al. (2012) LV mass assessed by echocardiography and CMR, cardiovascular outcomes, and medical practice. JACC Cardiovasc Imaging 5: 837-848. [Crossref]
- Nacif MS, Barranhas AD, Türkbey E, Marchiori E, Kawel N, et al. (2013) Left atrial volume quantification using cardiac MRI in atrial fibrillation: comparison of the Simpson's method with biplane area-length, ellipse, and three-dimensional methods. Diagn Interv Radiol 19: 213-20. [Crossref]
- Hudsmith LE, Petersen SE, Francis JM, Robson MD, Neubauer S. (2005) Normal human left and right ventricular and left atrial dimensions using steady state free precession magnetic resonance imaging. J Cardiovasc Magn Reson 7:775–782. [Crossref]
- Artang R, Migrino RQ, Harmann L, Bowers M, Woods TD. (2009) Left atrial volume measurement with automated border detection by 3-dimensional echocardiography: comparison with magnetic resonance imaging. Cardiovasc Ultrasound 7:16. [Crossref]
- Cerqueira MD, Weissman NJ, Dilsizian V, Jacobs AK, Kaul S, et al. (2002) Standardized myocardial segmentation and nomenclature for tomographic imaging of the heart. A statement for healthcare professionals from the Cardiac Imaging Committee of the Council on Clinical Cardiology of the American Heart Association. Circulation 105: 539-542. [Crossref]
- Wu E, Judd RM, Vargas JD, Klocke FJ, Bonow RO, et al. (2001) Visualisation of presence, location, and transmural extent of healed Q-wave and non-Q-wave myocardial infarction. Lancet 357: 21-28. [Crossref]
- Mancia G, De Backer G, Dominiczak A, Cifkova R, Fagard R, et al. (2007) Management of Arterial Hypertension of the European Society of Hypertension; European Society of Cardiology. Management of Arterial Hypertension of the European Society of Hypertension European Society of Cardiology: 2007 Guidelines for the Management of Arterial Hypertension: The Task Force for the Management of Arterial Hypertension of the European Society of Hypertension (ESH) and of the European Society of Cardiology (ESC). J Hypertens 25: 1105–1187.
- Stergiou GS, Kollias A, Destounis A, Tzamouranis D (2012) Automated blood pressure measurement in atrial fibrillation: a systematic review and meta-analysis. J Hypertens 30: 2074-2082. [Crossref]
- Johns MW. (1991) A new method for measuring daytime sleepiness: The Epworth sleepiness scale. Sleep 14: 540 –545. [Crossref]
- Rechtschaffen A, Kales A. A Manual of Standardized Terminology, Technique and Scoring System from Sleep Stages of Human Subjects. Washington, DC: US Department of Health, Education, and Welfare Public Health Service–NIH/NIND; 1968.
- [No authors listed]. (1999) Sleep-related breathing disorders in adults: recommendations for syndrome definition and measurement techniques in clinical research–the report of an American Academy of Sleep Medicine Task Force. Sleep 22: 667– 689. [Crossref]
- Kiuchi MG, E Silva GR, Paz LM, Chen S, Souto GL. Proof of concept study: renal sympathetic denervation for treatment of polymorphic premature ventricular complexes. J Interv Card Electrophysiol 2016 May 30. [Epub ahead of print]. [Crossref]
- Kario K, Bhatt DL, Kandzari DE, Brar S, Flack JM, et al. (2016) Impact of Renal Denervation on Patients with Obstructive Sleep Apnea and Resistant Hypertension - Insights from the SYMPLICITY HTN-3 Trial. Circ J 80: 1404-12. [Crossref]
- Linz D, Mahfoud F, Schotten U, Ukena C, Neuberger HR, et al. (2012) Renal sympathetic denervation suppresses postapneic blood pressure rises and atrial fibrillation in a model for sleep apnea. Hypertension 60: 172-178. [Crossref]
- Narkiewicz K, Somers VK (1997) The sympathetic nervous system and obstructive sleep apnea: implications for hypertension. J Hypertens 15: 1613-1619. [Crossref]
- Usui K, Bradley TD, Spaak J, Ryan CM, Kubo T, et al. (2005) Inhibition of awake sympathetic nerve activity of heart failure patients with obstructive sleep apnea by nocturnal continuous positive airway pressure. J Am Coll Cardiol 45: 2008-11. [Crossref]
- Mills PJ, Kennedy BP, Loredo JS, Dimsdale JE, Ziegler MG. (2006) Effects of nasal continuous positive airway pressure and oxygen supplementation on norepinephrine kinetics and cardiovascular responses in obstructive sleep apnea. J Appl Physiol (1985) 100: 343-348. [Crossref]
- Hukins CA (2006) Obstructive sleep apnea - management update. Neuropsychiatr Dis Treat 2: 309-326. [Crossref]
- Stepnowsky CJ, Dimsdale JE (2002) Dose-response relationship between CPAP compliance and measures of sleep apnea severity. Sleep Med 3: 329-334. [Crossref]
- Ding N, Lin W, Zhang XL, Ding WX, Gu B, et al. (2014) Overnight fluid shifts in subjects with and without obstructive sleep apnea. J Thorac Dis 6: 1736-1741. [Crossref]
- Witkowski A, Prejbisz A, Florczak E, Kadziela J, Sliwinski P, et al. (2011) Effects of renal sympathetic denervation on blood pressure, sleep apnea course, and glycemic control in patients with resistant hypertension and sleep apnea. Hypertension 58: 559-565. [Crossref]
- Montesi SB, Edwards BA, Malhotra A, Bakker JP. (2012) Effect of continuous positive airway pressure treatment on blood pressure: a systematic review and meta-analysis of randomized controlled trials. J Clin Sleep Med 8: 587-596. [Crossref]
- Foster GE, Hanly PJ, Ahmed SB, Beaudin AE, Pialoux V, et al. (2010) Intermittent hypoxia increases arterial blood pressure in humans through a renin-angiotensin system-dependent mechanism. Hypertension 56: 369-377. [Crossref]
- Schlaich MP, Socratous F, Hennebry S, Eikelis N, Lambert EA, et al. (2009) Sympathetic activation in chronic renal failure. J Am Soc Nephrol 20: 933-939. [Crossref]
- Sanders P, Morton JB, Davidson NC, Spence SJ Vohra JK et al. (2003) Electrical remodeling of the atria in congestive heart failure: electrophysiological and electroanatomic mapping in humans. Circulation 108: 1461-1468. [Crossref]
- Tanaka K, Zlochiver S, Vikstrom KL, Yamazaki M, Moreno J, et al. (2007) Spatial distribution of fibrosis governs fibrillation wave dynamics in the posterior left atrium during heart failure. Circ Res 101: 839-847. [Crossref]
- Mahfoud F, Urban D, Teller D, Linz D, Stawowy P, et al. (2014) Effect of renal denervation on left ventricular mass and function in patients with resistant hypertension: data from a multi-centre cardiovascular magnetic resonance imaging trial. Eur Heart J 35: 2224-2231b. [Crossref]