The molecular mechanisms involved in human uterine quiescence during gestation and the induction of labor at term or preterm are not completely known. Preterm delivery is associated with major morbidity and mortality and current efforts to prevent delivery until term are largely ineffective. Identification and semi-quantification of proteomic changes in uterine smooth muscle during pregnancy will allow for targeted research into how quiescence is maintained and what changes are associated with induction of labor. Examining preterm labor in this context will provide potential therapeutic targets for the management of preterm labor. We have recently performed two dimensional liquid chromatography coupled with tandem mass spectrometry on myometrial proteins isolated from pregnant patients in labor, pregnant patients not in labor, and pregnant patients in labor preterm. Using a conservative false discovery rate of 1% we have identified 2132 protein groups using this method and semi-quantitative spectral counting shows 201 proteins that have disparate levels of expression in preterm laboring samples. To our knowledge this is the first large scale proteomic study examining human uterine smooth muscle and this initial work has provided a target list for future experiments that can address how changing protein levels are involved in the induction of labor at term and preterm.
human pregnancy, labor, preterm labor, myometrium, smooth muscle, uterus, 2d-lc/ms/ms, proteomics
Neither human labor nor spontaneous preterm labor is well understood and there is ample evidence that the regulation of contraction-relaxation of the smooth muscle of the uterus is unique [1]. Over half of patients who enter labor prior to 37 weeks gestation deliver preterm [2]. Tocolytics currently in use to prevent labor are largely ineffective are only evaluated to delay labor for 48 hours and none carry an FDA indication for their use as tocolytics [3,4]. In order to reduce the morbidity and mortality that results from preterm delivery, we need to understand the contraction-relaxation signaling in the smooth muscle (myometrium) of the uterus involved in the induction of labor and how this is disparately activated in preterm labor. The basis of this signaling is the myometrial proteome and its post-translation regulation. These proteins and their pathways are at the heart of induction of labor and must be understood in the context of human pregnancy in order to identify the anomalous events that take place in preterm labor. In order to understand myometrial signaling we must first identify the myometrial proteome and semi-quantitatively measure how proteins and their post-translational regulation are changing in different states of human pregnancy. By identifying and semi-quantifying the human myometrial pregnancy proteome we will begin to amass a differentially expressed data set that can help guide an understanding of the signaling pathways most likely altered in preterm labor. This will provide a directed approach to investigating the mechanism of action of proteins that we show to be anomalous in spontaneous preterm labor in order to identify new therapeutic targets for preventing preterm labor. Although our dataset is comprised of over two-thousand proteins, we realize that there are thousands more that we do not positively identify using current protein extraction and separation techniques. This in no way diminishes the value of our dataset as even this fraction of proteins allows us to generate a scaled proteome map that is useful in directing future hypothesis driven research. Ahrens et al. [5] reviewed this concept of creating multiple levels of proteome coverage and integrating all of the different proteomic data into a “map”. We have created a baseline proteome map of human uterine smooth muscle (HUSM) that will allow future research to add more in-depth layers until ultimately completing the proteomic profile of HUSM in disparate states of labor in health and disease. This will be an immensely useful tool for researchers and clinicians because it will ultimately provide ways to prevent preterm delivery, a uniquely human problem with enormous impact on society.
The use of high-resolution mass spectrometry (MS) as well as improvements in MS-based data analysis software provide for several different quantification options. The two most popular label-free MS-based quantification techniques are spectral counting (SC) and area under the curve of extracted ion chromatograms (AUC). SC infers the quantity of protein indirectly from the number of peptide-to-spectrum matches (PSMs; spectrum count) obtained for each protein [6]. Intensity-based label free quantification (e.g., AUC) employs the MS signal response of intact peptides and, by inference, that of proteins for quantification [6]. AUC is accomplished by integrating the ion intensities of any given peptide over its chromatographic elution profile.
This measure of MS1 intensity is potentially a more accurate mode of label-free quantification as it can provide measurements in the low abundance range since every sequenced peptide is observed with intensity. This information is lost in SC, which limits quantification of the low abundance proteins identified by low numbers of MS/MS spectra only [7]. We attempted to utilize both analysis techniques, but chromatographic shifts during the two-dimensional LC prevented us from aligning all samples for MS1 quantitation. The reason for this is that not all samples elute at exactly the same time, and during 24 fractionations there are shifts that leave some peptides in different fractions (Figure 1A). This does not affect SC quantification as the identifying peptides will be seen no matter what fraction they are in. Alignment was performed with 3 preterm labor samples aligned with 31 samples. Therefore we performed an AUC analysis on these to compare to the low abundance spectral count proteins and found good agreement between the two analyses when there were enough spectral counts to positively identify a protein (Figure 1B).
Chemicals
Sodium ascorbate, N-2-Hydroxyethylpiperazine-N'-2-ethanesulfonic acid (HEPES), neocuproine, 3-(3-cholamidopropyl)dimethylammonio-1-propanesulfonate (CHAPS), sodium dodecyl sulfate (SDS), and all other chemicals unless specified, were obtained from Sigma (St Louis, MO).
Tissue collection
All research was reviewed and approved by the University of Nevada Biomedical Institutional Review Board (IRB) and the Renown Hospital IRB for the protection of human subjects. Human uterine myometrial biopsies are obtained with written informed consent from mothers undergoing Cesarean section (C/S). Patients in spontaneous preterm labor (28-35 week, singleton pregnancies) without infection or rupture of membranes (hypertension of pregnancy), term in labor (37.5-41) or term not in labor (caesarian delivery on maternal request, 39-41 week, singleton) are approached for consent. The tissue sample is taken from the superior aspect of the standard transverse incision. Women are sometimes in labor at the time of C/S as determined by the surgeon. All clinical data on the treatments received and the pregnancy course prior to C/S are collected without any patient identification.
Exclusion criteria include age <21 years, any infection including vaginitis or chorioamnionitis, history of drug abuse, co-morbid diagnoses such as AIDS, hepatitis C infection, uncontrolled diabetes, preeclampsia and any use of steroids including topical use. No patient identifying information is collected. On occasion, a woman will spontaneously progress to labor without sufficient cervical dilation or for other clinical reasons will be delivered by C/S prior to term while in labor. Patients in this circumstance with singleton pregnancies and no infection, as identified by the care team, are consented with the permission of the attending physician. We define preterm labor samples as any early gestational period up to, but not beyond 35 weeks. Tissues were transported to the laboratory immediately in cold physiological buffer, microdissected under magnification to isolate smooth muscle devoid of blood vessels, snap frozen in liquid nitrogen, and stored at -80°C. The average maternal and gestational ages (mean ± SD) for patients in the pregnant laboring group was 29 ± 5.3 years and 38.9 ± 1.0 weeks; in the non- laboring group 28.5 ± 5.9 years and 30.8 ± 8.6 weeks; in the preterm laboring group the mean patient age was 31.6 ± 6.97 years with a gestational age mean of 39.1 ± 0.53 weeks. Patients represented a range of ethnicities and were 52% Caucasian, 30% Hispanic, 7.4% African American, and 11% other.
Protein isolation
To isolate total protein, myometrial muscle samples from 12 patients in each pregnancy state were ground to a powder under liquid nitrogen using a pre-cooled stainless- steel mortar and pestle and reconstituted in 20 ml HEN buffer (25 mM HEPES-NaOH, 1 mM EDTA, 0.1 mM neocuprine, pH 7.7). Samples were pooled as follows for MS/MS analysis: (preterm labor (PTL) 1, 4 unique patients; PTL2, 4 unique patients; PTL3, 4 unique patients, term in labor (L) 1, 4 unique patients; L2, 4 unique patients; L3, 4 unique patients, term not in labor (NL) 1, 4 unique patients; NL2, 4 unique patients; NL3, 4 unique patients; for a total of 12 unique patients split into 3 biological replicates to help control for human diversity). Samples were sonicated on ice (10 X 2 sec bursts, 70% duty cycle) and brought to 0.4% CHAPS. Samples were then centrifuged at 2000 x g for 10 min at 4°C. Protein concentration was determined by the bicinchoninic acid (BCA) assay and samples diluted to 0.8 mg/ml in HEN buffer. This procedure was followed in order to mimic the conditions employed for protein isolation during measurement of the human uterine smooth muscle S-nitrosoproteome [8].
Protein digestion and mass spectrometry
The Nevada Proteomics Center analyzed selected proteins by trypsin digestion and two-dimensional LC/MS/MS analysis. Samples were digested and desalted according to the method of Brill et al. [5]. Peptides from 1 mg of protein were re- suspended in 200 µl of 95% solvent C/5% solvent D (Solvent C = 5% acetonitrile/0.1% formic acid in H2O; Solvent D = 25% acetonitrile/0.1% formic acid in H2O, containing 500 mM KCl (Sigma– Aldrich)). The peptide mixture was vortexed at maximum speed for 30 sec, then vortexed repeatedly at medium speed over 30 min at room temperature, then vortexed again at maximum speed for 30 sec and finally sonicated as above for 20 min. The peptide mixture was centrifuged for 10 min at 14,000 rpm at room temperature. The supernatant containing soluble peptides was transferred to a deactivated, Qsert snap cap glass sample vial, which includes caps with PTFR/silicone septa (Waters, P/N 186001124DV), sealed and immediately stored at 4°C.
Peptides were separated using strong cation exchange (SCX) within 1 hour of preparation or less, as described below. The peptides were subjected to SCX chromatographic fractionation followed by reversed phase HPLC-tandem mass spectrometry. SCX peptides were separated over a 50 min gradient on a Paradigm Multi-Dimensional Liquid Chromatography (MDLC) instrument (Michrom Bioresources Inc., Auburn, CA) using a polysulfoethyl A, 5 μ 200Å (2.0 x 150 mm) column, (PolyLC, Inc., Columbia, MD) at a flow rate of 200 µl/min producing a total of twenty four fractions collected by a Probot fraction collector (LC Packings, Netherlands). The SCX fractions were then loaded into a Paradigm AS1 (Michrom Bioresources Inc., Auburn, CA) autosampler. The autosampler stored the fractions at 4° C during the duration of the analysis.
Fifty microliters of the SCX fraction was loaded onto the vented trap prior to HPLC analysis. A Paradigm MDLC instrument (Magic C18AQ 3 µ 200Å (0.2 x 50 mm) column, (Michrom Bioresources Inc., Auburn, CA) with an Agilent ZORBAX 300SB-C18 5 µ (5 x 0.3 mm) trap (Agilent Technologies, Santa Clara, CA) was used. The gradient employed was 0.1% formic acid in water (Pump A) and 0.1% formic acid in Acetonitrile (Pump B) as follows (Time (min), Flow (µl/min),
Pump B (%): (0.00, 2.00, 5.00), (6.00, 2.00, 5.00), (185.00, 2.00, 35.00), (188.00, 2.00, 80.00), (190.00, 2.00, 80.00), (193.00, 2.00, 5.00), (200.00, 2.00, 5.00). Eluted peptides were analyzed using a Thermo Finnigan LTQ-Orbitrap using Xcalibur v 2.0.7. MS spectra (m/z 300–2000) were acquired in the positive ion mode with resolution of 60,000 in profile mode. The top 4 data- dependent signals were analyzed by MS/MS with CID activation, minimum signal of 2,000, isolation width of 3.0, and normalized collision energy of 35.0. The reject mass list included: 323.2040, 356.0690, 371.1010, 372.1000, 373.0980, 445.1200, 523.2840, 536.1650, 571.5509, 572.5680, 575.5494, 677.6090, 737.7063, 747.3510, 761.7316, 763.8791, 767.0623, 824.4870, 832.1884, 930.1760, 1106.0552, 1106.0564, 1142.0940 and 1150.0927. Dynamic exclusion settings were used with a repeat count of 2, repeat duration of 10 sec, exclusion list size of 500 and exclusion duration of 30 seconds.
Database searching
Tandem mass spectra were extracted, charge state deconvoluted and deisotoped by Sorcerer (SageN, Milpitas, CA; version 3.5). All MS/MS samples were analyzed using Sequest (Thermo Fisher Scientific, San Jose, CA, USA; version v.27, rev. 11). Sequest was initiated to search the database containing ipi.HUMAN.v3.87, the Global Proteome Machine cRAP v.2012.01.01, and random decoy sequences (183158 entries) assuming the digestion enzyme trypsin with a maximum of two missed cleavages. Sequest was searched with a fragment ion mass tolerance of 1.00 Da and a parent ion tolerance of 10 ppm. Carbamidomethyl of cysteine was specified in Sequest as a fixed modification. Oxidation of methionine was specified in Sequest as a variable modification. The mass spectrometry proteomics data have been deposited to the ProteomeXchange Consortium (http://proteomecentral.Proteom exchange.org) (The authors are currently waiting for a dataset identifier and DOI to link readers to all protein and peptide identification data).
Criteria for protein identification
PROTEOIQ (V2.6, www.nusep.com) was used to validate MS/MS based peptide and protein identifications. Peptides were parsed before analysis with a minimum Xcorr value of 1.5 and a minimum length of 6 amino acids. A false discovery rate was set to ≤1.0% of all identifications. Peptide identifications were accepted if they could be established at greater than 95.0% probability as specified by the Peptide Prophet algorithm [10]. Protein identifications were accepted if they could be established at greater than 95.0% probability and contained at least two identified peptides with 5 spectra per peptide. Protein probabilities were assigned by the Protein Prophet algorithm [11]. Proteins that contained similar peptides and could not be differentiated based on MS/MS analysis alone were grouped to satisfy the principles of parsimony
Semi-quantification and data analysis
SC data were analyzed using the in program statistical package provided with ProteoIQ. Total spectral counts using normalization was used, the normalization factors are calculated such that the total spectral counts for all proteins in each replicate and biological sample are equal. The normalization factors are then applied to the spectral counts for each protein. ProteoIQ can generate P-values for proteins based on quantitative information in biological groups and replicates. In ANOVA the F-statistic tests the significance of quantitation differences between biological groups against the reproducibility of their replicates. The F-statistic measures the ratio of explained error (difference across groups) to the unexplained error (difference across replicates). The P-value corresponds to the probability of the null hypothesis that the relative expression for a given protein is equal across groups. Overall, smaller P values lead to the rejection of the null hypothesis and indicate a lower chance of quantitation differences between groups being due to random error. The statistical significance level for 3-way comparisons of spectral counts measures was pre-determined as 0.05.
Pathway analysis
In conjunction with our bioinformatics core we used Ingenuity Computational Pathway Analysis (IPA®) (Ingenuity systems; Redwood city, CA) software to elucidate the global implications of differentially expressed proteins in PTL patients. IPA® was applied to identify potentially perturbed molecular pathways and networks in PTL patients. The IPA program uses a knowledge database derived from the literature to relate the proteins to each other, based on their interaction and function. The knowledge base consists of a high quality expert-curated database containing 1.5 million biological findings consisting of more than 42,000 mammalian genes and pathway interactions extracted from the literature. In brief, proteins that were confidently identified and showed a statistically significant change (± log2 1, p > 0.05) were considered for IPA® analysis. The IPA® software then used these proteins and their identifiers to navigate the curated literature database and extract overlapping network(s) between the candidate proteins. Associated networks were generated, along with a score representing the log probability of a particular network being found by random chance. Top canonical pathways associated with the uploaded data were presented, along with a p-value. Furthermore, upstream regulators that are likely to be responsible for the observed changes were predicted to be activated or inhibited. The p-values were calculated using right-tailed Fisher's exact tests. IPA® also uses a z-score algorithm to reduce the chance that random data will generate significant predictions.
Western blotting
10 g of each protein from each pooled sample was separated on SDS-PAGE gels, and transferred to nitrocellulose membranes. Primary antibodies for the mammalian target of rapamycin mTOR (7C10, Cell Signaling Technologies), human fibronectin HFN 7.1(Developmental Studies Hybridoma Bank), the heat shock protein HSP27 (C-20) and GAPDH (0411, Santa Cruz Biotech) were added to blots in Odyssey incubation buffer overnight using the manufacturers recommended dilution. Primary antibodies were detected with Alexafluor680 (Molecular Probes, Eugene, OR) or IRDye800 (Rockland Immunochemicals, Gilbertsville, PA) fluorescently conjugated secondary antibodies. Band intensities were quantified with an Odyssey Infrared Imaging System (LiCor Biosciences, Lincoln, NE).
This work describes the HUSM proteome in 3 distinct states of human pregnancy. We unambiguously identified a total of protein groups with the following breakdown: 1869 proteins identified in term laboring tissue samples, 1963 proteins identified in term non-laboring tissue samples, and 2102 proteins identified in preterm laboring samples (Figure 2). We show that 201 of these 2132 proteins show disparate regulation in the PTL state as evidenced by a log2 relative expression of ± 1 and p ≤ 0.05 as compared to the NL state when measured by semi- quantitative spectral counting (Figure 3). We identified 41 proteins specific to PTL that met our statistical criteria, and another 55 that were specific to PTL and L (Figure 3 Inset). This is the most comprehensive semi-quantitative proteomic study accomplished in human myometrium and provides a useful set of protein expression data in different states of pregnancy. We initially attempted to analyze our data using both area under the curve of extracted ion chromatograms (AUC) and spectral counting (SC). Unfortunately, the process of separating peptides in 2- dimensions led to shifts in the chromatography peaks that are used to integrate the AUC data and therefore AUC analysis was not possible with this data set. However, SC data analysis allows for identification of specific trends that show disparate levels of protein between groups. In order to better understand the relevance of the disparate levels of protein expression seen, we employed IPA® to help delineate the molecular networks and pathways that were most likely impacted in reference to these proteomic changes. Network analysis of perturbed biological function highlighted an increase in the inflammatory response in PTL as compared to NL (Table 1 and Figure 4). The molecular activation prediction algorithm available in IPA® identified tumor necrosis factor (TNFα) as an upstream regulator of the majority of proteins that were up- regulated in PTL. Included in this group was serine/threonine-protein kinase mTOR (mammalian target of rapamycin) as well as several additional proteins integral to the canonical mTOR signaling pathway which was among the top-scored perturbed pathways in our pathway analysis.
The IPA® generated mTOR canonical pathway allows a molecular activation prediction to be made and compared among tissue states of human pregnancy. The analysis of the proteome of tissues from patients delivering at term but not in labor shows mTOR pathway proteins relatively down-regulated consistent with predicted inhibition of multiple down-stream processes (Figure 5A). For samples collected from patients in labor at term, there was a tendency for the pathway to be up-regulated. This was far more pronounced in samples from patients in preterm labor consistent with changes in multiple down-stream processes (Figure 5B).
Many have argued that proteomic data should be confirmed by Western. If anything, this is rather odd thinking and proteomic analysis is the less ambiguous of the methods [12]. Nonetheless, we have examined some of the data presented here using alternate methodology, we have examined changes in protein expression using Western analysis (Figure 6). The mammalian target of rapamycin (mTOR), also known as mechanistic target of rapamycin or FK506 binding protein, is a serine/threonine protein kinase, a phosphatidylinositol 3-kinase- related kinase protein family that regulates cell growth, cell proliferation, cell motility, cell survival, protein synthesis, and transcription [13]. The proteomic data presented here show that expression of mTOR protein is up-regulated in preterm labor when compared to pregnant tissues at term not in labor. This result was verified using Western blot analysis (Figure 6) where a large increase in protein expression is seen. Glyceraldehyde 3-phosphate dehydrogenase (GAPDH) did not change in human pregnancy according to proteomic data and this was confirmed by Western. Fibronectin-1 is a glycoprotein present in a dimeric or multimeric form at the cell surface and in the myometrial extracellular matrix. Fibronectin is involved in cell adhesion and integrin signaling and increased smooth muscle fibronectin has been associated with disease [14]. Our proteomic data show elevation of fibronectin (FN1) that was confirmed by Western analysis. The heat shock protein HSP27 is known to be associated with human myometrial contraction.
Our protein data by Western showing no change in HSP27 between term tissues and term tissues from patients in labor, are consistent with what has been seen by others using proteomic data [15]. Our finding that HSP27 is decreased in preterm labor is consistent with our proteomic data (Figure 6).
Table 1. IPA® generated biological function analysis. The inflammatory response was identified as the most perturbed biological function based on the provided protein expression profile. UNIPROT identifiers for the listed molecules can be found in Table S1.
|
|
|
Predictd
|
|
|
|
|
|
|
Activatin
|
Activatin z-
|
|
|
|
Functions Annotation
|
p-Value
|
State
|
score
|
# Molecules
|
Molecules
|
|
accumulation of myeloid cells
|
4.00E-07
|
Increased
|
3.11
|
12
|
CTSG, ELANE, HMOX1, ITGA6, ITGB2, LAMA5, NT5E, POSTN, PRTN3, S100A8, S100A9, THBS1
|
|
accumulation of phagocytes
|
4.64E-07
|
Increased
|
3.106
|
11
|
CTSG, ELANE, HMOX1, ITGA6, ITGB2, LAMA5, NT5E, PRTN3, S100A8, S100A9, THBS1
|
|
|
|
|
|
|
CD14, CD276, CTSG, ELANE, FKBP1A, FN1, HMOX1, HSPH1, ITGB2, LCN2, LTBP1, LTF, MPO, NT5E, PRG2,
|
|
activation of leukocytes
|
5.08E-04
|
Increased
|
3.061
|
20
|
PRTN3, S100A8, S100A9, SERPINB9, THBS1
|
|
activation of myeloid cells
|
5.97E-07
|
Increased
|
2.896
|
15
|
CD14, ELANE, FKBP1A, FN1, HMOX1, ITGB2, LCN2, LTBP1, LTF, MPO, PRG2, PRTN3, S100A8, S100A9, THBS1
|
|
accumulation of neutrophils
|
4.08E-07
|
Increased
|
2.789
|
8
|
CTSG, ELANE, ITGA6, ITGB2, LAMA5, PRTN3, S100A8, S100A9
|
|
accumulation of granulocytes
|
2.02E-06
|
Increased
|
2.789
|
9
|
CTSG, ELANE, ITGA6, ITGB2, LAMA5, POSTN, PRTN3, S100A8, S100A9
|
|
activation of phagocytes
|
1.01E-04
|
Increased
|
2.579
|
13
|
CD14, ELANE, FKBP1A, FN1, HMOX1, LCN2, LTBP1, LTF, MPO, PRG2, PRTN3, S100A9, THBS1
|
|
activation of granulocytes
|
4.59E-06
|
Increased
|
2.377
|
9
|
CD14, ELANE, FKBP1A, HMOX1, ITGB2, LCN2, LTF, PRG2, PRTN3
|
|
chemotaxis of leukocytes
|
1.86E-03
|
Increased
|
2.253
|
12
|
CTSG, ELANE, FLT1, FN1, GIT2, ITGB2, LSP1, PIGR, PRTN3, S100A8, S100A9, THBS1
|
|
activation of neutrophils
|
5.71E-06
|
Increased
|
2.157
|
8
|
CD14, ELANE, FKBP1A, HMOX1, LCN2, LTF, PRG2, PRTN3
|
|
cell movement of phagocytes
|
1.71E-03
|
Increased
|
2.106
|
16
|
COL1A1, CTSG, ELANE, FLT1, FN1, GIT2, HARS, HMOX1, ITGB2, LSP1, PIGR, PRTN3, S100A8, S100A9, SWAP70, THBS1
|
|
chemotaxis of phagocytes
|
1.15E-03
|
Increased
|
2.035
|
11
|
CTSG, ELANE, FLT1, GIT2, ITGB2, LSP1, PIGR, PRTN3, S100A8, S100A9, THBS1
|
|
chemotaxis of myeloid cells
|
8.86E-04
|
Increased
|
2.035
|
11
|
CTSG, ELANE, FLT1, GIT2, ITGB2, LSP1, PIGR, PRTN3, S100A8, S100A9, THBS1
|
|
quantity of monocytes
|
8.52E-03
|
Decreased
|
-2.19
|
5
|
ITGB2, LCN2, MPO, PRTN3, THBS1
|
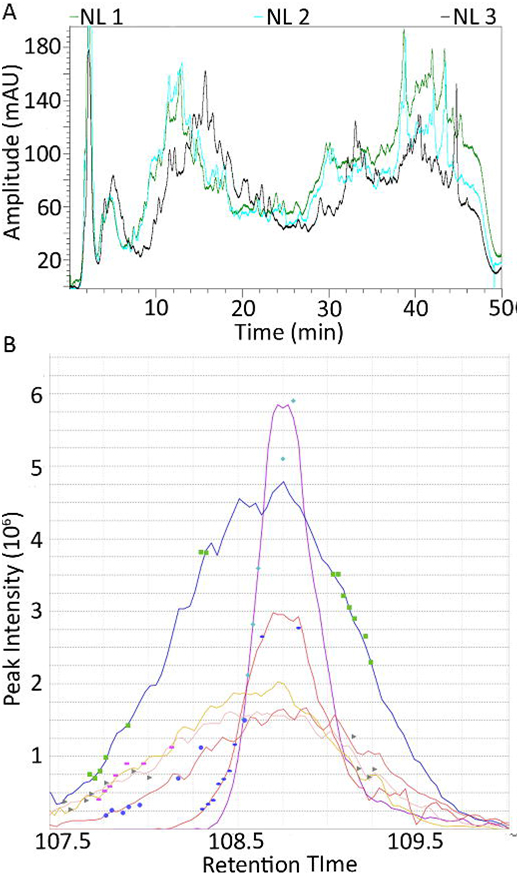
Figure 1. Two-dimensional seperation of human uterine smooth muscle peptides. (A) Representative UV trace of first dimension SCX separation: 7 of 9 groups showed variation of ± 15 seconds of retention time on the SCX column (Black line is NL 1 which is representative of the other 6 samples). NL2 and NL3 showed a non-linear shift of ≥ 4 minutes which inhibited our ability to perform AUC. Fractions were taken every two minutes and the non-linear 4 minute shift resulted in the elution of peptides from NL2 and NL3 in different fractions than the corresponding fractions from the other 7 samples. This resulted in these peptides running in different fractions during the second dimension reverse phase separation and inability to overlap the MS1 chromatograms. (B) Area under the curve analysis of a representative peptide identified and aligned in 3 PTL samples (upper 3 curves) and 3 L samples (lower 3 curves). The pattern of increased levels of PTL peptides as shown by a larger area under the curve was recapitulated when measured by spectral counting.
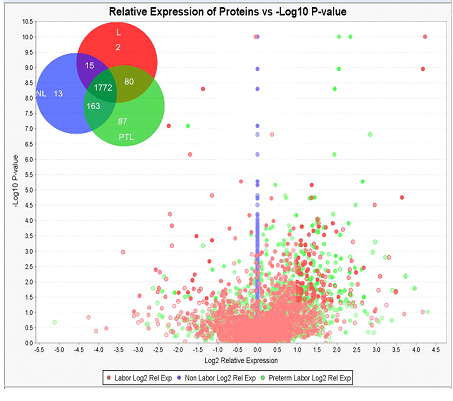
Figure 2. Disparate Protein Expression in Different States of Pregnancy. Volcano plot showing disparate regulation of L (red dots) and PTL (green dots) as compared to NL (blue dots). Proteins were considered significant and interesting if they fell outside of the shaded boxes. This area represents those proteins that showed a log2 change of ± 1 with a p-value ≤ 0.05. Venn diagram inset shows the group distribution of proteins identified in each state of pregnancy.
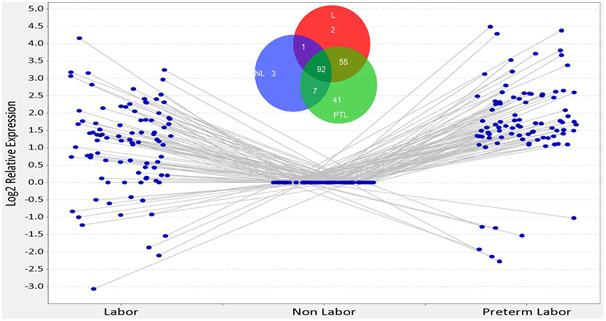
Figure 3. Relative expression profile of the human uterine smooth muscle proteome in disparate states of pregnancy. Scatter plot representing the 92 proteins that were identified in all 3 states of pregnancy and showed a log2 change of ± 1 with a p-value ≤ 0.05. Venn diagram inset represents all 201 proteins that showed a log2 change of ± 1 with a p-value ≤ 0.05. Proteins that were not represented in all groups are not shown on the scatterplot; these proteins all had a log2 relative expression of ±10 in at least one of the groups.
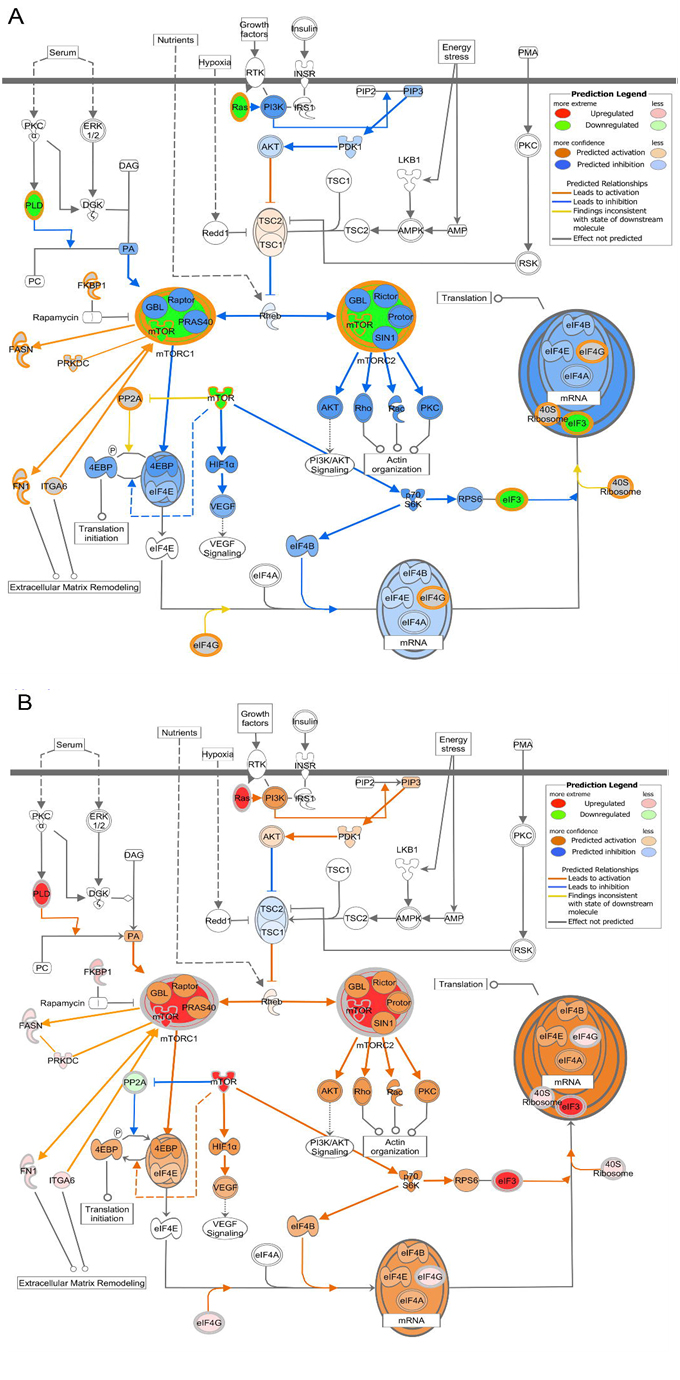
Figure 4. Network analysis of the TNFα regulated inflammatory response in pregnancy. IPA® generated network of select proteins involved in the inflammatory response regulated by TNFα. This protein expression pattern is consistent with the predicted activation of TNFα and downstream regulation of these and other proteins.
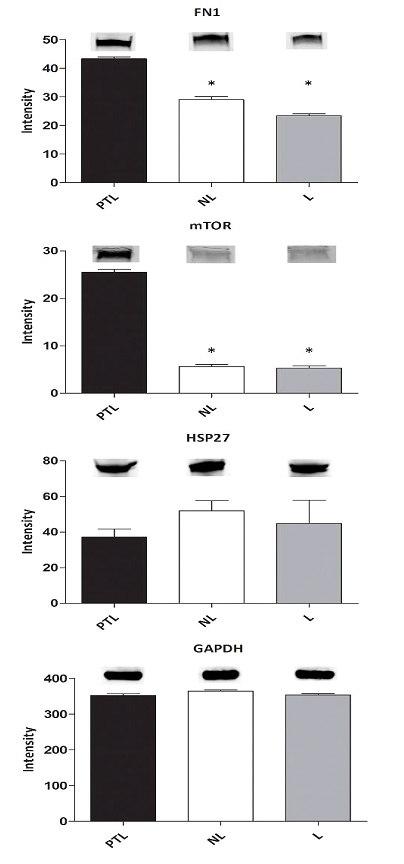
Figure 5. IPA® generated mTOR canonical pathway with molecular activation prediction. (A) Term not in labor mTOR pathway proteins show down regulation consistent with predicted inhibition of multiple down-stream processes. (B) Preterm labor mTOR pathway proteins show up regulation consistent with up regulation of multiple down-stream processes. Note, term in labor protein expression trended in the direction of up regulation but was not as pronounced as PTL (not shown).
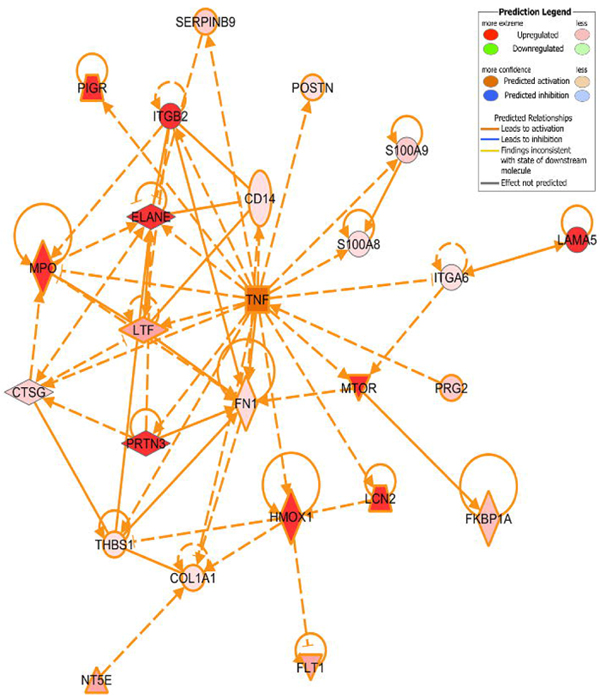
Figure 6. End point analysis of several proteins of interest to verify changes identified by MS/MS analysis. Protein extracts from myometrial muscle samples from 12 patients in each pregnancy state were run on SDS-Polyacrylamide gel, transferred to nitrocellulose and blotted for proteins that were shown to be disparately regulated by MS/MS analysis. Band intensities are averages (n=3) for the pooled groups, * indicates samples were significantly different from PTL at p < .05. The inset bands are representative of that group’s average band intensity.
HUSM proteome
The pattern of proteomic regulation during PTL is skewed toward an increase in the majority of disparately regulated proteins. It is currently unclear why the majority of proteins that showed a significant difference trend to an increase in PTL. What is clear from the protein expression data is that PTL is a perturbed state of the tissue in which some of the regulatory pathways involved in the induction of labor are affected. Because the PTL patients included in this analysis had no evidence of infection at the time of labor, we suggest that the changes we see are unrelated to bacterial pathogens. Of particular interest, we show that laminin subunit alpha-5 (LAMA5), integrin alpha-6 (ITGA6), and fibronectin (FN1) are all up- regulated in PTL patients. These proteins are involved in extracellular matrix remodeling as well as transducing signals from the extracellular environment. The role these proteins assume during the induction of labor is unknown; however our data are in accord with these proteins having an integral function during the switch from uterine quiescence to the contractile state of preterm labor.
2021 Copyright OAT. All rights reserv
Pathway analysis
Perturbation of the TNFα signaling network during PTL is of great interest considering the notion that pregnancy is likely an inflammatory state and therefore the myometrial reaction to this state must be integral to the progression of pregnancy and induction of labor. TNFα protein, mRNA, and receptors are present in multiple reproductive tissues throughout pregnancy, including the endometrium [16,17] and myometrium [18,19]. It has been shown that myometrial TNFα receptors increase with gestation and labor arguing for a critical signaling role with advancing pregnancy and labor [18]. Of particular interest, it has been shown that high concentrations of TNFα appear with the onset of those labors that are unresponsive to tocolysis [20]. Multiple groups have shown that TNFα works synergistically with other inflammatory cytokines to release prostaglandins, which can induce uterine contractions and labor and cyclooxygenase inhibitors have recently been implicated as a superior tocolytic target on this basis [21,22]. Genetic analysis of pro-labor genes in a cell culture model showed that one of the most important modulators was TNFα however, the global proteome changes induced by TNFα during pregnancy, labor, and PTL have not previously been elucidated [23]. Our research demonstrates that multiple proteins regulated by TNFα show increased expression in PTL patients when compared to NL patients. Of particular interest was the up-regulation of mTOR and its canonical signaling pathway in PTL (Figure 5). The mTOR pathway has been previously shown in rat to be involved in the proliferative activity of uterine myocytes [24,13].
Our data suggests an alternate role for mTOR signaling during human gestation. The up- regulation of multiple proteins in the mTOR signaling pathway during PTL, including those involved in cytoskeletal rearrangement and extracellular matrix remodeling, argue for a plausible role for this pathway in the early induction of labor. The fact that the increase in protein expression in the mTOR pathway is greater in both L and PTL (with PTL having the greatest increase) compared with the NL state of the tissue is intriguing. This is contrary to the notion that mTOR’s main role in pregnancy is to transduce proliferative phenotype signaling. Changes in mTOR shown here do not fit easily with the data of Foster et al. [25]. These authors examined mTOR and related molecule gene expression by quantitative polymerase chain reaction. These authors show that mTOR gene expression is significantly decreased in preterm tissues compared to non-pregnant tissues or tissues at term or at term in labor. It is not improbable that gene regulation can be turned off while protein levels remain. Indeed, because it is the protein that confers signaling function, we think that together with our data, the work of Foster et al. is all the more intriguing. There could be additional reasons for the apparently disparate nature of our results. The preterm patients enrolled in the Foster study included those with clinical infection at presentation. We are not told their number but it may be that all of the six patients presenting preterm in labor had chorioamnionitis. Such a confounding factor makes exact conclusions regarding our two studies difficult and underscores the importance of studying the proteome.
In conclusion, we have identified a baseline HUSM proteome that can be used to guide directed research into how perturbation of specific proteomic networks affects uterine quiescence as well as the induction of labor. The disparity in protein regulation among laboring and non-laboring phenotypes argues for a mechanistic role of the proteins involved and future work will identify what function these perturbed networks have during the induction of labor.
- Buxton IL (2004) Regulation of uterine function: a biochemical conundrum in the regulation of smooth muscle relaxation. Mol Pharmacol 65: 1051-1059. [Crossref]
- Hackney DN, Olson-Chen C, Thornburg LL (2013) What Do We Know about the Natural Outcomes of Preterm Labour? A Systematic Review and Meta-Analysis of Women without Tocolysis in Preterm Labour. Paediatric and perinatal epidemiology 27: 452-460. [Crossref]
- Alfirevic Z (2012) Tocolytics: do they actually work? BMJ 345: e6531. [Crossref]
- Haas DM, Kirkpatrick P, McIntosh JJ, and Caldwell DM (2012) Assessing the quality of evidence for preterm labor tocolytic trials. J Matern Fetal Neonatal Med 25: 1646-1652. [Crossref]
- Ahrens CH, Brunner E, Qeli E, Basler K, Aebersold R (2010) Generating and navigating proteome maps using mass spectrometry. Nat Rev Mol Cell Biol 11: 789-801. [Crossref]
- Bantscheff M, Lemeer S, Savitski MM, Kuster B (2012) Quantitative mass spectrometry in proteomics: critical review update from 2007 to the present. Analytical and bioanalytical chemistry 404: 939-965. [Crossref]
- Choi H, Glatter T, Gstaiger M, and Nesvizhskii AI (2012) SAINT-MS1: protein-protein interaction scoring using label-free intensity data in affinity purification-mass spectrometry experiments. J Proteome Res 11: 2619-2624. [Crossref]
- Ulrich C, Quilici DR, Schlauch KA, Buxton IL (2013) The human uterine smooth muscle S- nitrosoproteome fingerprint in pregnancy, labor, and preterm labor. Am J Physiol Cell Physiol 305: C803-816. [Crossref]
- Brill LM, Motamedchaboki K, Wu S, Wolf DA (2009) Comprehensive proteomic analysis of Schizosaccharomyces pombe by two-dimensional HPLC-tandem mass spectrometry. Methods 48: 311-319. [Crossref]
- Keller A, Nesvizhskii AI, Kolker E, Aebersold R (2002) Empirical statistical model to estimate the accuracy of peptide identifications made by MS/MS and database search. Anal Chem 74: 5383-5392. [Crossref]
- Nesvizhskii AI, Keller A, Kolker E, Aebersold R (2003) A statistical model for identifying proteins by tandem mass spectrometry. Anal Chem 75: 4646-4658. [Crossref]
- Mann M (2008) Can proteomics retire the western blot? J Proteome Res 7: 3065. [Crossref]
- Shynlova O, Tsui P, Jaffer S, Lye SJ (2009) Integration of endocrine and mechanical signals in the regulation of myometrial functions during pregnancy and labour. Eur J Obstet Gynecol Reprod Biol 144: S2-10. [Crossref]
- Fernandes DJ, Bonacci JV, Stewart AG (2006) Extracellular matrix, integrins, and mesenchymal cell function in the airways. Current drug targets 7: 567-577. [Crossref]
- MacIntyre DA, Tyson EK, Read M, Smith R, Yeo G, et al. (2008) Contraction in human myometrium is associated with changes in small heat shock proteins. Endocrinology 149: 245-252. [Crossref]
- Hunt JS, Chen HL, Hu XL, Tabibzadeh S (1992) Tumor necrosis factor-alpha messenger ribonucleic acid and protein in human endometrium. Biol reprod 47: 141-147. [Crossref]
- Tabibzadeh S (1991) Ubiquitous expression of TNF-alpha/cachectin immunoreactivity in human endometrium. Am J Reprod Immunol 26: 1-4. [Crossref]
- Alexander HA, Sooranna SR, Myatt L, Johnson MR (2012) Myometrial tumor necrosis factor-alpha receptors increase with gestation and labor and modulate gene expression through mitogen-activated kinase and nuclear factor-kappaB. Reproductive sciences 19: 43-54.
- Dudley DJ (1999) Immunoendocrinology of preterm labor: The link between corticotropin-releasing hormone and inflammation. Am J Obstet Gynecol 180: S251-S256. [Crossref]
- Steinborn A, Kuhnert M, Halberstadt E (1996) Immunmodulating cytokines induce term and preterm parturition. J Perinat Med 24: 381-390. [Crossref]
- Daher S, Fonseca F, Ribeiro OG, Musatti CC, Gerbase-DeLima M, et al. (1999) Tumor necrosis factor during pregnancy and at the onset of labor and spontaneous abortion. Eur J Obstet Gynecol Reprod Biol 83: 77-79. [Crossref]
- Haas DM, Caldwell DM, Kirkpatrick P, McIntosh JJ, Welton NJ (2012) Tocolytic therapy for preterm delivery: systematic review and network meta-analysis. BMJ 345: e6226.
- Tattersall M, Engineer N, Khanjani S, Sooranna SR, Roberts VH, et al. (2008) Pro-labour myometrial gene expression: are preterm labour and term labour the same? Reproduction 135: 569-579. [Crossref]
- Jaffer S, Shynlova O, Lye S (2009) Mammalian target of rapamycin is activated in association with myometrial proliferation during pregnancy. Endocrinology 150: 4672-4680. [Crossref]
- Foster HA, Davies J, Pink RC, Turkcigdem S, Goumenou A, et al. (2014) The human myometrium differentially expresses mTOR signalling components 346 before and during pregnancy: Evidence for regulation by progesterone. J steroid biochemistry and molecular biology 139: 166-172. [Crossref]
-