Case Report
Rifampicin induces multiple detoxification pathways, including those mediated by enzymes of the cytochrome P450 (CYP) family such as CYP2C9 and CYP3A4 [1], and is a known perpetrator of metabolic drug-drug interactions (mDDIs). Warfarin is a narrow therapeutic index anti-coagulant drug that is primarily cleared via CYP-mediated metabolism, and as such is a plausible victim of mDDIs with clinically relevant consequences. S-warfarin is primarily cleared by CYP2C9 while R-warfarin is exclusively cleared by CYP3A4 [2]. S-warfarin is 3-5 times more active than R-warfarin and is primarily responsible for the observed anticoagulant activity. While mDDIs involving rifampicin and warfarin have been reported [3-10], the appropriate schedule for warfarin dose reduction post cessation of rifampicin remains poorly defined and patients are at risk of both bleeding and thrombotic events during this period.
A 60 year-old Caucasian male with a history of coronary artery disease and recent mitral valve replacement presented to Flinders Medical Centre reporting a three-day history of fevers, chills, productive cough and shortness of breath. His target INR of 2.5 to 3.5 was maintained on a warfarin dose of 8mg QD. Other concurrent medications were bisoprolol, rosuvastatin, spironolactone and frusemide. On admission the patient had a temperature of 38.3°C, blood pressure of 100 / 60 mmHg, plasma albumin concentration of 32 g/L (34 to 48 g/L), and an INR of 1.5. During the first 48 hours of the admission a number of positive blood cultures were reported and a subsequent trans-esophageal echocardiogram (TOE) revealed infective vegetation of the mitral valve. The patient was diagnosed with methicillin-sensitive staphylococcus endocarditis, treated with gentamicin 80mg IV BD for six days then commenced on a six-week course of flucloxacillin 2g IV q4h and rifampicin 300mg PO BD.
During treatment with rifampicin the patient’s international normalized ratio (INR) was measured daily (Figure 1) and his warfarin dose was adjusted in order to achieve an INR within an interim accepted range of >2.0. Paradoxically, despite an unintentional initial reduction in warfarin dose during the first three days of rifampicin therapy (from 10 mg to 5 mg, 3 mg then 1 mg), an INR increase (from 1.7 to 2.7) was observed. Indeed, the patient’s warfarin dose requirement remained relatively stable (between 10 to 15 mg) during the initial fourteen days of concomitant rifampicin. Over the following four weeks the interaction between warfarin and rifampicin become apparent, with the patient’s warfarin dose requirement increasing steadily to a maximum of 35mg QD at the time of cessation of rifampicin (Figure 2). Despite substantial increases in warfarin dose, the patient’s INR remained sub-therapeutic during this time.
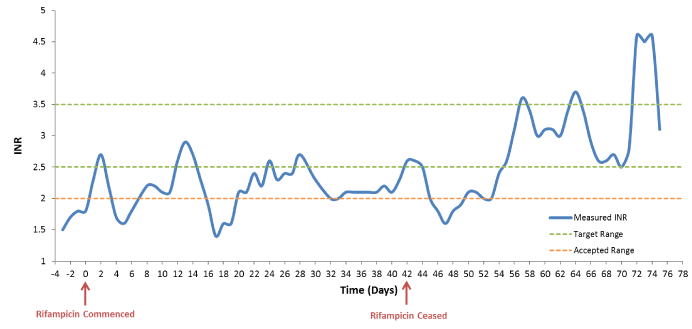
Figure 1. Observed changes in INR during and post co-administration of rifampicin
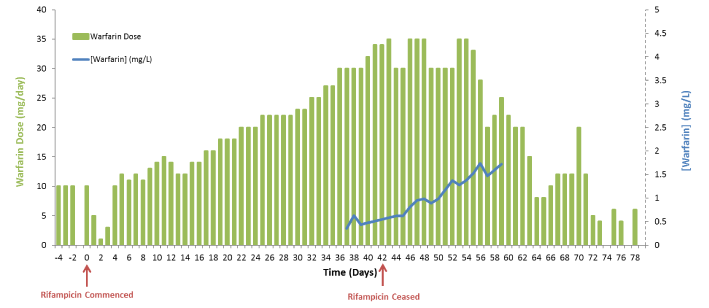
Figure 2. Observed changes in warfarin dose requirement and plasma warfarin concentration during and post co-administration of rifampicin
Daily total plasma warfarin concentrations were determined during the final six days of rifampicin treatment, and for a period of 17 days following treatment cessation (Figure 2). Warfarin concentrations were quantified by ultra-performance liquid chromatography (UPLC) with detection by tunable ultraviolet absorbance (TUV) using a Waters AcquityTM UPLC System. Briefly, 50 µL plasma calibrator or patient sample was diluted in 400 µL of 0.1% formic acid in acetonitrile. The resulting mixture was vortexed for 20 sec, allowed to stand for 10 min then centrifuged at 16,000 g for 3 min. Two microliters (2 µL) of the resulting supernatant was injected onto a Waters AcquityTM BEH C18 column (2.1 x 100 mm, 1.7 µm). Warfarin was separated from matrix components using a mobile phase comprising 55% acetonitrile and 0.05% formic acid water at a flow rate of 0.3 mL/min. TUV detection at 305 nm was used for quantification. The purity of the warfarin peak used for analysis was confirmed by mass spectrometry (MS) performed on a Waters Q-ToF PremierTM quadrupole, orthogonal acceleration time-of-flight tandem mass spectrometer (Q-ToF-MS) operated in positive electrospray ionization (ESI+) mode.
A physiologically based pharmacokinetic (PBPK) model was used to simulate the extent and time-course of the impact of rifampicin coadministration on exposure to total and racemic (R- and S-) warfarin. The PBPK model and simulations were performed using a PBPK profile for warfarin built using published pharmacokinetic data from human clinical trials [11] and physiochemical characteristics (e.g. Log P, molecular weight, B:P, molecule type) for this drug using the retrograde function in Simcyp (v14.1). Outputs from this model were specifically used to estimate the magnitude and time-course of changes in warfarin intrinsic clearance (Figure 3) and the extent and time-course of CYP2C9 and CYP3A4 induction during treatment with rifampicin and deinduction following cessation of rifampicin. Consistent with the patient’s increase in warfarin dose requirement while undergoing treatment with rifampicin, the model predicted a five-fold increase in warfarin intrinsic clearance, primarily due to induction of CYP3A4 mediated clearance of R-warfarin. CYP2C9 and CYP3A4 half-lives of approximately 48 hours were predicted, with a return to baseline warfarin clearance over 14.5 days.
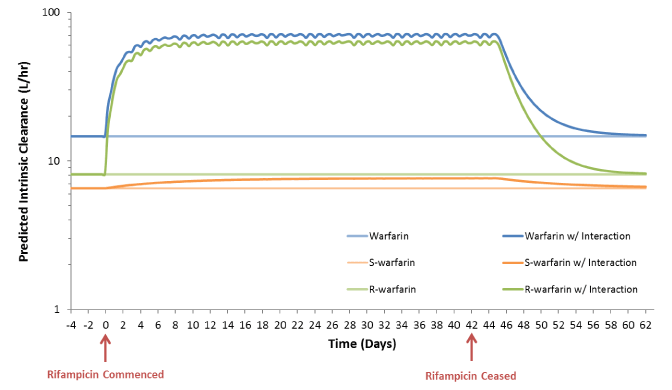
Figure 3. Simulated effects of rifampicin co-administration on the intrinsic clearances of total, R- and S- warfarin.
As predicted, an increase in total plasma warfarin concentration was observed following cessation of rifampicin (Figure 2). However, inconsistent with this increase in warfarin exposure, a concurrent decrease in INR was observed (from 2.6 to 1.6) over the 10 days following cessation of rifampicin (between days 42 and 52). Indeed, a return to therapeutic INR was not achieved until 12 days post cessation of rifampicin (day 54) at which time a reduction in the patient’s warfarin dose was commenced. Over the subsequent 14 days the warfarin dose was reduced, maintaining a therapeutic, and at times supra-therapeutic, INR until a return to baseline warfarin dose requirement at day 68.
While rifampicin is a predictable perpetrator of mDDIs increasing warfarin dose requirement, the time course of this interaction remains poorly described. PBPK modelling is a well-established tool for the assessment of drug exposure and the impact of covariates such as mDDIs on drug exposure in pre-clinical drug development. Using PBPK modelling to address complex drug dosing scenarios, such as the one presented in this case, is an intriguing novel application for the technology. Here, the PBPK model accurately predicted the change in warfarin exposure and total CYP activity following commencement and cessation of rifampicin. However, initial observed effects on INR at the commencement and cessation of rifampicin were inconsistent with the observed changes in warfarin exposure; the mechanism of this inconsistency is unclear. In this regard, the vitamin K cycle involves the cyclic production of oxidized (KO) and reduced (KH2) forms, where KH2 is the active form. Warfarin elicits an anticoagulant effect by inhibiting the vitamin K epoxide reductase (VCOR)-mediated reduction of vitamin KO [12]. However, multiple studies have demonstrated the presence of an alternate warfarin-insensitive KO reduction pathway [13,14]. It is plausible that modulation of the warfarin-insensitive KO reduction pathway may contribute to the paradoxical INR changes observed during rifampicin treatment. Alternatively, rifampicin is also a reversible inhibitor of the organic anion transport polypeptide (OATP) family of uptake transporters, for which warfarin is a substrate. It has previously been proposed that given the shorter time course of inhibition and reversal of inhibition compared to induction and de-induction, inhibition of OATP by rifampicin may initially and transiently reduce warfarin elimination [15]. Both mechanisms warrant further investigation.
This issue notwithstanding, the case reported indicates that a dose reduction in warfarin may not be required for over a week after ceasing rifampicin. In previously published cases, patients’ INRs often fall sub-therapeutic after ceasing rifampicin due to initial reduction in the warfarin dose, likely due to anticipation of enzyme deinduction. This is the first report to describe a paradoxical effect on INR in response to commencing and ceasing rifampicin. A similar time-profile change in INR for a patient commenced on rifampicin was reported recently [3], however in this report the authors attributed the INR effect to the co-administration of ceftriaxone. Given the comparable INR changes observed in these two cases, despite this patient not being co-administered ceftriaxone, we propose that the inconsistent INR response observed in both cases may be due to a complex, and currently undefined, interaction resulting from coadministration of rifampicin.
This case highlights the importance of frequent INR monitoring during concurrent treatment with and after cessation of rifampicin in patients taking warfarin. Care should be taken with reducing the warfarin dose in anticipation of reversal of the interaction, as this can increase the risk of thromboembolic events.
References
- Kanebratt KP, Diczfalusy U, Bäckström T, Sparve E, Bredberg E, et al. (2008) Cytochrome P450 induction by rifampicin in healthy subjects: determination using the Karolinska cocktail and the endogenous CYP3A4 marker 4beta-hydroxycholesterol. Clin Pharmacol Ther 84: 589-594. [Crossref]
- Kaminsky LS, Zhang ZY (1997) Human P450 metabolism of warfarin. Pharmacol Ther 73: 67-74. [Crossref]
- Fahmi AM, Abdelsamad O, Elewa H (2016) Rifampin-warfarin interaction in a mitral valve replacement patient receiving rifampin for infective endocarditis: a case report. SpringerPlus 5: 8. [Crossref]
- Tong EY, Kowalski M, Yip GS, Dooley MJ (2014) Impact of drug interactions when medications are stopped: the often forgotten risks. Med J Aust 200: 345-346. [Crossref]
- Martins MA, Reis AM, Sales MF, Nobre V, Ribeiro DD, et al. (2013) Rifampicin-warfarin interaction leading to macroscopic hematuria: a case report and review of the literature. BMC Pharmacol Toxicol 14: 27. [Crossref]
- Krajewski KC (2010) Inability to achieve a therapeutic INR value while on concurrent warfarin and rifampin. J Clin Pharmacol 50: 710-713. [Crossref]
- Kim KY, Epplen K, Foruhari F, Alexandropoulos H (2007) Update on the interaction of rifampin and warfarin. Prog Cardiovasc Nurs 22: 97-100. [Crossref]
- Lee CR, Thrasher KA (2001) Difficulties in anticoagulation management during coadministration of warfarin and rifampin. Pharmacotherapy 21: 1240-1246. [Crossref]
- Almog S, Martinowitz U, Halkin H, Bank HZ, Farfel Z (1988) Complex interaction of rifampin and warfarin. South Med J 81: 1304-1306. [Crossref]
- Romankiewicz JA, Ehrman M (1975) Rifampin and warfarin: a drug interaction. Ann Intern Med 82: 224-225. [Crossref]
- Holford NH (1986) Clinical pharmacokinetics and pharmacodynamics of warfarin. Understanding the dose-effect relationship. Clin Pharmacokinet 11: 483-504. [Crossref]
- Tie JK, Jin DY, Straight DL, Stafford DW (2011) Functional study of the vitamin K cycle in mammalian cells. Blood 117: 2967-2974. [Crossref]
- Wallin R, Martin LF (1985) Vitamin K-dependent carboxylation and vitamin K metabolism in liver. Effects of warfarin. J Clin Invest 76: 1879-1884. [Crossref]
- Wallin R, Martin LF (1987) Warfarin poisoning and vitamin K antagonism in rat and human liver. Design of a system in vitro that mimics the situation in vivo. Biochem J 241: 389-396. [Crossref]
- Frymoyer A, Shugarts S, Browne M, Wu AH, Frassetto L, et al. (2010) Effect of single-dose rifampin on the pharmacokinetics of warfarin in healthy volunteers. Clin Pharmacol Ther 88: 540-547. [Crossref]