It is widely believed that evolutionarily advanced cells require nuclei rich in DNA to proliferate, while mitochondria isolated from nuclei cannot proliferate. We have developed a novel stable cell line, designated “mitochondrial cells (MitoCells)”, maintaining active mitochondria, the majority of which lacked nuclei. MitoCells can be continuously generated in culture. Herein, we report proliferation studies of MitoCells. We found that the nuclear DNA-less (nDNA-less) MitoCells, which were sorted with flow cytometry and were filtrated with 1.2 μmeter and 3 μmeter isopore membrane filters, could exist and proliferate. We also confirmed that the sorted nDNA-less MitoCells had mitochondrial DNA(mtDNA) with T9176C mutation analysis and that the unsorted MitoCells had SURF-1 gene of nDNA. These results suggest that MitoCells could have prokaryotic nature with both mtDNA and nDNA.
mitochondria, prokaryotes, eukaryotes, Leigh syndrome, mitochondrial cells, nucleus, mitochondria-less cells, mitochondrial DNA, nuclear DNA
The eukaryotes, by definition and in contrast to prokaryotes, have a nucleus, which contains most of the cell’s DNA, enclosed by double layered membranes [1]. The prokaryotes have no nucleus and have few or no organelles. Eukaryotes must have a nucleus and mitochondria in order to exist and proliferate with some exceptions [2-4]. Mitochondria which are isolated from nuclei are believed to be unable to exist or proliferate [5,6]. It is hypothesized that most of the ancestral mitochondrial genome was transferred to the nucleus as the symbiotic relationship between eukaryotes and ancestral mitochondria developed [7-9]. The respiratory chain /oxidative phosphorylation system (OPHOS) has five complexes, the polypeptides of which are encoded by mitochondrial DNA (mtDNA) and/or nuclear DNA (nDNA): only 13 polypeptides are encoded by mtDNA: complex Ⅰ has 7 polypeptides encoded by mtDNA, complex II none, complex III one, complex IV three and complex V two. All other polypeptides of mitochondria are encoded by nDNA. We reported a series of novel stable cell lines, designated “mitochondrial cells (MitoCells)”, derived from cybrids obtained by fusing mitochondria-less HeLa cells with platelets [10,11]. All MitoCells have active mitochondria. The majority of these MitoCells lack nuclei but have a small amount of DNA, while the minority (less than 3 percent) have the same amount of DNA as cells with nuclei (nDNA-rich). We have recently reported that the MitoCells can survive under anaerobic condition and they could produce energy employing an anaerobic metabolic pathway, maintaining the electron transport enzyme activities, but losing the activity of tricarboxylic acid (TCA) cycle by means of mitochondrial enzyme assay and Western blot analyses [12]. This report suggests that energy production of MitoCells is far from the original cybrid cells which are eukaryote, although the MitoCells have enough polypeptides encoded by mtDNA and nDNA for maintaining their lives. Although most MitoCells have no nuclei, they can be continuously generated in culture. Therefore, it is important to know the feature of the nuclear DNA-less (nDNA-less) MitoCells, which do not possess nucleus. Herein, we assessed the proliferation study and mtDNA analysis of the nDNA-less MitoCells,
MitoCell lines were obtained by transformation of cybrids derived by fusing mitochondria-less HeLa cells with platelets from Leigh syndrome patients and controls. The MitoCells from patients with Leigh syndrome, a subtype of mitochondrial encephalomyopathy, contain a pathogenic point mutation, T9176C, in their mtDNA [13-15]. Our cell lines #1 and #2 were derived from heteroplasmic T9176C mutant cybrids, while cell line #3 represents wild type homoplasmy from control cybrids. The methods for establishment and culture of cell lines were described in detail in previous subscripts [10,11].
MitoCell proliferation analysis with flow cytometer
Sorting of MitoCell by flow cytometry: Two samples were taken from each MitoCell line. After adding 1 μM SYTO Green (Syto 16) (Molecular Probes, Inc. Eugene OR), the samples were left standing for 15 minutes. SYTO Green is a fluorescent dye that stains nucleic acids even in live cells [15]. The samples were gated and sorted by flow cytometry (Epics ALTRATM HyperSortTM, Beckman Coulter Inc., Miami, FL). The SYTO Green intensity range of the nucleus was defined based on the control cybrid data.
Culture of the sorted cells and cell count: The sorted MitoCells, (nDNA-less MitoCells) were cultured in fresh RPMI 1640 medium supplemented with 10% FBS at 37°C in a humidified gas mixture containing 8% CO2. The control cybrids were cultured under the same conditions but in DMEM medium instead of RPMI after the exposure to SYTO Green. The number of cells of each type was counted at 40× magnification using the trypan blue dye-exclusion test every two weeks.
MitoCell proliferation analysis with isopore membrane filters: In order to eliminate the MitoCells, which contain rich nDNA as nucleus, the MitoCells (#2) were filtrated through 1.2 μm and 3 μm isopore track-etched membrane filters (Millipore, Japan). The filtrated MitoCells were cultured in RPMI 1640 medium with 10% FBS at 37°C in a humidified gas mixture containing 8% CO2. The cell proliferation was observed with microscopy every week until the 6th week.
DNA analyses
T9176C mutation analysis of mtDNA: Genomic DNA extraction from the MitoCells was performed by a previously described method [16,17]. The MitoCell line samples were designated #2 and #3 before sorting and #2 and #3 for those with nDNA-rich and nDNA-less (with and without nuclear-sized DNA) after sorting, respectively. Absence or presence of the T9176C mutation was confirmed by PCR-RFLP analysis as previously described [10]. We amplified a 178-bp fragment of mtDNA encompassing the mutation using oligonucleotide primers 5’-GGCCACCTACTCATGCACCTAA-3’, corresponding to mtDNA positions 9025-9046 (forward), and 5’-GTGTTGTCGTGCAGGTAGAGGCTTCCT-3’, corresponding to nucleotides 9203-9177 (reverse), with a T-to-C mismatch at nucleotide 9179, 3 bp from the 3’ end of the primer.
Analysis of SURF-1 gene of nuclear DNA
The MitoCell line sample was #1, which was obtained before sorting of MitoCells. Exons 3 and 4 of the SURF-1 gene were analyzed. The oligonucleotide primer pairs for the first PCR were 5’-TTCGAGGGCTTCTGGCTCCA-3’ (forward), and 5’-AAGTAAAACAGGCCCTAGG-3’ (reverse) [18]. The PCR conditions were incubation at 94°C for 5 minutes, followed by 35 cycles of 94°C for 30 seconds, 64°C for 30 seconds and 72°C for 30 seconds. The PCR product was electrophoresed through 2% agarose gel and stained with ethidium bromide.
Definition of the SYTO Green intensity range of the nucleus
To study proliferation, we sorted the MitoCells using flow cytometry. Initially, the intensity range of the nucleus was defined flow cytometrically by measuring control cybrids with SYTO Green (SYTO16). (Figure 1a and 1b). The control cybrids showed two intensity peaks, corresponding to the G1 and G2 stages of the cell cycle. We defined the intensity range of the nucleus as falling between these two peaks. We sorted the MitoCell lines according to this definition.
Sorting of MitoCells by flow cytometry
Secondary, the MitoCells lines (#2) and (#3) were gated as in Figures 1-(c) and -(e). Next, we sorted the gated cells into those with a nuclear DNA area (D in figures 1-(d) and (f)) and those without a nuclear area (E in Figures 2-(d) and (f)). Of the cells in #2 and #3, 1.42% and 0.56% were in area D, while 98.00% and 99.14% were in area E, respectively. The sorted cells were collected. There were 5,000 #2-D cells (nDNA-rich MitoCells), 200,000 #2-E cells (nDNA-less MitoCells), 200 #3-D cells (nDNA-rich MitoCells) and 70,000 #3-E cells (nDNA-less MitoCells). The data confirmed our previous findings that only 3% or less of MitoCells have nuclear-sized DNA (nDNA-rich), while more than 97% lack nuclear-sized DNA (nDNA-less) [10].
Figure 1. (a, b). Definition of the intensity range of the nucleus with SYTO Green. The control cybrids were used for flow cytometry with SYTO Green (SYTO16). Left: the vertical axis represents the intracellular peak intensity of Syto16, the horizontal axis the intracellular average intensity of Syto16. Right: the cybrids of gated area H. The vertical axis shows the number of cybrid cells, the horizontal axis the intracellular average intensity of Syto16. The cybrid intensity had two peaks, corresponding to the G1 and G2 stages of the cell cycle. We defined the range of the nucleus as being between the two peaks.
(c, d, e and f): Gating of nuclear-less DNA area for mitoCells. MitoCell type (#2) (a, b), and (#3) (c, d), are shown. The vertical and horizontal axes are the same as in figure 1-a. Areas H in figures (c) and (e) were gated in figures (d) and (f). Areas D and E were gated according to the amount of DNA: area D is nuclear-sized DNA, while area E represents a small amount of nDNA. The majority of mitoCells were in area E.
Cell counts
Sorted MitoCells culture and cell counts were performed to examine proliferation activities. None of the sorted MitoCells showed massive cell-death, and continuous growth was seen in all populations. The cell count revealed slow proliferation until the 14th day followed by relatively rapid proliferation between the 14th and 35th days in all cell lines (Figure 2a). The nDNA-rich MitoCell lines (nuclear-sized DNA) were #2(+) and #3(+). They proliferated faster than the nDNA-less MitoCell lines, (#2(-) and #3(-)): The ratio of the maximum cell number against the initial cell number was 25 in #2(+) and 14 in #3(+), while #2(-) and #3(-) both had a ratio of four (Figure 2a and 2b). The results of the proliferation study indicate that proliferation occurs not only in nDNA-rich MitoCells but also in nDNA-less MitoCells.
Figure 2. Proliferation of sorted MitoCells. (a) The average cell number was counted using the trypan blue dye exclusion test. (+): nDNA-rich MitoCells which possess nuclear-sized DNA and (-): nDNA-less MitoCells which lose nuclear-sized DNA. (b) Marked proliferation was observed in the sorted MitoCells (nDNA-less MitoCells).
MitoCell proliferation analysis with isopore membrane filter
The 1.2 μm and 3 μm isopore track-etched membranes must block nucleus, because nuclear size of the cybrids are about 5-10 μm. In the cell line filtrated through 1.2 μm isopore membrane filter, mitochondrial cells emerged on the 6th week, while in the cell line filtrated through 3 μm isopore membrane filter, mitochondrial cells emerged from the 3th week (Figure 3).
Figure 3. Proliferation of MitoCells after filtrating through 1.2μm and 3μm isopore membrane filter.
T9176C mutation of mtDNA in sorted and cultured nDNA-less MitoCells
We detected T9176C mutation of mtDNA in MitoCells using polymerase chain reaction-restriction fragment length polymorphism (PCR-RFLP) analysis. Prior to sorting, MitoCells were all wild type and had 178-bp-amplified fragments not cut by ScrfI (Figure 4a). The MitoCells obtained by sorting and culturing were also all wild type. They included MitoCells both with and without nuclear-sized DNA. These results confirmed the stability of mtDNA in these cells throughout the sorting and culturing procedures (Figure 4a and 4b).
Analysis of SURF-1 gene of nuclear DNA
PCR of exons 3 and 42021 Copyright OAT. All rights reserva 380-bp fragment in all MitoCells lanes. The amounts of PCR products varied (Figure 4c).
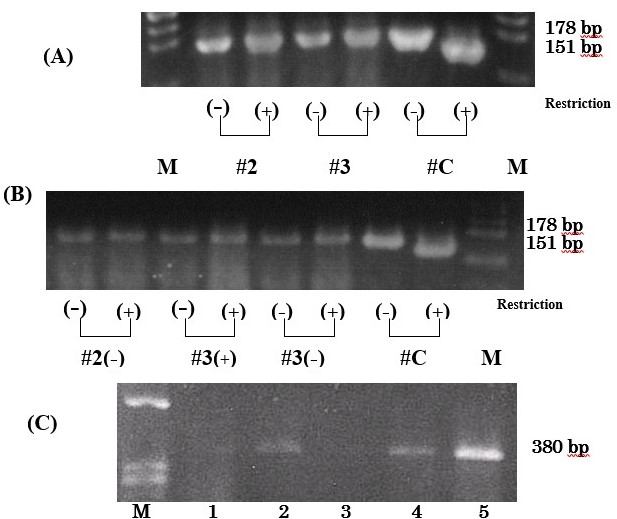
Figure 4. Polymerase chain reaction (PCR) for mtDNA and nDNA in MitoCells. (A and B): Polymerase chain reaction restriction fragment length analysis (PCR-RFLP) before and after sorting and culturing. #2 and #3 represent MitoCell line and #C the positive control from cybrids. Lane M is a size marker for ψ174/Hind Ⅲ. (+) nDNA-rich MitoCells which had nuclear-sized DNA and (-)nDNA-less MitoCells which lose nuclear-sized DNA.. (A): MitoCell lines before sorting. The 178-bp-amplified fragments of #2 and #3 were not cut by ScrfI, while that of #C was cut into fragments of 151 and 27 bp (27 bp fragment not shown). (B): MitoCells after sorting and culturing. The 178-bp-amplified fragments of #2(-), #3(+) and #3(-) were not cut. (C): The PCR products of exon 3 and 4 of SURF-1 nuclear gene. Lanes 1-5 were the cell lines of #1( #1-13, 1-15, 1-18, 1-20 and 1-22). Lane M is a size marker. The fragment size is 380 bp.
A recent study comparing between mitochondria and α-proteobacteria identified many genomic similarities, strongly supporting the view that mitochondria, the energy-generating organelles of eukaryotes, were once free-living bacteria [9]. It is widely hypothesized that about 2 billion years have passed since free living α-proteobacteria developed a beneficial (symbiotic) relationship with their hosts (eukaryotes). As most of the mitochondrial genome was transferred to the nucleus during evolution, the mitochondria became permanent passengers [5,6]. No one believed that mitochondria were able to proliferate independently, when isolated from nuclei. Our proliferation studies of MitoCells using flow cytometry and isopore membrane filters demonstrated that they could exist and proliferate without nuclei, suggesting that MitoCells have prokaryotic nature (Figure 2 and 3). MitoCells are derived from cybrids obtained by fusing mitochondria-less HeLa cells with platelets [10,16]. The cybrids are eukaryotes possessing nuclei, i.e., they are evolutionarily advanced cells. However, during the transformation from cybrids into MitoCells, they become prokaryotic, thus they became less developed from an evolutionary standpoint.
Guy and his colleagues found that complementation with allotropic expression of a normal ND4 gene can reverse the severe deficiency of oxidative phosphorylation which occurs in the presence of a G11778A mutation, causing Leber hereditary optic neuropathy (LHON) [19-22]. Their results suggest that mtDNA genes in the nucleus can function effectively in mitochondria.
We have recently reported that the MitoCells can survive under anaerobic condition and they could produce energy employing an anaerobic metabolic pathway. Mitochondrial enzyme assays revealed comparable activities of complex II+III and IV in the MitoCells with these in the cybrids, while citrate synthase activity was lost. All subunits of complex II are encoded by nDNA, and subunits of complex III and complex IV are encoded both by mtDNA and nDNA [12].
These DNA studies confirmed that the sorted nDNA-less MitoCells had mtDNA with T9176C mutation analysis and that the unsorted MitoCells had SURF-1 gene of nDNA. The SURF-1 gene is located in chromosome 9q34. Since mutations of the SURF-1 gene cause Leigh syndrome with complex IV (cytochrome c oxidase) deficiency [23,24]. SURF-1 assembles complex IV subunits and maintain complex IV activity.
These results suggest that respiratory chain/oxidative phosphorylation system of MitoCells is effectively encoded both by mtDNA and nDNA, while MitoCells could be prokaryotic. We speculate that some important nuclear genes including SURF-1 and nDNA of complex II and complex III may be systematically or functionally transported from the nucleus to MitoCells in the process of cellular transformation from cybrid cells to MitoCells.
We thank Professor Shigeo Ota, Professor Ikuroh Ohsawa (Dept. of Biochemistry and Cell Biology, Institute of Gerontology, Nippon Medical School) and Dr. Yujiro Shitara (Dept. of Pathology, TWMU) for their advice. We also thank to Mr. Yasuhiko Nagasaka (Beckman Coulter Inc.) for his technical assistance with the flow cytometry, and Ms Yumiko Kaneko and Ms Rieko Takahashi (Dept. of Pediatrics, TWMU) for their technical support. This work was supported in part by T. Satake scholarship foundation and in part by grant #14-Syouni-006, Clinical Research for Evidence Based Medicine, from the Ministry of Health, Labor and Welfare, Japan. This work was also supported by Grants-in-Aid of the Research on Intractable Diseases (Mitochondrial Disorder) from the Ministry of Health, Labour and Welfare of Japan.
None
- Kostianovsky M (2000) Evolutionary origin of eukaryotic cells. Ultrastruct Pathol 24: 59-66. [Crossref]
- Embley TM, Giezen VD, Horner DS, Dyal PL, Foster P (2003) Mitochondrial and hydrogenosomes are two forms of the same fundamental organelle. Philos. Trans. R. Soc. Lond. B: Biol Sci 35: 191-202.
- Cavalier-Smith T (1987) Eukaryotes with no mitochondria. Nature 326: 332-333. [Crossref]
- Kabnick KS, Peattie DA, Giarda (1991) A missing link between prokaryotes and eukaryotes. American Scientist 79: 34-43.
- Martin W (2000) Perspectives: evolutionary biology. A powerhouse divided. Science 287: 1219. [Crossref]
- Feng DF, Cho G, Doolittle RF (1997) Determining divergence times with a protein clock: update and reevaluation. Proc Natl Acad Sci U S A 94: 13028-13033. [Crossref]
- Grafen A, Haig D, Hurst L, Szostak J (1994) The Evolution of the Cell, in: R. Alberts, D. Bray, J. Lewis, M. Raff, K. Roberts, J.D. Watson (Ed.), Molecular Biology of the Cell. Third ed. Garland Publishing, Inc. New York, 17-24.
- Gray MW (1989) The evolutionary origins of organelles. Trends Genet 5: 294-299. [Crossref]
- Gray MW, Burger G, Lang BF (1999) Mitochondrial evolution. Science 283: 1476-1481. [Crossref]
- Nakano K, Ohsawa I, Yamagata K, Nakayama T, Sasaki K, M. Tarashima (2003) Continuous Culture of Novel Mitochondrial Cells Lacking Nuclei. Mitochondrion 3: 21-27.
- Nakano K, Osawa M (2008) Mitochondria and cell death. Journal of Clinical and Experimental medicine 225: 501-506
- Shirato Y, Nakano K, Nakayama T, Osawa M (2013) TCA cycle enzymes in mitochondrial cells (MitoCells). J Tokyo Wom Med Univ 83: E91-E97
- Makino M, Horai S, Goto YI, Nonaka I (1998) Confirmation that T-to-C mutation at 9176 in mitochondrial DNA is an additional candidate mutation for Leigh’s syndrome. Neuromusc Dis 8: 149-151.
- Nakano K, Nakayama, Sasaki K, Osawa M (1999) Clinical characteristics of acute aggravation in Leigh syndrome with T9176C mutation of mitochondrial ATPase 6 gene. Japanese Journal of Inherited Metabolic Diseases 15: 217.
- Tarashima M, Nakano K, Ono Y, Shibata N, Osawa M (2013) A subtype classification for Leigh syndrome based on successive changes on brain MRI findings. J Tokyo Wom Med Univ 83: E74-E89.
- King MP, Attardi G (1996) Mitochondria-mediated transformation of human rho0 cells, In: G.M. Attardi, A. Chomyn, (ed). Mitochondrial Biogenesis and Genetics, San Diego: Academic Press 264: 313-334.
- Gu M, Cooper JM, Taanman JW, Schapira AH (1998) Mitochondrial DNA transmission of the mitochondrial defect in Parkinson's disease. Ann Neurol 44: 177-186. [Crossref]
- Frey T (1995) Nucleic acid dyes for detection of apoptosis in live cells. Cytometry 21: 265-274. [Crossref]
- Sambrook J, Fritsch EF, Maniatis T (1989) Isolation of DNA from mammalian cells, protocol. In: Molecular Cloning, A laboratory manual, 2nd eds. Cold Spring Harbor Laboratory, New York, 9: 16-9.23.
- Tiranti V, Hoertnagel K, Carrozzo R, Galimberti C, Munaro M (1998) Mutations of SURF-1 in Leigh disease associated with cytochrome c oxidase deficiency. Am J Hum Genet 63: 1609-1621.
- Guy J, Qi X, Pallotti F, Schon EA, Manfredi G, Martinuzzi A, et al. (2002) Rescue of a mitochondrial deficiency causing Leber Hereditary Optic Neuropathy. Ann Neurol 52: 534-542.
- Larsson NG (2002) Leber hereditary optic neuropathy: a nuclear solution of a mitochondrial problem. Ann Neurol 52: 529-530. [Crossref]
- Zhu Z, Yao J, Johns T, Fu K, De Bie I, et al. (1998) SURF1, encoding a factor involved in the biogenesis of cytochrome c oxidase, is mutated in Leigh syndrome. Nat Genet 20: 337-343. [Crossref]
- Tiranti V, Hoertnagel K, Carrozzo R, Galimberti C, Munaro M, Granatiero M, et al. (1998) Mutations of SURF-1 in Leigh disease associated with cytochrome c oxidase deficiency. Am J Hum Genet 63: 1609-1621.