Abstract
Microorganism plate count method is widely used in food and medicine industry, and is often used to determine the survival and proliferation of bacteria. The number of colonies in a culture is counted to calculate the concentration of bacteria in the original broth under specific conditions; however, manual counting can be time consuming and imprecise, derived from the human eyestrain. To contribute to the improvement of laboratory test methodologies, a cylindrical shape prototype was developed for automatic counting of bacterial colonies by applying digital image processing. The images of the colonies cultivated in petri dishes (PD) were recorded through a commercial CCD, and then processed with Scilab open source software. The results showed a linear relation between the manual and automatic method with a  and a correlation coefficient of 0.994. The effectiveness of the proposed system was compared with verified manual counts at different light intensities, as well as to the use of two open source softwares. Results showed better reliability in counting these bacterial strains compared with visual counting. The main benefit of using a device with these features is to obtain counts in the shortest time possible. Moreover, the variation of the counts shows that the automated systems are more consistent than the manual counts.A
Key words
colony count, bacterial colonies, colony former units, food industry, image processing
Introduction
Microbiological techniques in the food sector are often directed to the detection of microorganisms as indicators of potential pathogens or spoilage. One of these indicators is the total mesophilic bacterium, which represent the largest group of indicators of food quality. This group, in turn, is defined as a heterogeneous group of bacteria able to grow in temperatures ranging between 15 and 45 °C [1-3]. The most commonly used technique for microorganism detection is the plate count, which is based upon the growth of colonies of microorganisms developed into an inoculated solid culture medium. These colonies grow large enough to be observed and counted by different techniques, allowing the determination of the number of colony forming units (CFU) [2,4-8]. Today, microbiology laboratories continue using counts by manual technique, resulting in visual and mental fatigue in people who attend to these analysis tasks, being susceptible to errors caused by fatigue and stress [9,10].
The Food and Drug Administration (FDA) recommends for a proper count to have between 25 and 250 colonies in a conventional plate [11]. Numerous methodologies have been proposed for counting bacterium colonies to optimize time and accuracy of the recordings [12-15].
Image processing has been one of the alternative methods used by different researchers to solve specific problems, such as counting mammalian cell colonies [16,17], monitoring the growth of cancer cells [14], quantification of bacterial cells from microscope images [18], and other studies in which the aim is to reduce the time of analysis [19,20]. The correct integration and application of a set of mathematical algorithms, thresholds at binarization, boundary selection, filters, distance transforms, labelling objects, segmentation, pattern recognition among others, can generate a technique capable of modifying a digital image to extract information from a region of interest for a very specific purpose [21-29].
Some software applications have also been used for image processing to perform bacterial counts in less time avoiding inconsistent results. Open source software such as NICE (NIST's Integrated Colony Enumerator) and Open CFU have also been used for counting bacterial colonies [30-32].
In this work a cylindrical prototype is presented for bacterial colony counting by using digital image processing algorithms implemented on open source codes.
Materials and methods
The system proposed is an automatic instrument assembled in aluminum case, which allows evaluating PD individually. The prototype design and all parts that make it up are shown in Figure 1, this includes a commercial CCD LifeCam VX-1000, like those used in other studies based on artificial vision [33-34], which is located vertically above the plate. A circular LED array (set of 190 LEDs) is used as the light source for sample illumination that is located below the PD, opposite to the CCD.
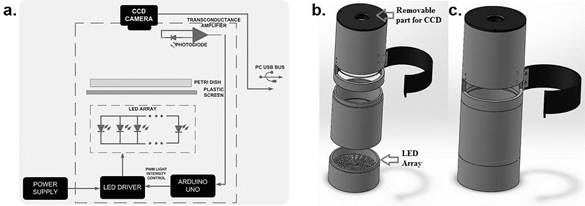
Figure 1. Setup for the colony counter.
a. Block diagram of proposed instrument,
b. Isometric view of the apparatus in several metal sections,
c. Schematic view of the apparatus with all metal sections assembled.
The intensity of the light is stabilized using a feedback control scheme implemented with an Arduino UNO board. The amplifier generates a voltage signal, which is proportional to the light intensity to be controlled, and is sent to an analog input of the Arduino board. The microcontroller embedded in it converts a voltage signal to a digital value which is compared with a set point value and by executing a Proportional-Integral control algorithm, a pulse width modulation signal (PWM) is generated to command the LED driver for current supply manage of light source. A diffuser light filter was placed as a base support of the PD to homogenize the light intensity over the area of interest. A photometric light sensor (KDS-1033) with 12-bit resolution was used to characterize illumination inside bacterial cultures. The maximum intensity of light measured inside the instrument was 114.7 lux.
Three samples of 1 g of meat and dairy food were taken, based on the standard FDA procedure (NOM-109-SSA1-1994, which specifies the procedures for collecting, transporting, and handling food samples for microbiological analysis). Samples of meat and dairy were cultured for one day into 10 ml of standard liquid medium and subsequently into five serial dilutions (NOM-110-SSA1-1994, Sample preparation and dilution of food for microbiological analysis). 30 μL of each dilution was used to inoculate a total of 32 PD with solid standard agar medium and incubated at 38 °C for two days (NOM-092-SSA1-1994, Method for the count of aerobic bacteria in plate) [1,11].
To verify the effectiveness of the instrument, two groups of 16 samples were evaluated as follows: the first group was evaluated once by manual counting and once again with the automatic instrument using just one image taken at a fixed position; the second group was evaluated three times by three different individuals, by manual counting and by the automated electronic instrument. In the second evaluation, the three images were recorded at different positions for each of the PD inoculated, this to verify robustness of instrument respect to position of PD. A total of 32 samples of CFU were evaluated by manual counting and by the proposed method.
Finally, a group of five samples of colonies were prepared following the same protocol for bacterial culture to verify the performance of the proposed system. For each sample, three images at different illumination intensities (16, 54 and 85 lux) were recorded. Fifteen images were processed using the proposed system and count results were compared to manual count results as well as to the automated counts like NICE and Open CFU software.
Image theory
Image analysis has become one of the most versatile tools for a wide range of applications. When a better contrast and more reliable results are needed, controlling the lighting and the background correction of the images are two of the key points in image processing. Therefore, a background correction was the first task to address. Evaluating the surface of the background image performs the correction, and then the background of the inoculated Petri dish image is subtracted (See Figure 2).
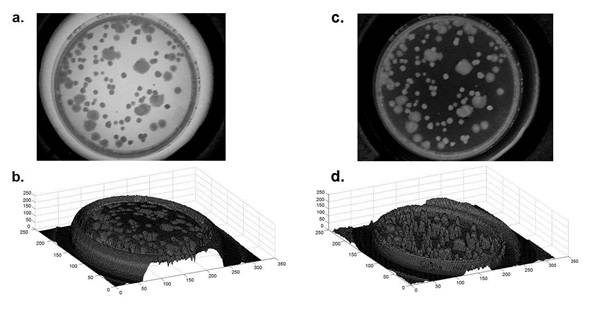
Figure 2. Background correction on the source images.
a) Image source selected inside to the PD with typical total aerobic mesophilic P (x, y),
b) Surface image of the source image,
c) Image correction J(x, y),
d) Superficial view of the colonies.
 (1)
(1)
The PD edge detection was taken out by binarization function B (x,y ) in order to obtain the threshold based on the average value (μT) in the histogram of the image J (x,y) [35-38], see Eq. (2).
 (2)
(2)
Subsequently, edge detection gradient, Eq. (3), was applied based in highlighting the differences in the image through the first derivative in the x and y-axis. This gradient at a given point (x, y), refers to the maximum variation of the function at the indicated point. This process was developed to discard the outer contours and extract the region of interest (Figure 3).
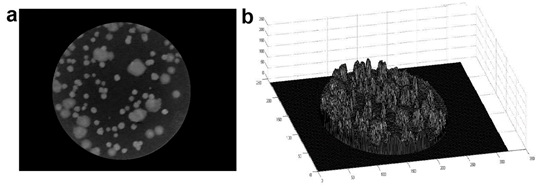
Figure 3. Region of interest selected.
a) Image selected inside to the PD with typical whole aerobic mesophilic and edge detection by gradient algorithm,
b) Superficial view of the colonies.
 (3)
(3)
The section of interest has been extracted as shown in figure 3a, in which a transform was applied on the distance metric described by Calvinet al., [39]. A new binary image was obtained by applying Eq. (2) to separate the merged colonies. The distance transform is an algorithm applied in the recognition of objects in relation to their location and position in the image of interest, that is, they are presented with the same perspective, the same position, without inversion, without rotation, without scaling and with similar sizes. With this algorithm, a metric is obtained of the separation between each of the pixels with respect to the reference pixel located in a template as a subset of pixels of the image. To obtain the final bacterial count (see Figure 4, the coordinates of the pixels that compose the different objects are verified and the average of the coordinates in x (cx) and the average in the coordinates in y (cy) are obtained to place the centroid in each region of interest (bacterial colony).
 (4)
(4)
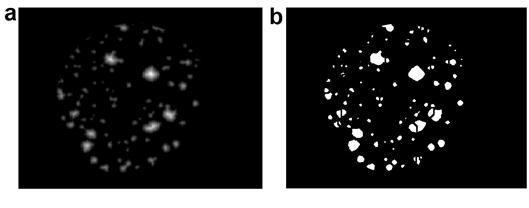
Figure 4. Region of interest for separation of colony counts.
a) Image corrected with distance transform.
b) Binary image obtained after the application of the distance transform.
The binary image was analyzed from left to right, top to bottom. Inspection of neighboring pixels is done by reference to a pixel of adjacency q, and with respect to the coordinates of four neighboring pixels (Eq. 5) or coordinates of eigh neighboring pixels (Eq.6).
 (5)
(5)
 (6)
(6)
Thus, each coordinate identified as the center of mass (cx, cy) of each group of neighboring pixels is associated with the number of bacterial colonies present in the image acquired by the LifeCam VX-1000 CCD.
Finally, to fill holes and connect neighboring objects, a dilation operation on the image was applied per Eq. (7). Figure 5 shows each labelled bacterial strain through a circular centre point of each bacterial colony, Therefore, each hole is in each bacterium gives the certainty of each bacterium that is counted.
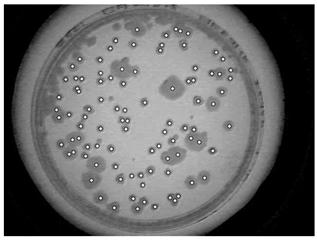
Figure 5. Labelling of bacterial colonies with the centroid located in each colony.

(7)
Images acquired by USB peripheral were subjected to digital processing with the open source software, Scilab (version 5.5.2 for 32-bit windows).
Results and discussion
The complete prototype proposed includes a power supply, the cylindrical device with the CCD sensor, a base support for the PD and the lighting array.
Controlled lighting conditions within the proposed system fit linearly with the current supply. This guarantees that the illumination intensity can be determined directly from the current supply of the LED array.
Comparisons were made between colony counts obtained from our automatic colony counter, manual counts from three skilled personnel, and from two open source software for bacterial counts (NICE and OpenCFU). Figure 6 shows a first comparison of the results obtained by the proposed image technique and the manual count in the same experiment. The mean value of the average absolute deviation was 2.94.
The results obtained from the image technique compared to the manual count in a second experiment are shown in Figure 7. The linearity between the two methods was evaluated; the comparison of the automated method with the results of the manual counting produced a correlation coefficient of 0.994. The mean value of the absolute deviation of the counts was 2.126. (See Figure 8).
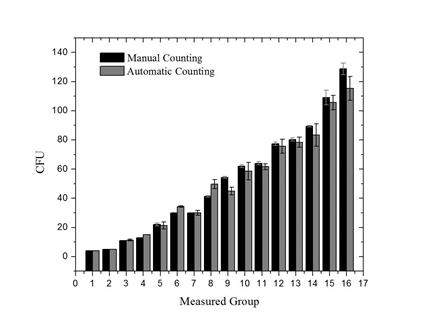
Figure 6. Data obtained from single manual counting (black) and using the instrument for automatic counting (gray) in one position of the PD.
Each point represents the mean number of colonies counted by both methods.
Five samples were tested at different light intensities, to compare the results (Table 1) obtained by Open CFU, NICE software, and the proposed system
Finally, the behavior in manual counting for the proposed system and the other two counting systems per different light intensities used to acquire the images can be seen in figure 9. It can be verified that the proposed system has a better response (better agreement with manual counts) when image recording is performed with 85 lux, which is equivalent to 198 mA supplied to the LED array. Both software (NICE and Open CFU) require a region of interest to be selected.
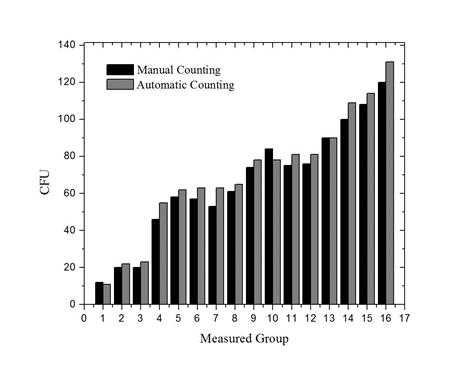
Figure 7. Average data obtained from three different measurements made visually (manual counting) and using the instrument based on automatic counting in three different positions of the PD.
Figure 8. Evaluation process of the 16 inoculated PD samples: Correlation between automated counting vs. manual counting
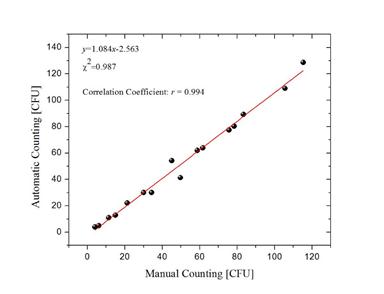
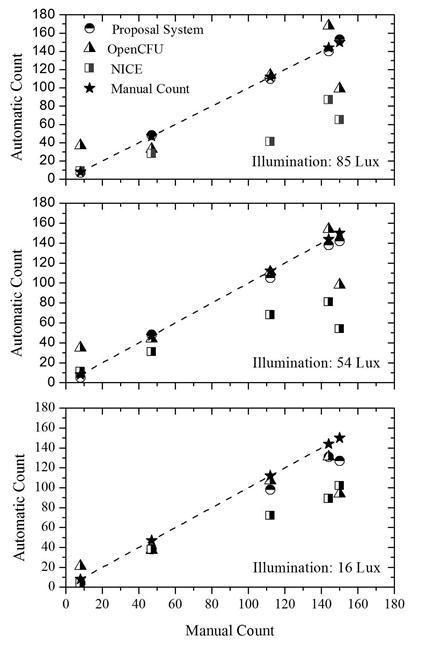
Figure 9. Comparison between the techniques of bacterial counts for the five PD tested at 85, 54 and 16 lux: Automatic counts (Open CFU, NICE and the proposed system) and manual counts.
Table 1. Comparison of results using different techniques: Manual count, Open CFU, NICE and the proposed system.
PD |
L [lux] |
Counting Methods |
Manual |
Open CFU |
NICE |
Proposal system |
1 |
16 |
8 |
21 |
4 |
4 |
1 |
54 |
8 |
35 |
11 |
5 |
1 |
85 |
8 |
37 |
9 |
7 |
2 |
16 |
47 |
37 |
38 |
38 |
2 |
54 |
47 |
44 |
31 |
48 |
2 |
85 |
47 |
33 |
28 |
48 |
3 |
16 |
112 |
107 |
72 |
98 |
3 |
54 |
112 |
111 |
68 |
105 |
3 |
85 |
112 |
114 |
41 |
110 |
4 |
16 |
144 |
131 |
89 |
131 |
4 |
54 |
144 |
154 |
81 |
138 |
4 |
85 |
144 |
168 |
87 |
140 |
5 |
16 |
150 |
94 |
102 |
127 |
5 |
54 |
2021 Copyright OAT. All rights reserv
150 |
98 |
54 |
142 |
5 |
85 |
150 |
99 |
65 |
153 |
Conclusion
CFU determination is used in assessing food studies and in bacterial vaccines among other applications. A methodology and prototype to make CFU determination more accurate and time efficient was tested. Results show that the automated colony counter device can produce in vivo measurements consistent with manual counters for bacterial colonies. Moreover, the comparison of the proposed instrument with other available software platforms demonstrated more accurate results about manual counting; additionally, illumination intensity on PD does not significantly affect accuracy. An advantage of the automated colony counter system described here is that CFUs can be counted without having to use a specific marker to highlight each colony. After counting, colonies can continue their growth process and be used for further experiments. This proposed software can be implemented by users per their individual needs (other organisms, other growth mediums, etc.).
It was found that the correlation coefficient r = 0.994 and average absolute deviation of 2.1, represent a 3.5% improvement to other image processing techniques. The average time to process PD samples using the automated colony counter was approximately 20 seconds per PD sample, including the time taken to manually place and remove the PD from the automatic counter (this could also be automated). Hence, an instrument such as the proposed optimizes counting tasks and reduces eyestrain for the person carrying out large-scale counts. Finally, the authors declare that there is no conflict of interest about this study and preparation of manuscript.
Acknowledgments
Authors thank to the Instituto Politecnico Nacional-SIP under grant number 20120751 and Universidad de Guanajuato-DAIP 2015/59023 for partial support. We also thank Ma. Lizette Gonzalez-Marquez for the graphic design of the experimental arrangement and AL Proof-Reading Services for the English review of the manuscript.
References
- Araujo AF, Gutierrez AT, Mariezcurrena MD, Mariezcurrena MA, Pinzón DL, et al (2015) Evaluation Of Physico-Chemical And Microbiological Quality Of Sheep Meat In The Central Highlands Of Mexico. Life Science Journal 12: 51-56.
- Rosimini MR, Signorini ML, Schneider R, Bonazza JC (2003) Food Control 15: 39.
- Revelli GT, Sbodio OA, Tercero EJ (2004), Revista Argentina De Microbiología 36: 145.
- Madigan MT, Martinko JM, Stahl D, Clark D (2010) Brock Biology of Microorganisms. Benjamin cummings San Francisco CA USA.
- Singleton P (2004) Bacteria in Biology, Biotechnology and medicine. John Wiley & Sons Ltd West Sussex England.
- Ronald MA, Lawrence CP (1995) Microorganisms in Our World Lab Manual. Mosby Frederick M D USA.
- Putman M, Burton R, Nahm MH (2005) Simplified method to automatically count bacterial colony forming unit. J Immunol Methods 302: 99-102. [Crossref]
- Blackburn N, Hagstrom A, Wikner J, Cuadros-Hansson R, Bjornsen PK (1998) Rapid determination of bacterial abundance, biovolume, morphology, and growth by neural network-based image analysis Appl Environ Microbiol 64: 3246-3255. [Crossref]
- Dahle J, Kakar M, Steen HB, Kaalhus O (2004) Automated counting of mammalian cell colonies by means of a flat bed scanner and image processing. Cytometry A 60: 182-188. [Crossref]
- Alvarez LJ, Thomen P, Makushok T, Chatenay D (2007) Propagation of fluorescent viruses in growing plaques. Biotechnol Bioeng 96: 615-621. [Crossref]
- Larry M, Peeler JT (2001) BAM: Aerobic Plate Count. U.S. Food and Drug Administration, FDA.
- Biesta-Peters EG, Reij MW, Joosten H, Gorris LG, Zwietering MH (2010) Comparison of two optical-density-based methods and a plate count method for estimation of growth parameters of Bacillus cereus. Appl Environ Microbiol 76: 1399-1405. [Crossref]
- Dalgaard P, Koutsoumanis K (2001) Comparison of maximum specific growth rates and lag times estimated from absorbance and viable count data by different mathematical models. J Microbiol Methods 43: 183-196. [Crossref]
- Swinnen IA, Bernaerts K, Dens EJ, Geeraerd AH, Van Impe JF (2004) Predictive modelling of the microbial lag phase: a review. Int J Food Microbiol 94: 137-159. [Crossref]
- Silvio DB, Christian B, Marcel J, Werner J, Urs B, et al. (2012) PLoS ONE 7: e33695.
- Bernard R, Kanduser M, Pernus F (2001) Model-based automated detection of mammalian cell colonies. Phys Med Biol 46: 3061-3072. [Crossref]
- Barber PR, Vojnovic B, Kelly J, Mayes CR, Boulton P, et al. (2001) Automated counting of mammalian cell colonies. Phys Med Biol 46: 63-76. [Crossref]
- Niyazi M, Niyazi I, Belka C (2007) Counting colonies of clonogenic assays by using densitometric software. Radiat Oncol 2: 4. [Crossref]
- Selinummi J, Seppälä J, Yli-Harja O, Puhakka JA (2005) Software for quantification of labeled bacteria from digital microscope images by automated image analysis. Biotechniques 39: 859-863. [Crossref]
- Buzalewicz I, Wysocka-Król K, Podbielska H (2010) Image processing guided analysis for estimation of bacteria colonies number by means of optical transforms. Opt Express 18: 12992-13005. [Crossref]
- Zhang C, Chen W, Liu W, Chen C (2008) An Automated bacterial colony counting system IEEE International Conference on Sensor Networks Ubiquitous, and Trustworthy Computing, Taichung, Taiwan.
- Amadasun M, King RA (1998) Pattern Recognition. 21: 261-268.
- Dzung LP, Chenyang X, Jerry LP, (2000) Annual Review of Biomedical Engineering. 2: 315-337.
- Lin X, Chen S (2001) Color image segmentation using modified HSI system for road followin, Proc. IEEE Conf. on Robotics and Automation, Sacramento, California.
- Celenk M (1988) A recursive clustering technique for color picture segmentation Proc. Int. Conf. on Computer Vision and Pattern Recognition, Ann Arbor MI. USA.
- Meyer F (1992) Color image segmentation Proc. IEE Int. Conf. on Image Processing and its Applications, Maastricht, Netherlands.
- Schettini R, (1992) Pattern Recognition Letters 14: 499-506.
- Cheng HD, Jiang XH, Sun Y, Wang J, (2001) Pattern Recognition 34: 2259-2281.
- Ryszard SC, Tomasz A, Michal C, (2007) Pattern Analysis and Applications. PAA 10: 333-343.
- Chiang PJ, Tseng MJ, He ZS1, Li CH (2015) Automated counting of bacterial colonies by image analysis. J Microbiol Methods 108: 74-82. [Crossref]
- Geissmann Q (2013) OpenCFU, a new free and open-source software to count cell colonies and other circular objects. PLoS One 8: e54072. [Crossref]
- Clarke ML, Burton RL, Hill AN, Litorja M, Nahm MH, et al. (2010) Low-cost, high-throughput, automated counting of bacterial colonies. Cytometry A 77: 790-797. [Crossref]
- Lee D, Lee S, (2011) ETRI Journal 33: 415-422.
- Ahn KU, Park CS, (2016) 116: 420-433.
- Huntsberger TL, Descalzi MF, (1985) Pattern Recognition Letters 3: 205-209.
- Sahoo PK, Soltani S, (1988) Wong AK. graphics, and image processing 41: 233-260.
- Tobias OJ, Seara R (2002) Image segmentation by histogram thresholding using fuzzy sets. IEEE Trans Image Process 11: 1457-1465. [Crossref]
- Blodgett RJ (2008) Mathematical treatment of plates with colony counts outside the acceptable range. Food Microbiol 25: 92-98. [Crossref]
- Calvin R, Qi R, Raghavan V, (2003) IEEE Transactions on Pattern Analysis and Machine Intelligence 25: 265-270.