Major evidence points towards a link between inflammation and type 2 diabetes, insulin resistance and diabetic complications, where monocytes are deeply involved. Entropy (information dimension) of pericellular membrane of monocytes was evaluated in diabetic patients and in control subjects. Monocytes were collected from normal healthy volunteers (n=6) and from type 2 diabetic patients (n=10). To reproduce in vitro an activated status of the monocytes, monocytes from healthy volunteers were stimulated in vitro with the calcium ionophore A23187 or with the oligopeptide FMLP. Monocytes, obtained by Ficoll-Paque, were examined by transmission electron microscopy. The cell contour was extracted, resized to a standard dimension and converted to a single pixel outline. Box-counting method was then applied to determine the entropy of the monocytic surface. Entropy of monocytes appeared statistically higher in diabetic patients, compared with sex- and age-matched controls (p<0.01). The mechanism underlying the observed increased complexity of pericellular membrane may be explained by the in vivo activation of the circulating monocyte in diabetes. In effect, fractal analysis of stimulated in vitro monocytes (healthy subjects) showed a significant increase of entropy of pericellular membrane, compared with their controls (p<0.001). Our approach was able to assess and quantitatively evaluate in diabetic patients morphological modifications of the monocyte linked to its activation, offering new parameters useful to follow the effects of therapeutic procedures.
monocytes, diabetes, fractals, entropy, morphometry
Inflammation and activation of the innate immune system could be linked to type 2 diabetes pathogenesis and also to the development of common diabetic complications, mainly atherosclerosis [1]. In effect, since ten years, a number of publications have shown that type 2 diabetic patients appear to be in a low grade inflammation status. Inflammatory markers such as C-reactive protein (CRP), sialic acid, and diverse cytokines are predictors of the disease and they are found to be augmented in these patients [2,3]. These inflammatory components are important in the development of common diabetic complications. Difficulty in wound healing, greater susceptibility to infections, macrovascular and microvascular diseases are complications commonly seen in type 2 diabetic patients and could carry an inflammatory background. Fractal geometry is a very useful tool for describing the irregular and complex shapes of many natural objects. In the field of pathology, fractal geometry has been applied with remarkable success as a discrimant parameter in histopathology, also regarding the study of blood cells [4-9].
The aim of our study is to evaluate the information dimension (entropy, measure of geometrical complexity) of pericellular membrane of monocytes observed by transmission electron microscopy in type 2 diabetic patients and in control subjects. Monocytes from healthy subjects were also stimulated in vitro with the ionophore A23187 or with the oligopeptide FMLP.
Ex vivo studies
Monocytes obtained by Ficoll-Hypaque procedure were collected from type 2 diabetic patients (n=10) and from gender- and age-matched healthy controls (n=6).
In vitro study
Leukocytes obtained by Ficoll-Hypaque from healthy subjects were stimulated with the calcium ionophore A23187, Sigma-Aldrich C7522 (2.5*10-6 M) and with theoligopeptide N-formyl-methionyl-leucyl-phenylalanine (FMLP, Sigma-Aldrich F3506) (10-7 M) for 2 minutes.
Electron microscopy
Glutaraldehyde-fixed leukocytes were postfixed in osmium tetroxide (1%), dehydrated by acetone, embedded in Araldite, and stained with lead citrate and uranyl acetate. Fifty monocytes for sample were grabbed at 3,500 x without any selection.
Entropy evaluation of monocytic surface
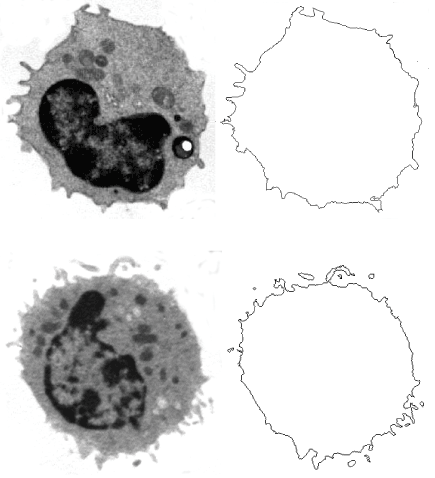
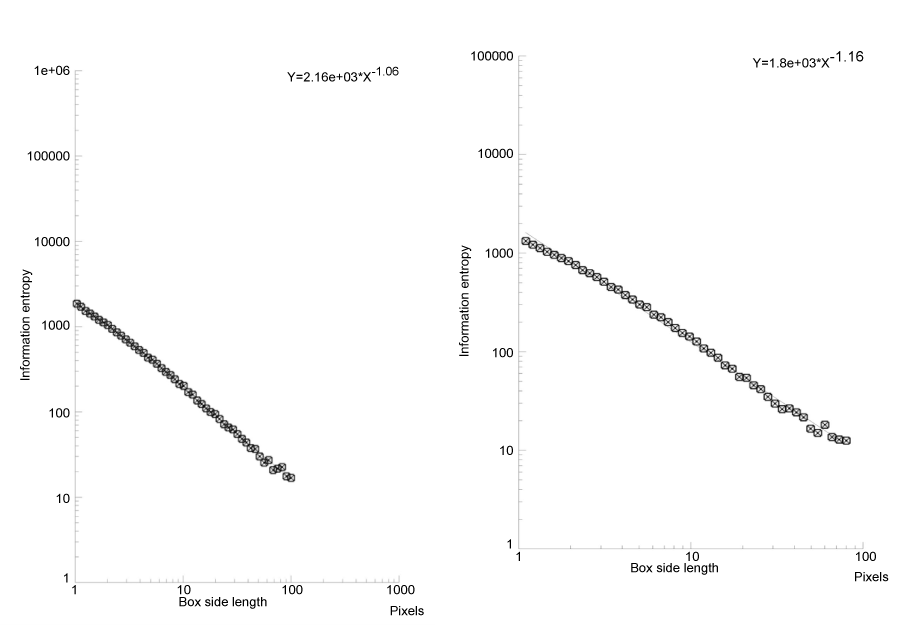
By grey level threshold segmentation, single pixel outline of monocyte pericellular membrane was obtained (Jmicrovision v1.27; ImageJ) (Figure 1). Fractal analysis was performed by using the box-counting method. Briefly, each image was covered by a net of L square boxes (from 1 to 100 pixels) and the number of points in each box containing any part of the outline Nb(L) was counted. A log-log plot of the Nb(L) vs. 1/L for each image was drawn and the points were interpolated by a straight line (Figure 2). The slope of the straight line (p<0.001) represented the entropy (information dimension, D1, Benoit v. 1.3), justifying the fractal approach. The method had been previously validated by measuring computer-generated shapes of known fractal dimension.

Figure 1. Blood monocyte in a healthy subject (top, right) and in a type 2 diabetic patient (bottom). The pericellular membranes are drawn and extracted (right). Transmission Electron Microscopy, 3,500 x.

Figure 2. Log plot of a monocyte at rest (left) and in a diabetic patients (right). The information dimension (entropy) is the slope of the straight line. In type 2 diabetic patients, monocyte entropy is higher than in the control.
Statistical analysis
Mann-Whitney test was used to ascertain differences among the groups.
Entropy of the pericellular membrane of circulating monocytes appeared statistically increased in type 2 diabetic patients, compared with gender- and age-matched controls (p<0.01) (Table 1). Entropy of monocytes from healthy human subjects, in vitro stimulated with the ionophore A23187 or with the oligopeptide FMLP, showed an analogous significant increase of complexity of pericellular membrane, compared with controls (p<0.001) (Table1).
Table 1. Information dimension (entropy, D1) of pericellular membranes of monocytes in healthy subjects vs. type 2 diabetic patients, and after in vitro stimulation of monocytes collected from healthy individuals.
|
Information Dimension, D1 |
|
Controls (n=6) |
1.04 ± 0.02 |
|
Diabetes (n=9) |
1.16 ± 0.03 |
P<0.01 |
In vitro stimulated monocytes (n=4) |
1.20 ± 0.04 (A23187)
1.22 ± 0.04 (FMLP) |
P<0.001
P<0.001 |
Information dimension, D1, of the monocytic pericellular membrane in type 2 diabetic patients is higher than in control subjects. Information dimension, D1, of the monocytic pericellular membrane in in vitro stimulated monocytes
Macrovascular disease, mainly atherosclerosis, is the most important complication in type 2 diabetes. We may note that atherosclerosis is considered a chronic inflammatory disease mediated by the presence of hypercholesterolemia, chiefly low-density lipoprotein (LDL), but the innate immunity is also involved in atherosclerosis [10]. Monocytes and macrophages are essential cells in this process and their recruitment locally in the plaque is a major pathogenic feature [11]. Moreover, monocytes of type 2 diabetic patients show higher , CD11b, CD 18 [12], COX-2, IL-8 [13] and CD 16 [14] expressions and the monocyte population is altered [15], underlying the activation of this cell in diabetes, also implying that in diabetes they are in vivo pre-activated.
In the present work we describe increased entropy, as measure of complexity, of the pericellular membrane of circulating blood monocytes in type 2 diabetic patients.
The result may be explained by the in vivo activation of the circulating monocyte in diabetes. In effect, our in vitro experiments reveal an analogous increased complexity of the monocyte pericellular membrane after incubation of monocytes from healthy individuals with substances that trigger monocyte activation.
Our approach describe morphological modifications of circulating blood monocyte linked to its activation in the diabetic patient, modifications that are accurately quantified by information dimension (entropy) fractal index. The result offers a parameter able to evaluate the monocytic activation in the patient and to follow the effects of therapeutic procedures. The methods of fractal analysis of shapes of monocytes is inexpensive and not time consuming (1 minute to skeletonize the image, 10 seconds to perform the entropy evaluation by a PC). It may be performed using cheaper ready-made fractal analysis software, such as Benoit 1.3, and image processing may be performed using free softwares, such as JmicroVision or ImageJ with its plugins, as presented here.
1. Schmidt MI, Duncan BB, Sharrett AR, Lindberg G, Savage PJ, et al. (1999) Markers of inflammation and prediction of diabetes mellitus in adults (atherosclerosis risk in communities study): a cohort study. Lancet 353: 1649–1652. [Crossref]
2. Duncan BB, Schmidt MI, Pankow JS, Ballantyne CM, Couper D, et al. (2003) Low-grade systemic inflammation and the development of type 2 diabetes: the atherosclerosis risk in communities study. Diabetes 52: 1799–1805. [Crossref]
3. Pickup JC (2004) Inflammation and activated innate immunity in the pathogenesis of type 2 diabetes. Diabetes Care 27: 813–823. [Crossref]
4. Cross SS, Cotton DWK (1992) The fractal dimension may be a useful morphometric discriminant in histopathology. J Path 166: 409-411. [Crossref]
5. Bianciardi G, Miracco C, De Santi MM, Luzi P (2003) Differential diagnosis between mycosis fungoides and chronic dermatitis by fractal analysis. J Dermatol Sci 33: 184-186. [Crossref]
6. Bianciardi G, Traversi C, Cattaneo R, De Felice C, Monaco A, et al. (2012) Phase transition of Microvascular Network Architecture in Human Pathologies. Theor Biol Forum 1: 37-45. [Crossref]
7. Bianciardi G, Bisogno S, Bertoldi I,Laurini L, Coviello G, et al. (2013) Fractal dimension of bone texture in radiographs correlates to ultrasound broadband attenuation T-score. Clin Exp Rheumatiol 31: 389-393. [Crossref]
8. Bianciardi G (2014) Increased entropy in in vitro activated platelets. Applied Cell Biology 3:110-114.
9. Bianciardi G, Tanganelli I (2014) Fractal analysis of circulating platelets in type 2 diabetic patients. Clin Hemorheol Microcirc; 10/2014: Epub ahead of print. [Crossref]
10. Libby P (2002) Inflammation in atherosclerosis. Nature 420: 868–874. [Crossref]
2021 Copyright OAT. All rights reserv
11. Osterud B, Bjorklid E (2003) Role of monocytes in atherogenesis. Physiol Rev 83: 1069–1112. [Crossref]
12. Wautier JL, Wautier MP (1999) Pathophysiologic aspects of diabetic angiopathy. Diabets Metab 25: 21-26. [Crossref]
13. Pittas AG, Dawson-Hughes B, Li T, Van Dam RM, Willett WC, et al. (2006) Vitamin D and calcium intake in relation to type 2 diabetes in women. Diabetes Care 29: 650-656. [Crossref]
14. Min D, Brooks B, Wong J, Salomon R, Bao W, et al. (2012) Alterations in Monocyte CD16 in Association with Diabetes Complications. Mediators Inflamm. [Crossref]
15. Gonzalez Y, Herrera MT, Soldevila G, Garcia-Garcia L, Fabián G, et al. (2012) High glucose concentrations induce TNF-α production through the down-regulation of CD33 in primary human monocytes. BMC Immunol 13: 19. [Crossref]
Softwares
JMicroVision 1.27, www.microvision.com
ImageJ, http://imagej.nih.gov/ij/
Benoit 1.3, TruSoft Int'l Inc,http://trusoft-international.com/benoit.html


