Abstract
In presence of TiO2 and irradiation, phenol can be degraded by hydroxyl radicals or directly via photogenerated carriers, as occurs in photocalytic processes. In this work a commercial micro-sized TiO2 sample in powder form and industrially coated on porcelain grès tiles were tested in water remediation with phenol as model molecule. Firstly, we investigated the behaviour of the commercial micro-sized TiO2 comparing the results with reference nano-sized catalyst in the phenol photodegradation process, widely studied in the last decades. Following the phenol concentration as well as the main intermediates formation over time by HPLC analysis, and the mineralization by TOC analysis, we presented results about the photocatalytic behaviour in terms of adsorption, by-products formation, and reaction rate at different phenol starting concentrations. In particular, with the photocatalytic tiles, phenol photodegradation percentage is almost the same at 15 ad 25 ppm (78% and 73% respectively), and much lower at 50 ppm (46%) after 6 hours of test.
Key words
Phenol, titanium dioxide, photocatalytic degradation, micro-sized TiO2, photocatalytic porcelain grès tile
Introduction
Phenol and phenolic derivatives are the major pollutants of the aquatic environment because of their widespread use [1,2]. The European Union (EU) has already classified several of them as priority contaminants, and the 80/778/EC directive certifies a maximum concentration of 0.5 μg/L for total phenols in drinking water [3]. Phenols are known as recalcitrant organic compounds or persistent organic pollutants (POPs), firstly because they show a great chemical stability and secondly because the degradation of the aromatic ring requires a strong oxidation power to decompose it in simpler mineralized products [4,5]. The traditional physical techniques such as adsorption on activate carbon, ultrafiltration, reverse osmosis, coagulation by chemical agents, and ion exchange on synthetic adsorption resins are only able to transfer organic compounds from water to another phase, thus creating secondary pollution [6-9].
Photodegradation using semiconductor materials was found to be an effective Advanced Oxidation Process (AOP); the mechanism in water phase is widely studied using different types of photocatalysts in variable experimental conditions, with the aim to investigate the influence of various parameters, such as specific surface area, crystal structure, and porosity, as well as the impact of different classes of organic compounds, the amount of the catalyst loading, the initial pH, the energy source, and the starting pollutant concentration on the efficiency of the photo-oxidation [10,11]. Photocatalysis is able to induce total oxidation reactions in most cases, leading the most part of the elements to their higher oxidation state, namely CO2. The UV irradiation on a semiconductor oxide in aqueous phase produces charge carriers generation at the surface, electrons e- and holes h+, which have sufficient oxidizing power to react with both hydroxide ions and water molecules, producing hydroxyl radicals [12].
Titanium dioxide (TiO2) is considered one of the best semiconductor as photocatalyst, owing its outstanding features including photocatalytic activity, inertness, physical and chemical stability, full availability even as commercial product, and low cost. In spite of these advantages, many authors evidenced serious problems connected with the use of nano-sized materials: on one hand difficulty on sample handling, separation and collection, on the other hand possible side-effects on human health [13-17].
Recently, some papers reported the behaviour of photocatalytic films of TiO2 immobilized onto tiles for the degradation of different organic molecules, but in all cases the authors made use of nano-TiO2 and with different preparation methods [18,19]. However, the use of nano-powders is very complicated in real cases: an industrial-scale production requires handling large quantities of them and they are neither manageable nor their inhalation can be kept under control. These reasons have encouraged the development of new coated materials in order to simplify the final separation step between catalyst and depolluted water making these products useful for a wider range of real applications [20]. The manufacturing preparation of ActiveTM tiles vitrifies the surface and this confers high stability and long lasting life of the photocatalytic coating, as already verified on the degradation of organic dyes [21].
There are two main issues about the phenol oxidation process: the importance of the adsorption of the organic compound on the photocatalytic surface as the determining stage in the reaction kinetic, and the study of the reaction intermediates. Among the adsorption-kinetic models, the Lamgmuir-Hinshelwood (L-H) model is the most applied to describe photocatalytic mineralization reactions; the rate of the reaction is proportional to the surface coverage by the pollutant, but as the concentration of the reactant increases above a certain level, the saturation of the catalyst surface makes decrease the reaction rate [22].
In literature, different analytical techniques were used and various hydroxylated intermediate compounds have been detected (mainly hydroquinone, p-benzoquinone, and catechol) because they come from the attack of the phenol ring at the first step of the reaction. Consequently, different phenol photodegradation pathways have been proposed [22-26].
In the present paper, we report a study in which the focus is on the investigation of the phenol degradation pathway using TiO2 powders with particle size in the range nano or micro and micro-sized TiO2 deposited on tiles. The phenol was properly selected as model molecule considering the large number of scientific works that characterize its photodegradation process, in terms of reactivity, mechanism, by-products formation.
We present the results obtained with a commercial micro-sized TiO2 (1077 by Kronos) compared to that obtained with the classical and well-known nano-TiO2 (P25 by Evonik). Secondly, the photoefficiency of the micro-sized sample was evaluated when coated onto porcelain grès tiles (ActiveTM tiles by GranitiFiandre) [patent n. EP 2443076]. The surface was covered by a mixture of TiO2 and SiO2-based compound. The industrial setup was chosen to maintain the anatase crystalline phase and to obtain the vitrification of the tile surface. The characterizations show no porosity, durability, hardness, a complete water-proofing and frost resistance.
Experimental
Materials and methods
Two commercial TiO2 powders, P25 by Evonik and 1077 by Kronos, were chosen as nano-sized and micro-sized photocatalysts, respectively. P25 by Evonik is usually used as reference photocatalyst, while TiO2 1077 by Kronos is commercially classified as pigment. The main characteristics of these samples have been already reported elsewhere [27]. 1077 by Kronos was also coated on tiles to obtain the commercially available photoactive porcelain grés tiles (named Orosei ActiveTM): for this preparation TiO2 powder was mixed with a silica-based compound, sprayed on the tile surface, fired in an industrial kiln a 680°C and cleaned with a rotating wire brush to remove the TiO2 weakly stuck at the tile surface, as already reported [27].
All the chemicals and reagents used in the present study were analytical and HPLC grade. Phenol, 1,4-benzoquinone and maleic acid, were obtained from Aldrich. Hydroquinone was purchased from Fluka. Phenol and standard solutions were prepared using purified water (18 MΩ cm) obtained from Millipore Waters Milli-Q apparatus. All reactants were used without any further purification.
Sample characterization
The specific surface area (SSA) of the samples was determined by N2 adsorption/desorption experiments at 77 K (BET method) using a Sorptometer Instrument (Costech Mod. 1042).
The phase composition of the samples was confirmed by X-ray diffraction (XRD) using a PW3830/3020 X’Pert diffractometer from PANalytical working Bragg–Brentano, using the Cu Kα1 radiation (λ= 1.5406 Å). The morphology of the powders was inspected by means of high-resolution electron transmission microscopy (HR-TEM) using a JEOL 3010-UHR instrument (acceleration potential: 300 kV; LaB6 filament) equipped with an Oxford INCA X-ray energy dispersive spectrometer (XEDS) with a Pentafet Si(Li) detector. Samples were “dry” dispersed on carbon Cu grids. SEM-EDX analyses were performed on Orosei ActiveTM tiles (Field Emission Gun Electron Scanning Microscopy LEO 1525, metallization with Cr). Elemental composition was determined using Bruker Quantax EDS.
Finally, the study of the surface species present after phenol photodegradation at different time has been carried out by means of in situ FT-IR spectroscopy on the powders extracted from the reactor. Absorption/transmission IR spectra have been obtained on a Perkin–Elmer FT-IR System 2000 spectrophotometer equipped with a Hg–Cd–Te cryo-detector, working in the range of wavenumbers 7200– 580 cm-1 at a resolution of 2 cm-1 (number of scans 60). For IR analysis powder catalyst has been compressed in self-supporting disc (of about 10 mg cm-2).
Photocatalytic tests
Phenol photodegradation was performed using two different reactor configurations, one for the TiO2 samples in powder form and one for the photoactive tiles; the experimental setup is fully described in a previous work [21]. For the tests performed with powders, irradiation was allowed by the use of an external UV lamp (500 W, Jelosil®, HG500, halide lamp), emitting in the range 315–400 nm and with a emitting power evaluated in the middle of the reactor by a radiometer instrument (DeltaOHM, model HD2102.2) of 75 W/m2. The reactor was equipped by an internal refrigerating serpentine system. For the reactor working with photocatalytic tiles, a 125 W UV-A lamp (Jelosil, mercury vapor low pressure), with an illuminance of 65 W/m2 directly immersed into the solution was used.
By using the catalyst powder, the TiO2 concentration was set at 0.1 gL-1, in case of tiles, the TiO2 concentration has been evaluated by the SEM-EDX analysis, as reported in the following paragraph about sample characterization. The active surface area immersed in the phenol solution is equal to 0.0224 m2 which corresponds to a concentration of TiO2 equal to 0.049 gL-1.
The phenol starting concentration was rated from 15 to 50 ppm, following the reaction for 6 hours. Samplings were executed every 30 min, at first, then every 60 min. HPLC analyses were performed using Agilent 1100 Series Instrument, a diode array and with a 125 mm × 4 mm C18 reverse-phase column to follow the phenol degradation and intermediate formation. The mobile phase composition was acetonitrile and water at a volume ratio of 40:60. The mineralization percentage of phenol was determined through the Total Organic Carbon (TOC) content. TOC was measured with a 5000 A Shimadzu calibrated with standard solutions of potassium hydrogen-phthalate. Each measure was repeated several times and only the mean value is reported.
Results and discussion
Sample characterization
Surface, structure and morphology of the catalyst powders are extensively investigated in previous works [28,29]. Characterization highlights the main features which influence the photocatalytic behaviour. XRD patterns show that 1077 by Kronos consists of pure anatase, P25 exhibits the well-known phase composition 75:25 in anatase/rutile ratio, having average crystallite size 130 nm and 26 nm, respectively. As a result, the BET surface area of micro-size powder is much lower than nano-size one, 12 m2g-1 compared to 50 m2g-1. HR-TEM analysis confirms that P25 is a nano-sized powder, being the crystallite size lower than 30 nm and Kronos 1077 is a micro-sized one, with crystallites dimensions higher than 100 nm, thus excluding the presence of ultrafine particles. All these data are confirmed for the materials fired in the industrial kiln.
Moreover, the surface morphology of active tiles, after the firing in the industrial kiln, performed by SEM-EDX investigation, is characterized by a continuous coating made up of micro sized Kronos 1077 particles having average diameter around tenths of a micrometer, as already discussed in recent study [20].
Adsorption and photolysis processes
Preliminary tests in dark conditions, in presence of the catalysts, and on the contrary, with just UV irradiation, were conducted to assess the adsorption processes and the phenol stability at experimental conditions, respectively. By what, the adsorption contribution is negligible, about 1-2 %, whereas the photolysis data show different trend whose impact is more marked, about 20-25 %.
Photocatalytic degradation of phenol in presence of TiO2 powders
The effect of initial concentration of phenol on the photodegradation in the range of 15-50 ppm is plotted in Figure 1. The trends of the powders (both nano and micro) are consistent with the phenol starting concentration, with a lower degradation % for higher starting concentration of the organic molecule: this is reasonably related to the saturation of the active surface sites on increasing the starting amount of the pollutant. Moreover, the difference in the particle size (not only related to the values of specific surface area, but also to both nature and amount of active surface sites) is in line with the results that, in case of the micro-powder, are slightly below those obtained with the nano-ones.
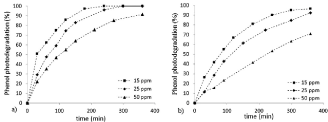
Figure 1. Phenol photodegradation % vs. time at different starting concentrations (15, 25 and 50 ppm respectively): a) TiO2 P25; b) TiO2 Kronos 1077.
At lower concentrations (15 and 25 ppm), P25 TiO2 catalyst reached the complete degradation before the end of the test, while K1077 TiO2 catalyst shows slower paths, even if, after 6 hours, the photodegradation is almost completed (97% and 93%, respectively). Instead, at the highest concentration (50 ppm), the performances achieved are lower for both TiO2 powders (91% for nano-size catalyst, 71% for micro-size one).
In Figure 2 the formation rate of the main by-products, i.e. hydroquinone, benzoquinone and maleic acid, is reported, at different phenol starting concentration using K1077 powder. It is clear that a change of the initial concentration causes some changes in the by-product formation, in particular for the different molecule distributions. The development of photodegradation process leads to progressive disappearance of phenol, never completely, and progressive appearance of hydroquinone, benzoquinone and maleic acid. For each initial concentration, the amount of aromatic species decreases over time and increases the amount of maleic acid. Moreover, comparing the developments of the different tests, the amount of aromatic species is reduced in proportion to the initial concentration of phenol.
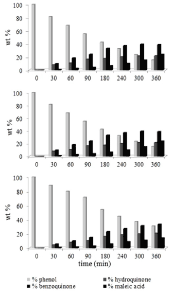
Figure 2. Trend of by-products, as a function of the phenol starting concentration: a) 15 ppm; b) 25 ppm; c) 50 ppm. Kronos 1077 catalyst photodegradation.
The pathway, we have observed, is consistent with the reaction mechanisms already proposed in literature when nano-sized catalysts were employed; a recent review sums up several examples [22] and we also confirm here the pathway with P25. The large gap in the physical-chemical properties does not affects the route of degradation process between the nano and micro particles. The concentration trends and the nature of the by-products detected point out same photocatalytic behaviour. Thus, although the micro-sized TiO2 performance is slower, follows a similar pathway of the nano-sized one, taken as reference. The process could be listed as well: the replacing on the aromatic ring by OH species, the further oxidation to benzoquinone, the opening of the ring to form straight chain and the mineralization to water and carbon dioxide (Figure3).
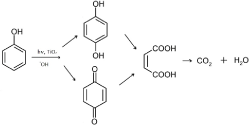
Figure 3. Mechanism pathway of phenol photodegradation.
Mineralization rates of polluted water in presence of TiO2 powders
The mineralization results, as for the photodegradation processes, are in relationship with the starting phenol concentrations. The experimental data, reported in Figure 4, show an initial delay then, the process goes on to obtain mineralization performances equal to 58%, 40% and 16% for the nano-sized catalyst and 33%, 26% and 8% for the micro-sized one, at 15 ppm, 20 ppm and 50 ppm starting phenol concentration, respectively. The difference between the two catalyst performance are very noticeable, more or less close to 50%, but it could be justified taking into account its physical-chemical properties, as crystalline phase, particle size and surface area, already reported in characterization section. These results should be discussed weigh up the expected lower photocatalytic activity of micro-sized catalyst and the advantages that characterize it, as discussed in introduction part.
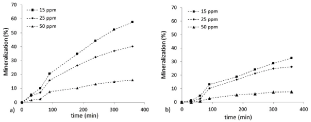
Figure 4. Mineralization trends % vs. time at different starting concentrations (15, 25 and 50 ppm respectively): a) TiO2 P25; b) TiO2 Kronos 1077.
FT-IR analysis
The FT-IR analysis on the exhausted powders highlights the different behaviour of the two catalysts during the photodegradation tests at 50 ppm phenol starting concentration. In Figure 5 FT-IR spectra of Kronos 1077 and P25 after 3 hours (curves A and B, respectively) and 6 hours (curves C and D, respectively) of phenol photodegradation (50 ppm) are reported. Spectra are rather complex, showing envelopes of bands that, from the comparison with spectra of pure Kronos and P25 samples (curves E and F, respectively) are clearly related to the presence of several reaction by-products. The assignment of all the observed bands is not straightforward. However, some bands give precise information about the nature of species present at the catalyst surfaces.
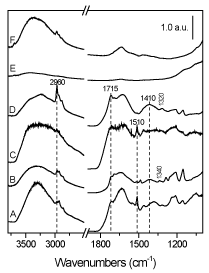
Figure 5. FT-IR spectra of Kronos 1077 and P25 after 3h (lines A and B, respectively) and after 6h (lines C and D, respectively) of phenol (50 ppm) photodegradation. Spectra of pure Kronos 1077 and P25 (E and F, respectively) are reported for comparison purposes.
It is worth of note the peak at 1510 cm-1 that is well evident on Kronos 1077 independently from the reaction time (curves A and C), hardly visible on P25 after 3 hours of degradation (curve B) and not present on P25 after 6 hours of degradation (curve D). This band is a fingerprint of aromatic compounds, being assigned to the stretching mode of C=C bond of the aromatic ring. This means that in the case of Kronos, aromatic by-products are still present after 6 hours of reaction, otherwise for P25 the degradation completely proceeds to aliphatic compounds. As a matter of fact, the presence of these latter is put in evidence by the band at 2960 cm-1 (aliphatic n(C-H) mode) that is present also on Kronos, but that is very intense on P25 after 6 hours of phenol degradation; at 1340-1320 cm-1 the band related to the bending mode of aliphatic C-H is also evident.
Moreover, bands at about 1715 and 1410 cm-1 along with the envelope at wavenumbers lower than 1280 cm-1 observable for both Kronos and P25 with increased intensities on increasing reaction time, are related to the presence of ketones and/or carbossilic acids. In particular, they can be assigned to n(C=O) (1715 cm-1) and n(C-O) modes (1410 cm-1 and envelope at n< 1280 cm-1) from COOH/COO- groups, in agreement with the by-products analysis reported in Figure2.
Finally, the very broad band extending from 3700 to 2500 cm-1 is related to the O-H stretching mode either of (i) surface OH groups, (ii) undissociated water molecules or (iii) by-products (Figure 3). At about 1620 cm-1 the band related to the bending mode of molecular water is present as well.
Degradation of phenol in presence of photocatalytic porcelain grès tiles
The trend of the photodegradation processes, at high exposure times, depends on the initial concentrations: the phenol photodegradation percentage is almost the same at 15 and 25 ppm (78% and 73% respectively), and much lower at 50 ppm (46%) after 6 hours of exposure, as shown in Figure 6. Conversely, the mineralization data, show contrasting behaviour (Figure 7a). At 15 ppm, the process begins at once and the trend is growing, the hydroquinone concentration is almost constant because the catalyst is able to degrade the amount produced in the time (Figure 7b) and the active catalyst is able, from the start, to perform the process of photodegradation up to progressive mineralization. Therefore, at 15 ppm as initial phenol concentration, the pollutant adsorption is followed immediately by its degradation and mineralization; these processes go parallel and are superimposed in time. Both HPLC and TOC analysis show consistent results between phenol photodegradation and mineralization process. To higher concentrations (25 ppm and 50 ppm), initially the mineralization process does not occur, then the rates sudden rise after 180 minutes. The trends of hydroquinone concentration follow the mineralization rate and the comparison highlights a relating shift: increasing the hydroquinone store, the mineralization starts. Afterwards the early stage, there is a very fast increase of the hydroquinone formation, which leads to overcoming the mineralization degree detected at 15 ppm. The data are lower at higher concentration, thus consistent with starting phenol concentration. Then, the two processes follow similar paths, but not equal. After 6 hours the mineralization rate and the hydroquinone concentration decrease when the initial concentration is equal to 25 ppm. In conclusion, the increase of the starting pollutant concentration causes a significant effect on the initial stage of the photocatalytic process, and consequently the subsequent steps are slowed down. Thus, the processes of adsorption, conversion, degradation and mineralization are in sequence.
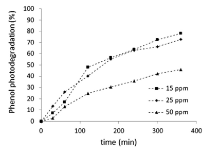
Figure 6. Phenol photodegradation % vs. time at different starting concentrations (15, 25 and 50 ppm respectively), influence of the starting phenol concentration on the reaction rate.
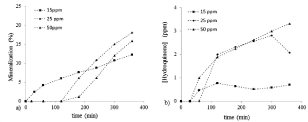
Figure 7. Mineralization % vs time, a) and hydroquinone concentration vs time b); at different starting concentrations of phenol (15, 25 and 50 ppm respectively).
Conclusion
In present work, it was investigated micro-sized 1077 by Kronos photocatalytic performance in comparison to P25 nano-powder that is worldwide used as photocatalyst reference material. It was an attempt to understand the efficiency of micro-size TiO2, in powder form or coated on porcelain grès tiles, even if its larger sized and its lower surface area, clearly, raises several issues regarding its photocatalytic behaviour. The phenol molecule was taken as model molecule considering the large number of studies already carried out over the last 25 years which report widely its photodegradation behaviour. The first stage involved the study of the micro-sized powder. The results in terms of photodegradation rate, mineralization degree and trend of by-products concentration advance likely applications. Nano-powder is always the best photocatalyst with a phenol degradation of 97%, but also the micro-sized one shows an excellent result with a final 93% after 6 h, at the lower pollutant concentrations. The analysis of the reaction intermediates suggests that phenol gradual degradation is correlated to a progressive increase of the aliphatic species formation followed by an increase of mineralization degree. In comparison to nano-size catalyst, phenol photodegradation and mineralization results lead to positive and encouraging findings. By an overall assessment of its features, taking into account proved photocatalytic performances, and also considering the positive impact on the environment and living being health, micro-sized catalyst use and development is for sure of a future interest.
The second stage involved the study of the micro-sized catalyst immobilized on ceramic support. The photocatalytic process was influenced by several variables, as well as the amount and distribution of the TiO2 particles on the surface, the nature of the support, the diffusion and adsorption processes of the pollutant, the competition between by-products on the active surface. The photoactive tile shows an effective ability to degrade the phenol molecules at the different starting phenol concentration (15 and 25 ppm, 78% and 73% respectively, and much lower at 50 ppm, 46% after 6 hours of test). Instead, the mineralization trends point out initial delays that remark the difficulty to complete the phenol removal at higher concentrations, which, however, were regained later. Micro-sized TiO2, in powder form or as coated, can be really used as a valid choice for photocatalytic processes preventing the dangerous risk towards the human safety and improving industrial processes of recovery of the catalytic particles and reuse of clean water.
References
- Patterson JW (1977) Waste Water Treatment Technology, USA: Ann Arbor Science Publishers Inc, Ann Arbor.
- Ozbelge TA, Ozbelge OH, Baskaya SZ (2002) Removal of phenolic compounds from rubber–textile wastewaters by physico-chemical methods. Chem Eng Process 41: 719-730.
- Rodríguez I, Llompart MP, Cela R (2000) Solid-phase extraction of phenols. J Chromatogr A 885: 291-304. [Crossref]
- Herrmann JM (2005) Heterogeneous photocatalysis: state of the art and present applications. Top Catal 34: 49-65.
- Sindhu J, Jyothi KP, Devipriya S, Yesodharan EP (2013) Influence of Reaction Intermediates on the Oscillation in the Concentration of in situ formed Hydrogen peroxide during the Photocatalytic Degradation of Phenol Pollutant in Water on Semiconductor Oxides. Res J Recent Sci 2: 82-89.
- Busca G, Berardinelli S, Resini C, Arrighi L (2008) Technologies for the removal of phenol from fluid streams: a short review of recent developments. J Hazard Mater 160: 265-288. [Crossref]
- Aksu Z, Gönen F (2004) Biosorption of phenol by immobilized activated sludge in a continuous packed bed: prediction of breakthrough curves. Process Biochem 39: 599-613.
- Aksu Z, Akpinar D (2001) Competitive biosorption of phenol and chromium(VI) from binary mixtures onto dried anaerobic activated sludge. Biochem Eng J 7: 183-193.
- Camporro A, Camporro MJ, Coca J, Sastre H (1994) Regeneration of an activated carbon bed exhausted by industrial phenolic wastewater. J Hazard Mat 37: 207-214.
- Emeline AV, Zhang X, Murakami T, Fujishima A (2012) Activity and selectivity of photocatalysts in photodegradation of phenols. J Hazard Mater 211-212: 154-60. [Crossref]
- Kosanic M (1996) Photocatalytic degradation of organic compounds in water, Proceedings - Faculty of Technology, Novi Sad, 133-149.
- Herrmann JM, Duchamp C, Karkmaz M, Hoai BT, Lachheb H, et al. (2007) Environmental green chemistry as defined by photocatalysis. J Hazard Mater 146: 624-629. [Crossref]
- Singh S, Nalwa HS (2007) Nanotechnology and health safety--toxicity and risk assessments of nanostructured materials on human health. J Nanosci Nanotechnol 7: 3048-3070. [Crossref]
- Skocaj M, Filipic M, Petkovic J, Novak S (2011) Titanium dioxide in our everyday life; is it safe? Radiol Oncol 45: 227-247. [Crossref]
- Ruel SM, Choubert JM, Esperanza M, Miège C, Madrigal PN, et al. (2011) On-site evaluation of the removal of 100 micro-pollutants through advanced wastewater treatment processes for reuse applications. Water Sci Technol 63: 2486-2497.
- Fonger GC, Hakkinen P, Jordan S, Publicker S (2014) The National Library of Medicine’s (NLM) Hazardous Substances Data Bank (HSDB): Background, recent enhancements and future plans. Toxicol 325: 209-216.
- Trouiller B, Reliene R, Westbrook A, Solaimani P, Schiestl RH (2009) Titanium Dioxide Nanoparticles Induce DNA Damage and Genetic Instability In vivo in Mice. Cancer Res 69: 8784-8789.
- Lopez L, Daoud WA, Dutta D, Panther BC, Turney TW (2013) Effect of substrate on surface morphology and photocatalysis of large-scale TiO2 films. Appl Surf Sci 265: 162-168.
- Petrovič V, Ducman V, Škapin SD (2012) Determination of the photocatalytic efficiency of TiO2 coatings on ceramic tiles by monitoring the photodegradation of organic dyes. Ceram Int 38: 1611-1616.
- Kinsinger N, Honda R, Keene V, Walker SL (2015) Titanium Dioxide Nanoparticle Removal in Primary Prefiltration Stages of Water Treatment: Role of Coating, Natural Organic Matter, Source Water, and Solution Chemistry. Environ Eng Sci 32: 292-300.
- Bianchi CL, Colombo E, Gatto S, Stucchi M, Cerrato G, et al. (2014) Photocatalytic degradation of dyes in water with micro-sized TiO2 as powder or coated on porcelain-grès tiles. J Photochem Photobiol A: Chem 280: 27-31.
- Grabowska E, Reszczyńska J, Zaleska A (2012) Mechanism of phenol photodegradation in the presence of pure and modified-TiO2: A review. Water Res 46: 5453-5471. [Crossref]
- Guo Z, Ma R, Li G (2006), Degradation of phenol by nanomaterial TiO2 in wastewater. Chem Eng J 119: 55-59.
- Peiró AM, Ayllón JA, Peral J, Doménech X (2001) TiO2-photocatalyzed degradation of phenol and ortho-substituted phenolic compounds. Appl Catal B 30: 359-373.
- Sobczyński A, Duczmal Ł, Zmudziński W (2004) Phenol destruction by photocatalysis on TiO2: an attempt to solve the reaction mechanism. J Mol Catal A: Chem 213: 225-230.
- Górska P, Zaleska A, Hupka J (2009) Photodegradation of phenol by UV/TiO2 and Vis/N,C-TiO2 processes: Comparative mechanistic and kinetic studies. Sep Purif Technol 68: 90-96.
- Bianchi CL, Pirola C, Gatto S, Nucci S, Minguzzi A, et al. (2012) New Surface Properties in Porcelain Gres Tiles with a Look to Human and Environmental Safety. Adv Mater Sci Eng.
- Bianchi CL, Gatto S, Pirola C, Naldoni A, Di Michele A, et al. (2014) Photocatalytic degradation of acetone, acetaldehyde and toluene in gas-phase: Comparison between nano and micro-sized TiO2. Appl Catal B: Environ 146: 123-130.
- Bianchi CL, Pirola C, Galli F, Stucchi M, Morandi S, et al. (2015) Nano and micro-TiO2 for the photodegradation of ethanol: experimental data and kinetic modelling. RSC Adv 5: 53419-53425.


