Abstract
Background: Intracerebral hemorrhage (ICH) is a significant contributor to global health-related morbidity and mortality. Due to improved recognition and treatment of atrial fibrillation by antithrombotics, there is an increase in proportion of ICH caused by warfarin and novel oral anticoagulants. However, the relationship between anticoagulation intensity and hematoma expansion remains unclear. We aimed to investigate the effects of international normalized ratio (INR) on hematoma expansion post ICH.
Methods: We conducted a retrospective study of all patients hospitalized for ICH at a single institution from January 1, 2008 and August 1, 2014. Hematoma volumes on initial CT scans and repeat CT scans were analyzed by the AxBxC/2 method. Univariate analysis was used to compare baseline characteristics and median regression analysis was performed to estimate the effects of INR on hematoma volume changes.
Results: We included 224 consecutive ICH patient. Median age (IQR) was 68.5 years (17.0), 60.3% were male, median presentation Glasgow Coma Scale (GCS) (IQR) was 14.0 (4.0), median volume (IQR) of the first CT was 11.7ml (25.6), median INR (IQR) was 1.1 (0.2). We showed that INR and time lapsed between first CT and second CT were independent risk factors for hematoma volume change, adjusting for baseline hematoma volume and time. Each 1.0 increase in INR was associated with hematoma volume increase by 2.4ml (p = 0.015).
Conclusions: We showed that high INR was associated with hematoma growth post ICH. However, the effects of anticoagulation reversal on the attenuation of hematoma growth remain uncertain and require confirmation in future randomized controlled studies.
Introduction
Intracerebral hemorrhage (ICH) is a stroke subtype accounting for approximately 10 % – 15 % of all strokes [1] and has an annual incidence of approximately 25 per 100,000 [2]. The one month case fatality rate is approximately 40 % and rising to 55 % in 1 year [2]. The 10-year survival rate is approximately 20 % to 25 % [3]. The rate of functional independence after ICH at 1 year varies between 12 % to 39 % [2,4]. Various factors have been shown to influence outcome in ICH, including age, initial hematoma volume, hematoma expansion (HE), neurologic deficit, intraventricular extension, and infratentorial location [5].
HE is a major determinant of early deterioration and death [6], with each milliliter increase in absolute volume is associated with increasing risk of dependence by 7 % [7] In addition, approximately 10 mL increase in hematoma volume over 24 hours was strongly associated with poor outcome [5]. HE has been widely investigated as a therapeutic target in ICH given its modifiable nature [4]. Accordingly, there is interest in determining the risk of HE, and in developing strategies to reduce HE [6].
Oral anticoagulant therapy (OAC) is considered an independent predictor of mortality in patients with intracerebral hemorrhage [8], the incidence of spontaneous intracranial hemorrhage is 7 -10 times higher amongst patients on oral anticoagulation (OAC) compared with those not on anticoagulation. OAC causes 8% – 14% of all ICH [9]. However, the association between hematoma growth and anticoagulation remains unresolved [8,9].
In this study, we aimed to investigate the effects of anticoagulation intensity on hematoma expansion. We hypothesized that ICH cases with higher International normalized ratio (INR) were associated with increased hematoma expansion.
Methods
Study population
The study protocol was approved by the human research ethics committee of the Royal Melbourne Hospital. Written informed consent was not sought as this was a retrospective analysis of data. We confirm that patient records were de-identified prior to analysis. We identified all subjects aged ≥18 years who were hospitalized with ICH between January 1, 2008 and August 1, 2014 at this hospital. The inclusion criteria required 2 CT scans in sequence and that the time period between the first CT to the second CT scan to be less than 72 hours. All cases were extracted from the hospital prospective stroke database. Exclusion criteria were traumatic ICH, hemorrhagic transformation of cerebral infarction, ICH secondary to vascular malformation, aneurysm, vasculitis of the central nervous system, and recent endarterectomy. In addition, we excluded patients with primary intraventricular hemorrhage (IVH), and those with missing INR values or without 2 CT scans.
Patient demographics and putative risk factors, including gender, age, hypertension, diabetes mellitus, atrial fibrillation, hypercholesterolemia, ischemic heart disease, previous transient ischemic attack (TIA) or stroke, and pre-admission medications were extracted from the stroke database or by a medical record chart review. Pre-admission modified Rankin Scale (mRS), Glasgow Coma Scale (GCS) at presentation, mRS at discharge, and in-hospital mortality were collected. All presentations were within 7 days of symptom onset, including inter-hospital transfers.
The initial baseline brain CT scans, second CT scan and INR values were evaluated. For warfarin-related ICH patients, initial INR values obtained before anticoagulation reversal were used for the analysis. Patients were both dichotomized by warfarin use and stratified by the level of anticoagulation.
Neuroimaging analyses
All CT scans were reviewed and evaluated in consensus by two experienced stroke neurologists (W.Y, B.Y.) who were blinded to the patients’ clinical status. The ICH volumes were determined from available CT scans. Hematoma Volume of first CT scan (CT 1) and second CT scan (CT 2) were calculated by AxBxC/2 methods. Intraventricular blood was not included in the volume calculation. The hematoma location was categorized into lobar (with or without involvement of subcortical white matter), deep (basal ganglia, thalamus, internal capsule), cerebellum and brainstem. Location was also dichotomized into supra- and infratentorial site. One initial shape classification for ICH included three categories: regular, irregular, and separated.
Statistical analysis
Continuous and categorical were compared using the Mann–Whitney rank-sum test and Fisher exact test as appropriate at baseline. The following factors were considered: age, hypertension, hyperlipidemia, diabetes, and ischemic heart disease. The association between the baseline INR category and hematoma volume change was investigated using median regression analysis. Statistical analyses were performed using Stata/ IC software package, version 12.0 (StataCorp, College Station, TX). All p values are 2-tailed, p ﹤0.05 was considered significant.
Results
From January 1, 2008 to August 1, 2014, we identified 583 ICH patients in Royal Melbourne Hospital, 279 patients excluded by reason of the lack of a second CT scan (CT 2), 22 patients excluded because of surgical hematoma evacuation, 4 patients intraventricular hemorrhage, 10 patients without clinical data were also excluded. In addition, we excluded 44 patients because the time period from CT 1 to CT 2 was more than 72 hours. In summary 224 patients were included for analysis. The characteristics of included and excluded patients were displayed in Table1 and 2.
Table 1. Baseline Data of the ICH patients
Group
_____________________________________
Factors
Number |
Included
Number (224) |
Excluded
Number (359) |
p value |
Male gender (%) |
135(60.3) |
194(54.0) |
0.14 |
Age median (IQR) |
68.5(17.0) |
75.0(19.0) |
0.00 |
Past History of Diabetes mellitus n (%) |
59(26.5) |
77(21.9) |
0.21 |
Past History of Hypertension n (%) |
180(80.4) |
250(70.2) |
0.01 |
Past History of Atrial Fibrillation n (%) |
48(21.5) |
71(20.4) |
0.75 |
Past History of Hyperlipidemia n (%) |
73(33.6) |
71(26.1) |
0.07 |
Past History of Statin Use n (%) |
74(33.0) |
114(31.8) |
0.75 |
Past History of Transient Ischemic Attack n (%) |
16(7.2) |
20(5.8) |
0.50 |
Past History of Ischemic Stroke n (%) |
21(9.7) |
30(11.0) |
0.63 |
Past History of Intracerebral Hemorrhage n (%) |
12(5.5) |
26(9.6) |
0.10 |
Past History of Ischemic Heart Disease n (%) |
39(17.4) |
68(19.6) |
0.51 |
Past History of Warfarin Use n (%) |
41(18.3) |
65(18.1) |
0.95 |
Past History of Anti-Platelet Use n (%) |
71(31.7) |
133(37.0) |
0.19 |
Pre-admission Modified Rankin Scale >2 n (%) |
49(21.9) |
119(33.1) |
0.00 |
Glasgow Coma Scale median (IQR) |
14.0(4.0) |
13.0(7.0) |
0.01 |
International Normalised Ratio median (IQR) |
1.1(0.2) |
1.1(0.2) |
0.20 |
Table2. Characteristics of included ICH patients
Variable |
N |
Median |
IQR |
Age |
224 |
68.5 |
17.0 |
Glasgow coma scale |
224 |
14.0 |
4.0 |
INR |
224 |
1.1 |
0.2 |
Volume of first CT |
224 |
11.7 |
25.6 |
Volume of Second CT |
224 |
15.4 |
30.9 |
Time lapsed between first CT and second CT |
224 |
20.7 |
21.4 |
Change in ICH Volume from first CT to second CT |
224 |
-0.2 |
6.6 |
The median age (IQR) was 68.5 years (17.0), 60.3% were male, median presentation Glaasgow Coma Scale (GCS) (IQR) was 14.0 (4.0), The median volume of CT 1 was 11.7 ml (IQR 25.6); the median volume of CT 2 was 15.4 ml, (IQR 30.9); the median INR was 1.1 (IQR 0.2); the median volume change from CT 1 to CT 2 was 0.2 ml (IQR 6.6); the median time change from CT 1 to CT 2 was 20.7 hours (IQR 21.4) ( Table 2).
We compared the baseline data between included and excluded patients. The following were statistically different: hypertension, age, pre-admission mRS, GCS (Table 1).
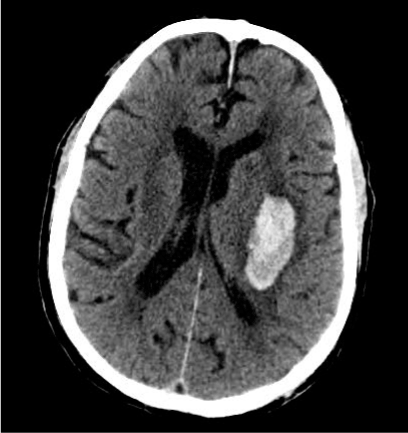
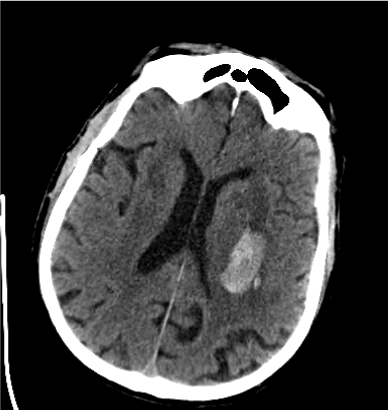
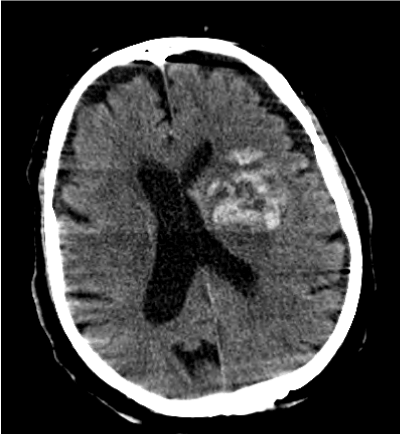
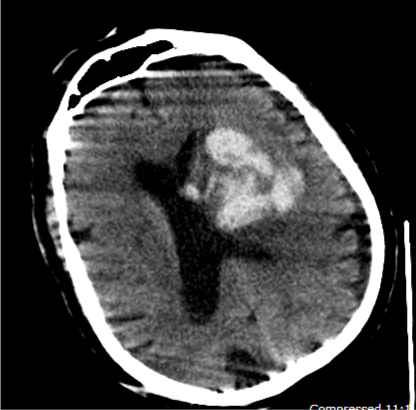
We explored the effects of INR on the volume changes. Assuming similar baseline volume and similar time since baseline CT, every 1 point increase in INR was associated with a median increase of 2.36 ml (95% CI 0.46 – 4.26, p= 0.024) in hematoma expansion measured as the change from baseline in volume (Figure 1-4). Given the imbalance in proportion of hypertension, pre-admission mRS, GCS and age between the included and excluded groups, we investigated the effect of INR adjusted for the variables by inclusion in the median regression model in addition to other covariates, the association between INR and hematoma growth remained significant with an effect size of 1.92 ml (95% CI 0.46- 3.37, p=0.01) (Table 3).

Figure 1. First CT Scan of the Patient with Lower INR Value (INR1.0)

Figure 2. Second CT Scan of the Patient with Lower INR Value (INR1.0)

Figure 3. First CT Scan of the Patient with Higher INR Value (INR5.4)

Figure 4. Second CT Scan of the Patient with Higher INR Value (INR5.4)
Table 3. Change in ICH Volume from first CT to second CT Median regression (50 percent)
Change in ICH Volume from first CT to second CT |
Coef. |
Std. Err. |
t |
P>|t| |
[95% Conf. Interval] |
Time lapsed between first CT and second CT |
-0.038 |
0.017 |
-2.27 |
0.02 |
-0.07 -0.00 |
Volume of first CT |
0.01 |
0.04 |
0.26 |
0.80 |
-.068 0.09 |
INR |
2.36 |
0.96 |
2.45 |
0.02 |
0.46 4.26 |
Discussion
In this study, we showed that INR was significantly associated with hematoma expansion.
ICH was initially considered a monophasic event whereby extravasation halted as a result of the combined effects of coagulation and tamponade [10]. However, subsequent studies demonstrated that hematomas expansion (HE) over time, which has been attributed to persistent extravasation from the primary source and to the mechanical disruption of surrounding vessels [11]. Although previous studies showed that HE predominantly occurred within 6 hours from symptoms onset [12], both frequency and timing of HE varied widely in other studies [11,13]. This may be due to different criteria for HE, as well as to the variability in the time from ICH onset to imaging [12].
Various definitions for HE has been used, ranging from any increase in hematoma size, to>33 % relative increase in size using the AxBxC/2 method on CT imaging [14]. Estimating the frequency of HE is largely dependent on the definition used and timing of imaging. Pooling data from studies focused on hematoma expansion utilizing similar definitions but heterogeneous imaging time points reveals that HE frequency ranges from 23 % – 38 % [15]. Taking timing into account, HE is detected in 13 % – 32 % of patients scanned within 6 hours of symptom onset [6], while scanning within 3 hours reveals HE of any degree in up to 73 % of patients, with “significant” expansion affecting one third of them [7]. The frequency decreases to 11 % for those presenting after 6 hours and 20 % for those with unknown exact time of ICH onset [16]. Early presentation is associated with higher likelihood of HE, suggesting strongly that HE as a therapeutic target is time sensitive and urgent [4].
The mechanisms of early hematoma growth are unclear but likely to be related to sudden increases in intracranial pressure (ICP), causing local tissue distortion and disruption, vascular engorgement secondary to obstructed venous outflow, blood-brain barrier disruption, and a local coagulopathy secondary to release of tissue thromboplastin [17].
Hematoma expansion is an important cause of early neurological deterioration, the severity of which depends on original hematoma size and subsequent expansion rate [17]. Each 10% enlargement of the hematoma resulting in a 5% increased hazard of death, and an increase of 16% in the likelihood of 1 point worsening on the modified Rankin Scale [18].
Several risk factors for hematoma expansion have been identified. Initial ICH volume is strongly associated with HE. Other risk factors include early presentation after symptom onset and use of anticoagulation [19].
ICH in patients on oral anticoagulant (OAT) is an increasing problem, with an annual estimated incidence of 0.25% to 1.1% [20]. In warfarin-associated ICH, up to 50% of patients develop hematoma expansion, but it appears to take place over a more prolonged period of time [21]. This has been observed in up to 56% of patients 66 occurring as far as 7 days’ post ictus [20].
INR is a standard measurement to estimate the intensity of anticoagulation, as many as 50% –90% of OAC-associated ICHs occur whilst the INR is within the therapeutic range [9]. Neither INR nor the time to correction of INR has been correlated with mortality, functional outcome, or enlargement of the ICH [22]. In addition, there have not been any previous reports of correlation between the INR value and volume [8].
The risk of ICH approximately doubles for each increase of 1 point in INR [17]. Higher INR values (>3.5) are directly correlated with OAT-associated ICH occurrence and the size of the hematoma on arrival to the hospital [20].
In a recent study, Flaherty et al. also reported that warfarin usage caused a significant increase in hematoma volume in the group whose INR values were over 3 among patients using warfarin [23,24]. Our result showed that INR levels were associated with increased HE. Accordingly, excessive anticoagulation may increase morbidity and mortality in patients with OAC-ICH [25].
The timing of imaging is essential when assessing hematoma expansion. Because expansion represents an intermediate phase between initial hematoma volume and the final (stabilized) volume, the ability to detect expansion depends on the point at which a patient is scanned within this timeframe [26]. The precise timeframe of hematoma expansion is uncertain. In addition, the time required to reach the nadir of maximum ICH volume remains undefined. Active bleeding is believed to last for minutes, supported by studies with radio-labeled erythrocytes injected into patients hours after ICH onset, revealing no change in hematoma activity after 2–5 h [27]. However, other studies have shown that while hematoma expansion is greatest in the subacute period, and HE can occur more than 6 h after onset, while no growth was observed between 24 and 48 h after onset [28]. Understanding the exact time frame of hematoma expansion, could help target interventions aiming to reduce growth and size. Though HE occurred in some ICH patients, most hematomas were absorbed little by little [29,30], our results displayed that time change also independent risk factor to volume change of ICH, reduce volume 0.96 ml per days, which was consistent with studies by Luo and Heng [29,30].
Hematoma volume, size, and diameter on admission have often been shown to significantly correlate with short term mortality. Several studies have also demonstrated that hematoma volume is a good predictor of long term mortality, beyond the acute period [28]. In addition, it is associated with poor functional outcome [18]. There is an association between initial hematoma volume and subsequent expansion: the larger the hematoma on presentation, the higher the risk of HE [4]. However, in our result, we did not find the relationship between initial volume and volume change.
Our study had several limitations. First, this was a retrospective study and may have introduced bias into the analysis. Second, the variable time from symptom onset to the first CT scan have also affected the measurement of ICH volume. In addition, several groups of patients were not included in the study. For example, patients who underwent surgical hematoma evacuation and those who died within 24 hours from symptoms onset were excluded. Of note, there was also a small percentage of patients with no blood test results of INR were also excluded.
Conclusion
In our study, we found a significant association between INR and hematoma expansion. This result may inform future design of therapeutic trials of intracerebral hemorrhage.
References
- Lovelock CE, Molyneux AJ, Rothwell PM (2007) Change in incidence and aetiology of intracerebral haemorrhage in Oxfordshire, UK, between 1981 and 2006: a population-based study. Lancet Neurol 6: 487-493. [Crossref]
- van Asch CJ, Luitse MJ, Rinkel GJ, van der Tweel I, Algra A, et al. (2010) Incidence, case fatality, and functional outcome of intracerebral haemorrhage over time, according to age, sex, and ethnic origin: a systematic review and meta-analysis. Lancet Neurol 9: 167-176. [Crossref]
- Sacco S, Marini C, Toni D, Olivieri L, Carolei A (2009) Incidence and 10-year survival of intracerebral hemorrhage in a population-based registry. Stroke 40: 394-399. [Crossref]
- Sonni S, Lioutas VA, Selim MH (2014) New avenues for treatment of intracranial hemorrhage. Curr Treat Options Cardiovasc Med 16: 277. [Crossref]
- Delcourt C, Huang Y, Arima H, Chalmers J, Davis SM, et al. (2012) Hematoma growth and outcomes in intracerebral hemorrhage: the INTERACT1 study. Neurology 79: 314-319. [Crossref]
- Dowlatshahi D, Demchuk AM, Flaherty ML, Ali M, Lyden PL, et al. (2011) Defining hematoma expansion in intracerebral hemorrhage: relationship with patient outcomes. Neurology 76: 1238-1244. [Crossref]
- Davis SM, Broderick J, Hennerici M, Brun NC, Diringer MN, et al. (2006) Hematoma growth is a determinant of mortality and poor outcome after intracerebral hemorrhage. Neurology 66: 1175-1181. [Crossref]
- Sousa LD, Zorrilla JP, Latini MF, Alvarez Abut P, Ayala M, et al. (2011) [Is the international normalised ratio a prognostic factor of mortality in intracerebral haemorrhage?]. Neurologia 26: 528-532. [Crossref]
- Curtze S, Strbian D, Meretoja A, Putaala J, Eriksson H, et al. (2014) Higher baseline international normalized ratio value correlates with higher mortality in intracerebral hemorrhage during warfarin use. Eur J Neurol 21: 616-622. [Crossref]
- Qureshi AI, Tuhrim S, Broderick JP, Batjer HH, Hondo H, et al. (2001) Spontaneous intracerebral hemorrhage. N Engl J Med 344: 1450-1460. [Crossref]
- Brott T, Broderick J, Kothari R, Barsan W, Tomsick T, et al. (1997) Early hemorrhage growth in patients with intracerebral hemorrhage. Stroke 28: 1-5. [Crossref]
- Rodriguez-Luna D, Rubiera M, Ribo M, Coscojuela P, Piñeiro S, et al. (2011) Ultraearly hematoma growth predicts poor outcome after acute intracerebral hemorrhage. Neurology 77: 1599-1604. [Crossref]
- Broderick JP, Diringer MN, Hill MD, Brun NC, Mayer SA, et al. (2007) Determinants of intracerebral hemorrhage growth: an exploratory analysis. Stroke 38: 1072-1075. [Crossref]
- Brouwers HB, Greenberg SM (2013) Hematoma expansion following acute intracerebral hemorrhage. Cerebrovasc Dis 35: 195-201. [Crossref]
- Adeoye O, Broderick JP (2010) Advances in the management of intracerebral hemorrhage. Nat Rev Neurol 6: 593-601. [Crossref]
- Brouwers HB, Falcone GJ, McNamara KA, Ayres AM, Alexandra Oleinik, et al. (2012) CTA spot sign predicts hematoma expansion in patients with delayed presentation after intracerebral hemorrhage. Neurocrit Care 17: 421-428. [Crossref]
- Elliott J, Smith M (2010) The acute management of intracerebral hemorrhage: a clinical review. Anesth Analg 110: 1419-1427. [Crossref]
- Brouwers HB, Goldstein JN (2012) Therapeutic strategies in acute intracerebral hemorrhage. Neurotherapeutics 9: 87-98. [Crossref]
- Brouwers HB, Greenberg SM (2013) Hematoma expansion following acute intracerebral hemorrhage. Cerebrovasc Dis 35: 195-201. [Crossref]
- Provencio JJ, Da Silva IR, Manno EM (2013) Intracerebral hemorrhage: new challenges and steps forward. Neurosurg Clin N Am 24: 349-359. [Crossref]
- Goldstein JN, Greenberg SM (2010) Should anticoagulation be resumed after intracerebral hemorrhage? Cleve Clin J Med 77: 791-799. [Crossref]
- Zubkov AY, Mandrekar JN, Claassen DO, Manno EM, Wijdicks EF, et al. (2008) Predictors of outcome in warfarin-related intracerebral hemorrhage. Arch Neurol 65: 1320-1325. [Crossref]
- Celikbilek A, Goksel BK, Zararsiz G, Sibel Benli (2013) Spontaneous intra-cerebral hemorrhage: A retrospective study of risk factors and outcome in a Turkish population. J Neurosci Rural Pract 4: 271-277. [Crossref]
- Flaherty ML, Tao H, Haverbusch M, Sekar P, Kleindorfer D, et al. (2008) Warfarin use leads to larger intracerebral hematomas. Neurology 71: 1084-1089. [Crossref]
- Cervera A, Amaro S, Chamorro A (2012) Oral anticoagulant-associated intracerebral hemorrhage. J Neurol 259: 212-224. [Crossref]
- Brouwers HB, Greenberg SM (2013) Hematoma expansion following acute intracerebral hemorrhage. Cerebrovasc Dis 35: 195-201. [Crossref]
- Herbstein DJ, Schaumburg HH (1974) Hypertensive intracerebral hemorrhage: an investigation of the initial hemorrhage and rebleeding using chromium Cr 51-labeled erythrocytes. Arch Neurol 30: 412–414.
- LoPresti MA, Bruce SS, Camacho E, Kunchala S, Dubois BG, et al. (2014) Hematoma volume as the major determinant of outcomes after intracerebral hemorrhage. J Neurol Sci 345: 3-7. [Crossref]
- Luo G, Chen Y, Liu Y (2011) Factors affecting hematoma absorption in patients with primary intracerebral hemorrhage. Chin J Cerebrovasc Dis 8: 463-468.
- Heng W, Xu Y, Zhang X (2013) Model for predicting hematoma absorption rate of the spontaneous intracerebral hemorrhage. Chin J Clinicians 7: 6265-6269.


