euregulin/erbB signalling is cardioprotective as seen in models of cardiotoxicity associated with the use of chemotherapeutics. Our studies reveal a function of Bcl-2 to protect cardiomyocytes concomitant with GGF2-induced increases in levels of phospho-BAD (pBAD) along with activation of PI3 kinase (PI3K) and MAP kinase (MAPK). We show that phosphorylation of BAD is dependent upon GGF2 mediated activation of PI3K. In addition, examination of mitochondrial gene expression shows several members of the Bcl-2 family are down-regulated by doxorubicin, while GGF2 is able to reverse this effect. While many in vitro model systems of doxorubicin cardiotoxicity have observed PI3K-dependent cytoprotective effects of neuregulin’s, the present results demonstrate that GGF2 mediates cytoprotective actions in HL-1 cardiomyocytes through regulation of mitochondrial mediated apoptosis via the PI3K/Bcl-2 pathway
Neuregulin’s; apoptosis; cardiomyocytes; Bcl2; AKT
The neuregulin’s (NRG) comprise a family of four related genes within the EGF superfamily that encode trophic factors. Neuregulin’s have been shown to be critical in development and maintenance of the nervous and cardiovascular system [1,2]. Neuregulin 1 (NRG1) has at least 6 isoforms derived from alternative splicing and the Type II form is known as Glial Growth Factor 2 (GGF2; USAN: cimaglermin alfa). GGF2 plays a role in tissue development and homeostatic maintenance throughout life [3,4]. Neuregulin’s exert their effects through selective binding to erbB3 and erbB4, which may either homodimerize or heterodimerize with their preferred binding partner, the erbB2 receptor. These dimers mediate complex downstream molecular signalling that regulates cell metabolism and other cellular responses. In developing and adult cardiomyocytes, erbB2 and erbB4 are the predominantly expressed erbB receptors while NRG1 is expressed in the endocardium and cardiac microvascular endothelial cells [5,6]. The importance of NRG1 ligands and their receptors in cardiac development was elucidated using targeted disruption of NRG1, erbB2 or erbB4 genes [5,7,8]. Loss of function for any of these 3 genes creates an embryonic lethal phenotype with disrupted trabeculation in the ventricular muscle. In vitro evidence that neuregulin’s and their receptors contribute to proper functioning of adult cardiomyocytes was demonstrated in several studies related to survival [9-11], proliferation [6], hypertrophy [12], myofibrillar organization [12,13] and, more recently, their role in sympathovagal control in the heart [14,15]. GGF2 was found to promote survival and hypertrophy of adult rat ventricular cardiomyocytes [6]. Additional key findings that support a role of erbB function to maintain adult cardiomyocytes come from clinical observations of enhanced cardiotoxicity in breast cancer patients treated with a class of chemotherapy drugs called anthracyclines. Anthracyclines such as doxorubicin or daunorubicin when used on their own caused heart damage in 8% of breast cancer patients [16]. Patients that were on an anthracycline regimen in conjunction with trastuzumab, a monoclonal antibody against erbB2, while showing enhanced clinical benefits in metastatic breast cancer, also had a dramatic increase in cardiac dysfunction (27%), strongly suggesting a role for erbB2 and NRG1 ligands in cardiac function [17]. Ventricular restricted conditional erbB2 knock out mice also display severe cardiomyopathy and are more susceptible to doxorubicin toxicity [18]. Thus, inhibition or loss of erbB2 signalling increases risk of cardiotoxicity, confirming the role of erbB and its ligands in adult cardiomyocyte health.
Several mechanisms have been proposed for the deleterious effects of anthracyclines, including mitochondrial dysfunction, increased reactive oxygen species (ROS) production, iron accumulation in mitochondria, and finally cell death by apoptosis or necrosis [19]. Because doxorubicin and other anthracyclines are widely and successfully used as chemotherapeutic agents to treat a variety of cancers [20], the associated cardiovascular complications such as dilated cardiomyopathy and cardiac dysfunction, which ultimately lead to heart failure, have led to investigation of NRG1 actions in cardiac systems as a very active research area [21,22]. NRG1 activates the PI3 kinase (PI3K) and the MAP kinase (MAPK) signalling pathways as measured by formation of pAKT and pERK1/2 in vivo and in cultured cardiomyocytes [10,12]. Activation of these pathways leads to multiple downstream processes, including cell survival, sarcomeric reorganization, improved contractility and electrico mechanical coupling [14,23]. Growth factor induced activation of AKT is associated with many cellular effects, including enhanced cell survival [reviewed in [24]. AKT has been shown to antagonize pro-apoptotic actions of Bcl-2 family members through stabilization of the mitochondrial permeability transition pore (mPTP) [25]. NRG-1 has been shown to inhibit mPTP opening in a PI3K dependent manner in neonatal rat and human cardiomyocytes under peroxide oxidative stress [26]. Neuregulin’s have been shown to inhibit doxorubicin induced autophagy and increase Bcl-2 expression [27,28]. Taken together, these studies point to a role for neuregulin’s in modulating mitochondria mediated apoptosis. The capacity of NRG1 to protect both adult and neonatal cardiomyocytes from doxorubicin induced toxicity has been studied with both in vitro and in vivo systems [10,13,29]. However, the mechanism by which this occurs has not been fully elucidated. Using an in vitro system to study GGF2 protection of doxorubicin treated HL-1 cardiomyocytes we show that GGF2 facilitates cytoprotection by regulating the Bcl-2-BAD pathway and expression of genes related to mitochondrial function. Regulation of this response is dependent upon GGF2 mediated activation of the PI3-kinase pathway.
HL-1 cell culture
HL-1 cells are derived from the AT-1 mouse atrial cardiomyocyte tumour lineage and were obtained from Dr. W. Clay comb. Cells were cultured in plates pre-coated with gelatine/fibronectin (overnight incubation at 37°C with 0.5% fibronectin in 0.02% gelatine solution). Cells were maintained in growth medium (Clay comb media Sigma Cat # 51800C supplemented with 10% Foetal Bovine serum, 0.1 mM Norepinephrine [(±)-Arterenol], 2 mM L-Glutamine and Penicillin/Streptomycin 100 U/ml) in a humidified, 37°C tissue culture incubator with 5 % CO2 atmosphere.
Cardiomyocyte doxorubicin assay
HL-1 cells were plated at 75,000 cells per well in 0.1 mL of growth medium in 96-well microtiter plates and cultured overnight at 37°C in a humidified, 5% CO2 atmosphere and for all subsequent incubations. Cells were then conditioned in a serum-free version of growth medium for 6 hours to better distinguish effects of GGF2 from those of serum components. Test samples and controls were added at the reported concentrations in serum-free media. After a 1-hour pre-treatment of the serum-free adapted cells with vehicle or GGF2, cells were treated with vehicle or doxorubicin (Catalent Pharma Solutions, Somerset, New Jersey, supplied as a 2 mg/mL solution that is diluted in media to experiment specific concentrations), and incubated for 18 hours. Cell viability, as measured by the reductive capacity of HL-1 cell mitochondria, was determined using the tetrazolium dye 3-(4,5-dimethylthiazol-2-yl)-2,5-diphenyltetrazolium bromide (MTT), which is reduced to formazan (MTT Assay, Cat. No. M5655, Sigma-Aldrich, Inc). MTT assay substrate (stock solution of 5 mg/mL in PBS) was added to the cells at a final assay concentration of 0.45 mg/mL. Following a 30-minute incubation, the medium was removed and cells were lysed with stop solution (50% v/v dimethylformamide solution containing 20% w/v SDS). After 1 hour of incubation at room temperature with shaking, the optical density (OD) of sample well was measured on a plate reader (Molecular Devices M2, MTX Lab Systems, Inc) at wavelengths of 570 nm for the resulting solubilized formazan dye and 650 nm for an internal reference. In the kinase inhibition experiments, inhibitors were added 1 hour prior to GGF2 treatment. The PI3K inhibitor LY294002 and MAPK inhibitor U0126 (Cell Signalling Technologies catalog numbers 9901 and 9903S, respectively) were dissolved in dimethyl sulfoxide (DMSO) and used at final concentrations of 10 μM. ABT737, a Bcl-2 inhibitor was used at 50 nM, dissolved in DMSO. In experiments where inhibitors were used, DMSO was included in the controls. The cytoprotective actions of GGF2 as measured by MTT labeling is reported as a percentage of MTT labeling relative to levels lowered by doxorubicin treatment, using the following formula:
CYTOPROTECTION = (OD570GGF2 - OD570DOX)/(OD570BASAL - OD570DOX) *100, where OD 570BASAL is MTT labelling under basal, vehicle treatment conditions, OD570DOX is the MTT labeling level observed in cultures treated with doxorubicin alone and OD570GGF2 is MTT labeling level observed in cultures pre-treated with GGF2 followed by doxorubicin.
HL-1 pAKT and pERK assay
HL-1 cells were plated at 75,000 cells/well in 0.1 mL growth medium as described above. Cultures were adapted to serum-free conditions prior to assay by incubation for 6 hours in 0.1 mL per well of serum-free media at 37°C and 5% CO2 in a humidified incubator. Serial dilutions of GGF2 were prepared in serum free media. For experiments where kinase signaling was measured, 50 µL of GGF2 solution (prepared at 3-times final assay concentration) was dispensed per assay plate well. For PI3K inhibition experiments, the inhibitors were added 1 hour prior to GGF2 addition. Following a ten minute GGF2 response interval at 37°C, treatment media were removed from wells, cells were lysed by addition of 75 µL per well of lysis buffer (CisBio), and plates were shaken gently at room temperature for 30 minutes. Abundance of pAKT or pERK1/2 in lysates was determined using time-resolved fluorescence resonance energy transfer (TR-FRET)-based sandwich immunodetection methods (CisBio catalog numbers 64AKSPEH or 64ERKPEG, respectively). Lysate (16 ml) was combined with 4 µL of the TR-FRET conjugate buffer mixture (mixture of 2 µl each of D2- and europium-conjugated anti-pAKT or anti-pERK antibodies in detection assay buffer) in low-volume 384 well white plates. Lysate-TR-FRET conjugate reactions were incubated at room temperature with gentle shaking for 2.5 to 4 hrs, followed by measurement of time-resolved lanthanide fluorescence at 620 nm (donor wavelength) and 665 nm (acceptor wavelength) using a Biotek Synergy 2. Data are depicted as a ratio of 665/620 *10,000. Estimates of GGF2 potency are obtained from curve fits generated using the following model: Y=Bottom + (Top-Bottom)/(1+10^((LogEC50-X) *HillSlope), where X = GGF2 concentration in log10-transformed M units, Y = measured HTRF ratio (i.e. proportional to pAKT or pERK1/2 abundance), Bottom = extrapolation to the low plateau of measured HTRF ratio, Top = extrapolation to the high plateau of measured HTRF ratio and EC50 is the concentration of agonist that produces half-maximal response. All curve fit analyses were performed using Graph Pad Prism, version 5.02.
Average EC50 of multiple experiments was calculated as 10^ (average log EC50). EC50 standard error of the mean (SEM) is calculated as follows: SEM(EC50) = (10 ^ Log EC50) * SEM (Log IC50) * ln (10), where SEM (Log IC50) = standard deviation (Log IC50) /[square root (n-1)] and ln(10) = 2.30258509.
ErbB expression
ErbB receptor expression and phospho-BAD were analyzed using capillary based electrophoresis (WES system, Protein simple). HL-1 cells were lysed in RIPA buffer and 50 nL of lysate (10-100 µg/mL) was run per lane. In this system, ErbB antibodies were used at 1:20 dilution and were obtained from Cell Signaling Technologies (CST) or Abcam [Cat #; EGFR: CST 2646S; ErbB2 CST 4290; ErbB3 CST 12708; ErbB4 Abcam Ab2995]. Phospho-BAD (pBAD) was measured using an anti-Ser136 phospho BAD antibody (CST # 185D10).
Mitochondria related gene expression array.
HL-1 cells (cultured as described above) were treated with GGF2, doxorubicin alone or doxorubicin in combination with GGF2. Cells were lysed with RNA lysis buffer after 18-22-hour treatment with test reagents. Total cellular RNA was isolated, treated with DNase I and purified using RNeasy Mini kit (Qiagen Cat #74104) following manufacturer’s instructions. First strand cDNA was synthesized using 500 ng of RNA (RT² First Strand Kit, Qiagen, Cat #330401) following manufacturer’s instructions. Gene expression was measured with a mouse mitochondrial PCR array plate and qPCR master mix (Qiagen PAMM-087ZC-12 and 330522) using SYBR-quantitative real-time PCR. The qPCR was performed in the 7500 Fast PCR System (Applied Biosystems) following manufacturer’s instructions. Two plates for each treatment condition were used as replicates for PCR data analysis. Sample quality was assessed using A260/280 ratios of 1.9-2.1. All the samples passed the reverse transcription control and genomic DNA contamination control. PCR values were normalized to the Ct value from average of five housekeeping genes (β-actin, GAPDH, and β Glucuronidase, B2m and Hsp90ab1) to obtain ΔCt. To calculate fold change, we used the following formula: fold change = 2(-ΔΔCt), where ΔΔCt was obtained using the vehicle treated sample as the comparative control. For graphical presentation, fold-regulation was reported as the negative inverse of the fold-change to depict up or down gene regulation. For confirmatory analysis by qPCR on select genes, independent experiments were performed where total cellular RNA was extracted with RNAqueous-96 kit (Ambion #AM1920) following manufacturer’s instructions. To elute RNA, 60uL of nuclease free water per well was added to the filter plate and centrifuged at 1500xg for 5 minutes. RNA concentration and quality were assessed using BioTek Take 3 program. cDNA synthesis is performed using High Capacity cDNA Kit (Applied Biosystems, #4368813) following manufacturer’s instructions. 100 ng of RNA was used per cDNA synthesis reaction. Quantitative PCR (qPCR) reaction was performed in the 7500 Fast PCR System (Applied Biosystems) using predesigned TaqMan Gene Expression Assays (Applied Biosystems #4369510) targeting human Bcl-2 (Mm00477631_m1) mRNA, Bbc3 (Mm00519268_m1), Bnip3 (Mm01275600_g1) and GAPDH (4326317E) was used as an endogenous control. Three independent experiments were performed with each treatment condition performed in duplicate assay wells per experiment. Expression of target mRNA was quantified relative to that of the GAPDH mRNA. After ΔCT values were determined for each replicate (Ct test - Ct GAPDH), fold change was calculated comparing GGF2 and/or doxorubicin treated samples to its control using the following formula: fold change = 2(-ΔΔCt). Data were averaged from three independent experiments.
GGF2 mediates cytoprotection in HL-1 cells
Doxorubicin is a commonly used chemotherapeutic agent with a known cardiotoxicity profile involving multiple cellular pathways. To elucidate mechanisms of GGF2’s cytoprotective actions in cardiomyocytes, we established an experimental system designed to measure GGF2 attenuation of doxorubicin cytotoxicity in HL-1 cells. Cells were serum deprived for 6 hours followed by pre-treatment with either GGF2 or vehicle for an hour before incubating an additional 18 hours with doxorubicin (0.1 to 100 µM). Cell health was assessed after doxorubicin exposure using MTT dye, which labels cells in proportion to metabolic activity. In the absence of GGF2, a dose dependent effect of doxorubicin of reduced MTT labelling was observed (Figure 1A). In cultures pre-treated with 100 ng/mL GGF2, the cytotoxic effect of doxorubicin was reduced, as evidenced by increased MTT labeling from OD570 of 0.19 to 0.51 in the presence of 10 mM doxorubicin and from OD570 of 0.10 to 0.46 in the presence of 100 mM doxorubicin. When considered as percent of recovery from the MTT labeling level observed in cells treated with doxorubicin alone (see formula in Materials and Methods) the GGF2 effect increased cell viability by 50% for cultures treated with 10 mM doxorubicin and by 44% for cultures treated with 100 mM doxorubicin. All subsequent studies, designed to investigate mechanism of GGF2’s cytoprotective effects in HL-1 cells, utilized treatment with 10 µM doxorubicin for 18 hours to induce cytotoxicity. This protective effect of GGF2 was also dose-dependent (Figure 1B). The average EC50 for GGF2 was 30.2 ± 8.16 pM (mean, ± SEM, n=19 experiments) (Table 1). The maximal effective concentration or the concentration at which the highest protection was observed is also reported in Table 1.
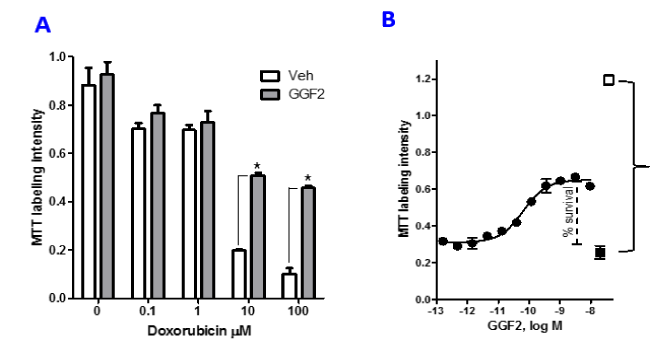
Figure 1. GGF2 protects HL-1 cells from doxorubicin toxicity. HL-1 cells were exposed to doxorubicin insult for 18 hours, with or without 1 hour pre-treatment with GGF2 and were labeled for MTT. (A): Histogram of dose-response for the effects of Doxorubicin (dox) on cell survival in the absence or presence of 100 ng/mL GGF2 (*= p<0.0001). (B): Dose-response for the protective effect of GGF2 with exposure to 10 uM dox. The open square shows the no dox treatment control, the black square is the doxorubicin only treatment and the black circles show represent pretreatment with GGF2 for 1 hour at concentrations between 0.003 and 500 ng/mL (graphically represented in Log M scale) followed by doxorubicin for 18 hours. MTT labeling is reported as OD570 values.
GGF2 potentiates pAKT and pERK formation
To identify the neuregulin receptor types that are expressed in HL-1 cells, capillary gel electrophoresis was performed, followed by probing for the four erbB receptor subtypes. All four erbB receptor sub-types could be detected in HL-1 cell lysates, with erbB2 showing the most reactivity (Figure 2A) and the other three receptor subtypes present at lower levels. Also, two immunoreactive erbB4 bands were observed, one at 170kDa and another at 65 kDa. Neuregulin’s are known to signal through the PI3K and MAPK pathway. To ascertain how HL-1 cells respond to GGF2 we measured phosphorylation of AKT at Ser 473 (pAKT) and ERK1/2 at Thr202/Tyr204 (pERK). Using TR-FRET methods that measure the phosphorylated form of AKT, there was a concentration dependent increase in pAKT formation. A typical dose response curve is shown in Fig2B. The average GGF2 EC50 was 43.6 pM ± 4.2 (mean, ± SEM, n=12) (Figure 2B, Table 1). Similarly, pERK was reliably measured from the same lysates with average EC50 of 0.87 pM ± 0.48 (mean, ± SEM, n=10) (Figure 2C, Table 1). These results indicate that GGF2 activates both pathways in HL-1 cardiomyocytes and has a ~ 50-fold higher potency for increasing levels of pERK compared to pAKT.
Table 1. The mean EC50 and SEM for GGF2 effects on cell survival and AKT and ERK phosphorylation were calculated for multiple independent experiments, based on a four-parameter curve fit. The maximally effective concentration reported is defined as the GGF2 concentration producing the largest magnitude response.
EC50 pM (mean+SEM) |
Maximal Effective Concentration, pM (range) |
MTT assay |
pAKT |
pERK |
MTT assay |
pAKT |
pERK |
30.18 ± 8.16 |
43.6 ± 4.2 |
0.87 ± 0.48 |
117-1047 |
355-3160 |
631-2400 |
19 |
12 |
10 |
19 |
12 |
10 |
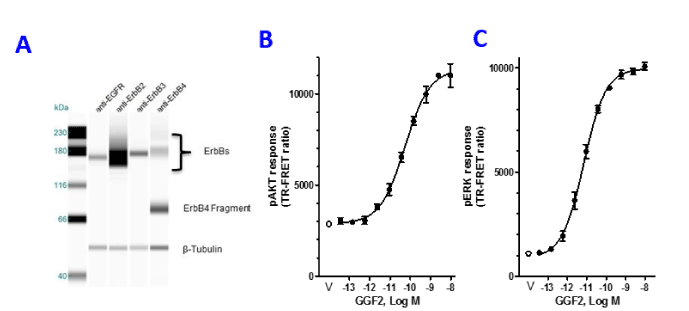
Figure 2. GGF2 activates AKT and ERK pathway and protects cardiomyocytes from doxorubicin toxicity. (A): Cell lysates from HL-1 cells were subjected to capillary electrophoresis followed by probing for the different erbB receptors. HL-1 cells express all four erbBs. (B & C): HL-1 cells were serum starved for 6 hours followed by 10-minute stimulation with GGF2 over a range of concentrations (0.003-500 ng/mL, converted to Log M values). Cells were lysed and probed for pAKT and pERK formation using TR-FRET. A dose response curve was obtained for pAKT and pERK formation (black circles). The open circles represent vehicle control.
GGF2 protection from Doxorubicin toxicity is dependent upon PI3K
Since GGF2 activates both the PI3K and MAPK pathways, we asked whether both are essential for GGF2 mediated survival. PI3K inhibitors LY294002 and Wortmannin and the MAPK inhibitor U0126 were used to study the contribution of these pathways to the cytoprotective actions of GGF2. Effects of the inhibitors on MTT labelling in the presence and absence of doxorubicin is shown in Figure 3A. In the absence of doxorubicin treatment there was no significant difference in MTT labelling between the groups. Pre-treatment of HL-1 cells with LY294002 and Wortmannin before doxorubicin exposure produced slight but significant decreases in MTT labelling compared to vehicle controls (Student’s t-test, p= 0.00005). Interestingly, presence of U0126 resulted in a significant increase in MTT labelling in doxorubicin treated cells by 20% (Student’s t-test p= 0.00006), suggesting a role of MAPK signalling in protection from doxorubicin cytotoxicity, independent of GGF2. The roles of PI3K and MAPK pathways in mediating cytoprotective actions of GGF2 were then examined in HL-1 cells that were pre-incubated with PI3K inhibitors LY294002 or Wortmannin, or the MAPK inhibitor, U0126 for one hour followed by treatment with GGF2 for one hour and then doxorubicin for 18 hours (Figure 3B). In DMSO vehicle treated cultures the maximal cytoprotective effect of GGF2 resulted in restoration of MTT labelling to 35% of the level in control cells not treated with doxorubicin. In the presence of LY294002 or Wortmannin, the maximal cytoprotective effect of GGF2 was reduced to 19% or 16% recovery of their respective maximal MTT labelling levels (control cells not treated with doxorubicin, Figure 3B). The MAPK inhibitor U0126 did not diminish GGF2’s cytoprotective action as MTT labelling levels at a maximally effective GGF2 concentration reflected cell viability equivalent to 30% of control cells not treated with doxorubicin, a level similar to cells not treated with inhibitors. The effectiveness of the inhibitors was assessed by measuring pAKT and pERK formation. As expected, both LY294002 and Wortmannin dramatically reduced GGF2 mediated pAKT formation (Figure 3C), but did not affect pERK formation (Figure 3D). Surprisingly, the MAPK inhibitor U0126 increased GGF2 mediated pAKT formation compared to the vehicle control treatment condition. Measurements of pERK formation show that U0126 pre-treatment abolished pERK formation as expected while responses in presence of LY294002 or Wortmannin were similar to no inhibitor control (Figure 3D).
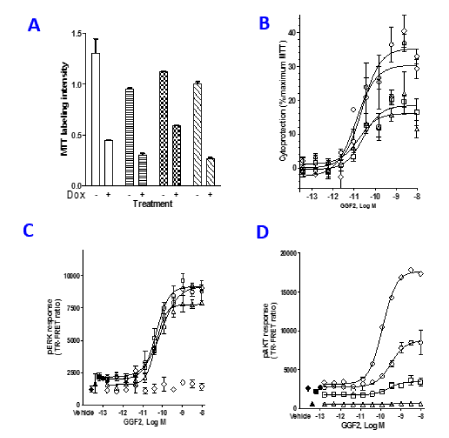
Figure 3. GGF2 requires pAKT formation to elicit cytoprotection. (A): HL-1 cells were pre-incubated with Vehicle or PI3K inhibitors, 10 µM LY294002 or 1 µM Wortmannin, or the MAPK inhibitor U0126 at 10 µM. Baseline MTT labeling for the doxorubicin and untreated controls is shown for each treatment condition and was used to calculate percent survival. The open bars are Vehicle controls. LY294002 are shown in horizontal lines, U1026 is shown as checkered bars and the hash line bars represent Wortmannin controls. (B): HL-1 cells were pre-incubated with Vehicle (open circle) or PI3K inhibitors, 10 µM LY294002 (open square) or 1 µM Wortmannin (open triangle), or the MAPK inhibitor U0126 at 10 µM (open diamond) followed by GGF2 and 10 µM doxorubicin. MTT labeling was performed at 18 hours’ post incubation. The data are presented as percentage survival for each condition. (C&D): pAKT and pERK formation were tested after one hour pre-treatment with inhibitors followed by 10 minutes’ exposure to GGF2 to confirm effects of the inhibitors. The open symbols are the same as B and the closed symbols are the respective baselines. The data shown is a representative of 4-7 independent experiments.
Table 2 summarizes results from 4-7 independent experiments. Students’ t-tests performed to compare vehicle control to individual inhibitors indicated that MTT labelling levels were significantly different from control in the LY294002 or Wortmannin-treated cells (p < 0.00001), shown with an * in Table 2. The MAPK inhibitor U0126 showed less effect on GGF2 mediated cytoprotection, lowering MTT labelling from 38% to 29%, which was not found to be significantly different (Table 2). On the other hand, U0126 increased GGF2 potency, decreasing EC50 from 15.3 to 4.7 pM (p < 0.01).
Table 2. Summary of results from effects of PI3K and MAPK inhibitors on survival, pAKT and pERK formation. Average percent survival (Mean ± Std Dev) was calculated from 4-7 independent assays. EC50s for cell survival, pAKT and pERK formation is shown as Mean ± SEM Between 4-7 independent experiments were performed. In all instances of pAKT measurements, no curves were obtained for Wortmannin treatment conditions (*=p<0.05 between inhibitor and vehicle.
GGF2+ |
Avg % Survival |
MTT EC50 pM |
pAKT EC50 pM |
pERK EC50 pM |
Veh |
37.66 ± 4.97 |
15.3 ± 3.68 |
201 ± 67.1 |
28.1 ± 17.1 |
LY294002 |
15.49 ± 4.16* |
10.4 ± 3.99 |
256 ± 128 |
18.5 ± 12 |
Wortmannin |
17.91 ± 5.91* |
|
|
44.7 ± 23.3 |
U0126 |
29.31 ± 0.73 |
4.65 ± 5.44 |
117 ± 4.33* |
731 ± 1560 |
GGF2 regulates apoptotic pathway
To further investigate GGF2 actions to promote cell survival we explored involvement of Bcl-2 using the Bcl-2 homology domain (BH3) mimetic, ABT-737 that neutralizes Bcl-2 and Bcl-xL. Treatment with inhibitor alone did not affect viability of serum starved cells, but appeared to have a synergistic effect, increasing cytotoxicity when combined with doxorubicin (Figure 4A). GGF2’s ability to protect cells from doxorubicin toxicity was severely compromised in the presence of ABT-737, as seen by a decrease in MTT labelling to less than 5% of control, an effect similar to that of the PI3K inhibitor, LY294002. The pAKT and pERK responses were measured in the presence of the Bcl-2 inhibitor and were not statistically different between treatments (Figure 4B, Figure 4C). Table 3 is a summary of four experiments, showing that ABT737 reduced GGF2 mediated cytoprotection from 51% to 12%. The average EC50 for pAKT and pERK formation were not significantly different between vehicle and inhibitor treated samples.
Table 3. A summary of average percent survival and EC50s for pAKT and pERK formation were obtained for cells exposed to the Bcl-2 inhibitor, ABT 737 or the PI3K inhibitor LY294002. The percent recovery for both ABT 737 treated and LY294002 were significantly different from the no inhibitor control as denoted with an asterisk (p<0.01). All others comparisons were not found to be statistically significant.
GGF2 + |
Average % Survival |
pAKT EC50 pM |
pERK EC50 pM |
Vehicle |
51 ± 10.5 |
40.19 ± 15.02 |
9.3 ± 4.07 |
LY294002 |
17 ± 8.9* |
54.46 ± 24.01 |
7.08 ± 2.78 |
ABT737 |
12 ± 5.4* |
28.84 ± 8.58 |
5.49 ± 2.97 |
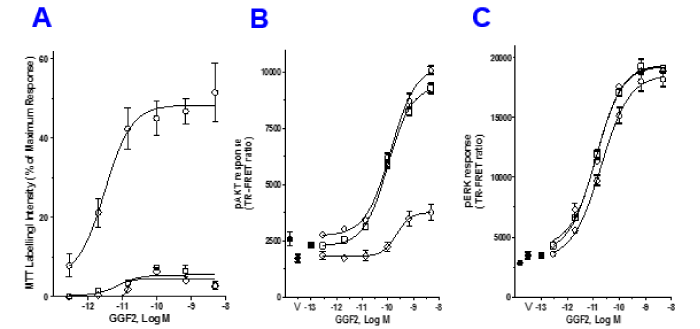
Figure 4. GGF2 requires Bcl-2 to mediate cytoprotection. (A): HL-1 cells were pre-incubated with the Bcl-2 inhibitor ABT 737 (open squares) or Vehicle (open circles) followed by GGF2 for 1 hour and doxorubicin. MTT labeling was performed after 18 hours of doxorubicin treatment. The PI3K inhibitor, LY294002 (open diamonds) was included for comparison. The percent MTT labeling for each condition is shown in the graph. In these experiments, GGF2 in the presence of DMSO showed a 48% recovery while presence of ABT 737 reduced it to 4.9% similar to LY294002. (B & C): After 1 hour pre-treatment with the either ABT 737 (open squares) or LY294002 (open diamonds), pAKT and pERK formation were tested at 10 minutes’ post GGF2 treatment to assess the effect of the inhibitor on upstream phosphorylation events. The respective vehicle controls are shown with closed symbols.
GGF2 mediates BAD phosphorylation via PI3K activation
Levels of phosphorylated BAD (pBAD), another key player in the apoptotic pathway, were measured to further understand the downstream signaling events that are influenced by GGF2 to promote cell survival. HL-1 pBAD levels, measured using an anti-phospho-BAD Ser136 antibody, increased by 3.5-fold with a 10 minute GGF2 treatment, when compared to untreated control cells (Figure 5A and 5B). To determine how GGF2 mediated phosphorylation of BAD involves HL-1 phospho-signalling, cells were incubated with inhibitors of PI3-kinase, MAPK and Bcl-2. Cells were stimulated with GGF2 in the presence of these inhibitors and assessed for pBAD by capillary based immunodetection. Pre-treatment with LY294002 decreased pBAD formation response to only 2-fold over vehicle treated controls. Inhibition of MAPK and Bcl-2 resulted in a 3 and 4-fold increase in pBAD formation over vehicle respectively. The baseline levels of pBAD in the presence of just the inhibitors were not statistically different from each other, even though there was a trend for ABT-737 treated samples to be slightly higher. Our results confirm that GGF2 mediates anti-apoptotic actions by phosphorylating AKT and BAD and requires Bcl-2 (see schematic, Figure 5C) thereby promoting cell survival.
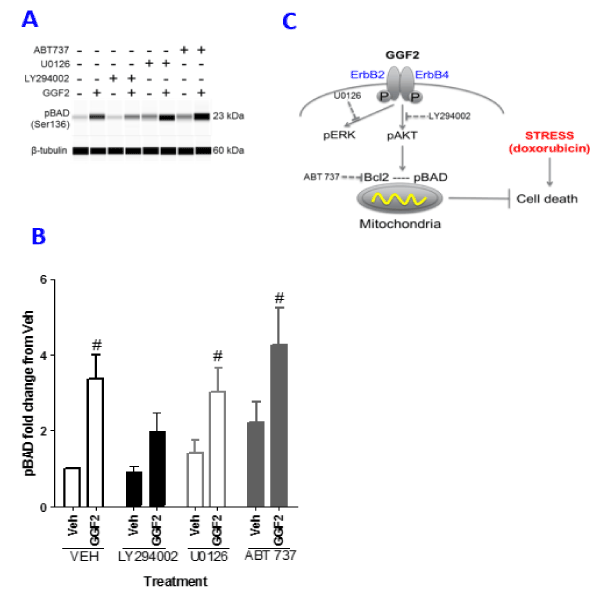
Figure 5. GGF2 mediates phosphorylation of BAD through AKT. (A): HL-1 cells were stimulated with GGF2 or vehicle (Veh) for 10 minutes followed by analysis of pBAD Ser 136 formation by capillary electrophoresis. Inhibitors for Bcl2 (ABT737), PI3K (LY294002), MAPK (U0126) were incubated for 1 hour prior to GGF2 exposure. (B): An average of three experiments is represented in the graph. Student t-test was performed comparing treatments to vehicle, noted with # (p<0.05). (C): A schematic of GGF2 action in doxorubicin treated cardiomyocyte. GGF2 activates the PI3K pathway to block apoptosis via members of the Bcl-2 family of proteins. The inhibitors and the pathway they affect are also shown.
GGF2 alters expression of genes involved in apoptosis
To assess if GGF2 influences the apoptotic pathway, not just by regulating phosphorylation states of signaling molecules but also by gene expression changes, we used a mitochondria specific PCR array that assesses expression of genes involved in mitochondrial function, including apoptosis, metabolite transport, and membrane potential. Cells were treated with GGF2 +/- doxorubicin for 18 hours followed by PCR amplification using a commercially available PCR array (Qiagen). Amplification was performed and gene expression was calculated as fold regulation for each condition as described in the methods. Of the 84 genes assayed across the array we focused on those known to be involved in apoptosis as those were observed to be most responsive to GGF2 treatment (Figure 6). GGF2 alone caused modest changes in gene expression with fold changes of less than 2 for all 14 apoptosis-related genes tested (Figure 6A). Doxorubicin treatment resulted in down regulation of all but 3 of the 14 apoptosis-related genes, with changes ranging from 2-25-fold. Presence of GGF2 during doxorubicin treatment resulted in many of the genes returning back towards baseline, suggesting that GGF2 brings expression back towards normal (Figure 6C). Focusing primarily on the Bcl-2 family of genes that are influenced by GGF2, we performed independent confirmatory experiments by qPCR measuring changes for Bcl-2, Bbc3, Bcl-21, Bid and Bnip3. GGF2 positively regulates Bcl-2 (2.3 fold), Bbc3 (1.9 fold) and Bid (1.9 fold) while marginally influencing Bnip3 and Bcl-21 (Figure 6D). Doxorubicin disrupts expression of all of these genes while co-treatment with GGF2 brings their expression back towards baseline. The qPCR results confirm findings from the array and show that the effect of GGF2 is to change gene expression towards levels observed in healthy cells, thereby counteracting doxorubicin-induced gene expression changes.
The data from these studies show that GGF2 antagonizes doxorubicin induced toxicity in a cardiomyocyte cell line by regulating members of the Bcl-2 family. We show for the first time that GGF2 mediates cytoprotection in cardiomyocytes by modulating phosphorylation of AKT and BAD and reverting expression of the Bcl-2 family of genes towards normal levels, away from the altered profile of expression observed after exposure to doxorubicin. This represents an anti-apoptotic action of GGF2. Cell survival can be achieved by activation of pro-survival pathways and/or inhibition of apoptosis. The Bcl-2 family of proteins are key regulators of these processes and function downstream of AKT. The role of AKT in promoting cardiomyocyte survival has been well studied and our results are consistent with published findings [24]. While GGF2 treatment results in formation of both pAKT and pERK1/2, blocking the PI3K pathway resulted in decreased viability. Furthermore, a close correspondence in concentration-effect relations for GGF2 activation of PI3K pathway and the cytoprotective effect (MTT labeling level) is consistent with a role for GGF2 in mediating cytoprotection via pAKT formation. A dependency on PI3K for cell survival has also been observed in adult rat ventricular myocytes treated with daunorubicin [10]. In those studies, NRG1β rescued cells from death in a pAKT-dependent manner, as demonstrated by use of both chemical inhibitors and a dominant negative AKT. Our studies confirm and extend these studies to show that GGF2 isoform of NRG1β can protect a cardiomyocyte cell line from anthracycline insult.
In our study, inhibiting Bcl-2 using a small molecule chemical inhibitor, ABT-737, resulted in decreased viability even in the presence of GGF2, suggesting that this pathway is important for GGF2 mediated cytoprotection. Inhibition of Bcl-2 expression using siRNA was found to have effects similar to inhibition of erbB2 which increases susceptibility to doxorubicin toxicity [30]. Our studies extend these findings to show that the type II NRG-1 isoform GGF2 also mediates activation of the erbB pathway and produces a cardioprotective effect dependent on pAKT formation. Furthermore, GGF2 exposure produced a two-fold increase in Bcl-2 gene expression, a response that contributes to pro-survival signaling. Bcl-2 protein expression was also observed to be upregulated in neonatal rat ventricular myocytes after rHNrg1 treatment [30] and our findings corroborate that observation. The BH3 domain-only apoptosis sensitizer protein BAD, sequesters anti-apoptotic molecules like Bcl-2 and prevents them from exerting their anti-apoptotic effects [31]. AKT mediated phosphorylation of BAD at Serine 136 results in dissociation of the Bcl-2-BAD heterodimer, increasing the level of Bcl-2 available for anti-apoptotic activity [32]. The net result of this is prevention of mitochondrial pore formation, leading to increased survival.
We show for the first time that GGF2 can modulate the Bcl-2 pathway through regulation of BAD phosphorylation. GGF2-mediated BAD phosphorylation is dependent upon the activation of PI3K, as evidenced by a decreased pBAD formation response in HL-1 cells pre-treated with LY294002. Molecules like cardiotrophin and insulin have been shown to phosphorylate BAD in the heart, leading to cardio protection [33]. Thus, it is conceivable that GGF2 acts in a similar manner to protect stressed cells by preventing mitochondrial pore formation. These findings are consistent with results of studies performed in mitochondria isolated from infarcted hearts of rats treated with rhNRG1 which showed a decrease in ROS production when compared to untreated animals [34]. This finding suggests that mitochondria are important targets of neuregulin actions. Furthermore, presence of daunorubicin or blocking erbB2/erbB4 receptor function results in an increase in apoptosis concomitant with an increase of the pro-apoptotic Bcl-xS isoform [28]. Our related findings in HL-1 cells that GGF2 increases Bcl-2 expression and BAD phosphorylation to mediate an anti-apoptosis signal parallels closely the effect of NRG1 to influence expression of Bcl-2 and pBAD through PI3K in a focal cerebral ischemia model [34]. The mechanistic similarities of neuregulin-mediated cytoprotection that is described in our studies, in other cardiomyocyte systems and in neuronal systems likely reflect ubiquitous expression of erbB receptors and their well-known roles in regulation of the fundamental cellular processes underlying cell proliferation, migration and differentiation [35].
Anthracycline induced cardiotoxicity continues to be a major risk factor that limits life time drug exposure for treating cancer patients due to a dramatic increase in cardiomyopathy associated with chemotherapy. While several strategies have been proposed to mitigate anthracycline induced heart failure, success has been limited [36]. The mechanism by which doxorubicin causes cardiotoxicity has been extensively researched and there are several mechanisms that have been proposed reviewed in [19,20]. These include production of reactive oxygen species (ROS), mitochondrial dysfunction and disruption of pro-survival signalling. Studies in quiescent adult rat ventricular cardiomyocytes show that NRG1 influences gene expression of multiple cellular systems, including factors involved in mitochondrial metabolism [9]. Additionally, in skeletal muscle, NRG1 treatment increased mitochondrial activity and membrane potential [37]. When assessing gene, expression using a panel focused on mitochondrial function we found that GGF2, when present by itself, did not dramatically alter expression of the studied mitochondrial related genes as seen in Figure 6. On the other hand, doxorubicin altered expression of several genes including members of the apoptotic pathway. Strikingly, when GGF2 was added in the presence of doxorubicin, GGF2 appears to return the expression of genes with altered expression back towards baseline. This was true for most of the genes tested (Figure 6) and would imply that in a stressed cell, GGF2-mediated erbB signalling serves an important homeostatic function to shift physiologic systems toward baseline state. Earlier studies by Grazette et. al. revealed that inhibiting erbB2 signalling using an anti-erbB2 antibody resulted in an increase in apoptotic signals and a decrease in mitochondrial function [38], providing corroboration of a role for erbB signalling pathways. This is consistent with our similar finding that GGF2, the ligand of erbB3 and erbB4 receptors which heterodimerize with erbB2, decreases doxorubicin’s cytotoxic effect to reduce mitochondrial metabolism. Our results also show GGF2 affects apoptosis by influencing molecules via the intrinsic mitochondrial pathway.
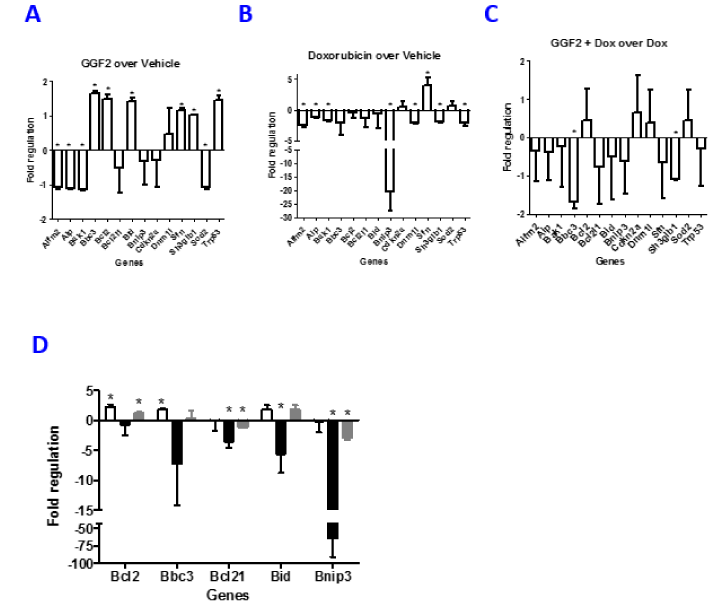
Figure 6. GGF2 alters expression of mitochondrial related genes. HL-1 cells were treated with GGF2, doxorubicin or doxorubicin + GGF2. After 18 hours, RNA isolated from the cells was assessed for expression changes in mitochondria related genes using a mouse mitochondrial PCR array. Changes in gene expression are compared to vehicle and shown as fold regulation (negative inverse of fold change as described in the methods) for three different treatments. (A): GGF2 over vehicle. (B): Doxorubicin over vehicle. (C): GGF2 plus doxorubicin over Doxorubicin alone. 3 experiments are averaged and shown above. The * denotes p-values <0.05 (Students t-test). (D): Independent confirmatory qPCR was performed on separately generated lysates from HL-1 cells treated with GGF2 (open bars), Doxorubicin (black bars) or doxorubicin + GGF2 (grey bars). The cells were assayed for pro and anti-apoptosis related genes, Bcl-2, Bbc3, Bcl-21, Bid and Bnip3 and are shown as fold regulation. The histograms show an average of three independently performed experiments.
While the MAPK pathway is also activated by GGF2, the findings from Baliga et al. show that this pathway is linked to protein synthesis as measured by phenylalanine uptake and atrial natriuretic peptide (ANF) expression in NRVMs. This suggests a role of ERK1/2 in hypertrophic responses while pathways downstream from pAKT are required for pro-survival responses [12,29]. Interestingly, when the MAPK pathway is inhibited by U0126, not only is the GGF2-mediated pAKT formation response increased significantly, but MTT labelling of doxorubicin-treated cells is increased. This finding suggests a cytoprotective effect of the increased levels of pAKT that accompany inhibition of MAPK signalling. AKT activation can influence other pathways including changes in glucose metabolism which in turn may play a role in survival [39]. Other pathways like the src/FAK were not tested in this study but have been attributed to maintenance and repair of mechanical coupling in cardiomyocytes [40]. Our studies elucidate a mechanism of the type II NRG1 GGF2 cytoprotective action in anthracycline-treated atrial derived HL-1 cardiomyocytes. All other studies done thus far focused on the role of type I neuregulin’s in ventricular derived cardiomyocytes. GGF2 activates a cell survival pathway that requires pBAD formation and the anti-apoptotic actions of Bcl-2 and appears to function via a PI3K-dependent pathway. GGF2 alters gene expression of pro- and anti-apoptotic genes to counter doxorubicin’s deleterious effects. These actions provide further insight into GGF2’s role in cytoprotection of cardiomyocytes. NRG1β has been tested in numerous animal models of heart failure and has broadly been observed to improve cardiac function [41-44]. Furthermore, the GGF2 isoform of NRG1 (USAN Cimaglermin alfa) is currently being studied in clinical trials for treatment of congestive heart failure (NCT01258387 and NTC01944683) (Lehnihan et al. 2016, in press). Because the model used in this report describes the use of doxorubicin to stress the cardiomyocyte, these results may reflect potential for use of GGF2 to address cardiotoxicity liabilities associated with chemotherapy. More generally, it is conceivable that in a heart under duress, GGF2 utilizes similar or overlapping mechanisms to exert cytoprotective effects in compromised cardiomyocytes.
Funding
This research did not receive any specific grant from funding agencies in the public, commercial, or not-for-profit sectors.
- Buonanno A, Fischbach GD (2001) Neuregulin and ErbB receptor signaling pathways in the nervous system. Curr Opin Neurobiol 11: 287-296. [Crossref]
- Rupert CE, Coulombe KL (2015) The roles of neuregulin-1 in cardiac development, homeostasis, and disease. Biomark Insights 10: 1-9. [Crossref]
2021 Copyright OAT. All rights reserv
- Falls DL (2003) Neuregulins: functions, forms, and signaling strategies. Exp Cell Res 284: 14-30. [Crossref]
- Britsch S (2007) The neuregulin-I/ErbB signaling system in development and disease. Adv Anat Embryol Cell Biol 190: 1-65. [Crossref]
- Meyer D, Birchmeier C (1995) Multiple essential functions of neuregulin in development. Nature 378: 386-390. [Crossref]
- Zhao JJ, Lemke G (1998) Selective disruption of neuregulin-1 function in vertebrate embryos using ribozyme-tRNA transgenes. Development 125: 1899-1907. [Crossref]
- Lee KF, Simon H, Chen H, Bates B, Hung MC, et al. (1995) Requirement for neuregulin receptor erbB2 in neural and cardiac development. Nature 378: 394-398. [Crossref]
- Gassmann M, Casagranda F, Orioli D, Simon H, Lai C, et al. (1995) Aberrant neural and cardiac development in mice lacking the ErbB4 neuregulin receptor. Nature 378: 390-394. [Crossref]
- Giraud MN, Flück M, Zuppinger C, Suter TM (2005) Expressional reprogramming of survival pathways in rat cardiocytes by neuregulin-1beta. J Appl Physiol (1985) 99: 313-322. [Crossref]
- Fukazawa R, Miller TA, Kuramochi Y, Frantz S, Kim YD, et al. (2003) Neuregulin-1 protects ventricular myocytes from anthracycline-induced apoptosis via erbB4-dependent activation of PI3-kinase/Akt. J Mol Cell Cardiol 35(12): 1473-9. [Crossref]
- Kuramochi Y, Lim CC, Guo X, Colucci WS, Liao R, et al. (2004) Myocyte contractile activity modulates norepinephrine cytotoxicity and survival effects of neuregulin-1beta. Am J Physiol Cell Physiol 286: C222-229. [Crossref]
- Baliga RR, Pimental DR, Zhao YY, Simmons WW, Marchionni MA, et al. (1999) NRG-1-induced cardiomyocyte hypertrophy. Role of PI-3-kinase, p70(S6K), and MEK-MAPK-RSK. Am J Physiol 277: H2026-2037. [Crossref]
- Timolati F, Ott D, Pentassuglia L, Giraud MN, Perriard JC, et al. (2006) Neuregulin-1 beta attenuates doxorubicin-induced alterations of excitation-contraction coupling and reduces oxidative stress in adult rat cardiomyocytes. J Mol Cell Cardiol 41: 845-854. [Crossref]
- Lemmens K, Doggen K, De Keulenaer GW (2007) Role of neuregulin-1/ErbB signaling in cardiovascular physiology and disease: implications for therapy of heart failure. Circulation 116: 954-960. [Crossref]
- Matsukawa R, Hirooka Y, Ito K, Honda N, Sunagawa K. (2014) Central neuregulin-1/ErbB signaling modulates cardiac function via sympathetic activity in pressure overload-induced heart failure. J Hypertens 32(4): 817-25. [Crossref]
- Slamon DJ, Leyland-Jones B, Shak S, Fuchs H, Paton V, et al. (2001) Use of chemotherapy plus a monoclonal antibody against HER2 for metastatic breast cancer that overexpresses HER2. N Engl J Med 344:783-92. [Crossref]
- Feldman AM, Lorell BH, Reis SE (2000) Trastuzumab in the treatment of metastatic breast cancer: anticancer therapy versus cardiotoxicity. Circulation 102: 272-274. [Crossref]
- Crone SA, Zhao YY, Fan L, Gu Y, Minamisawa S, et al. (2002) ErbB2 is essential in the prevention of dilated cardiomyopathy. Nat Med 8: 459-465. [Crossref]
- Montaigne D, Hurt C, Neviere R (2012) Mitochondria death/survival signaling pathways in cardiotoxicity induced by anthracyclines and anticancer-targeted therapies. Biochem Res Int 2012: 951539. [Crossref]
- Zhang YW, Shi J, Li YJ, Wei L (2009) Cardiomyocyte death in doxorubicin-induced cardiotoxicity. Arch Immunol Ther Exp (Warsz) 57: 435-445. [Crossref]
- Sawyer DB, Caggiano A (2011) Neuregulin-1β for the treatment of systolic heart failure. J Mol Cell Cardiol 51: 501-505. [Crossref]
- Force T, Wang Y. (2013) Mechanism-based engineering against anthracycline cardiotoxicity. Circulation 128: 98-100. [Crossref]
- Pentassuglia L, Sawyer DB (2009) The role of Neuregulin-1beta/ErbB signaling in the heart. Exp Cell Res 315: 627-637. [Crossref]
- Miyamoto S, Murphy AN, Brown JH (2009) Akt mediated mitochondrial protection in the heart: metabolic and survival pathways to the rescue. J Bioenerg Biomembr 41:169-80.
- Yamaguchi H, Wang HG (2001) The protein kinase PKB/Akt regulates cell survival and apoptosis by inhibiting Bax conformational change. Oncogene 20: 7779-7786. [Crossref]
- Jie B, Zhang X, Wu X, Xin Y, Liu Y, et al. (2012) Neuregulin-1 suppresses cardiomyocyte apoptosis by activating PI3K/Akt and inhibiting mitochondrial permeability transition pore. Mol Cell Biochem 370:35-43.
- An T, Zhang Y, Huang Y, Zhang R, Yin S, et al. Neuregulin-1 protects against doxorubicin-induced apoptosis in cardiomyocytes through an Akt-dependent pathway. Physiol Res 62: 379-85. [Crossref]
- Rohrbach S, Muller-Werdan U, Werdan K, Koch S, Gellerich NF, et al. (2005) Apoptosis-modulating interaction of the neuregulin/erbB pathway with anthracyclines in regulating Bcl-xS and Bcl-xL in cardiomyocytes. J Mol Cell Cardiol 38: 485-493. [Crossref]
- Bian Y, Sun M, Silver M, Ho KK, Marchionni MA, et al. (2009) Neuregulin-1 attenuated doxorubicin-induced decrease in cardiac troponins. Am J Physiol Heart Circ Physiol 297: H1974-1983. [Crossref]
- An T, Huang Y, Zhou Q, Wei BQ, Zhang RC, et al. (2013) Neuregulin-1 attenuates doxorubicin-induced autophagy in neonatal rat cardiomyocytes. J Cardiovasc Pharmacol 62: 130-137. [Crossref]
- Yang E, Zha J, Jockel J, Boise LH, Thompson CB, et al. (1995) Bad, a heterodimeric partner for Bcl-XL and Bcl-2, displaces Bax and promotes cell death. Cell 80: 285-291. [Crossref]
- Datta SR, Dudek H, Tao X, Masters S, Fu H, et al. (1997) Akt phosphorylation of BAD couple’s survival signals to the cell-intrinsic death machinery. Cell 91: 231-241. [Crossref]
- Kuwahara K, Saito Y, Kishimoto I, Miyamoto Y, Harada M, et al. (2000) Cardiotrophin-1 phosphorylates akt and BAD, and prolongs cell survival via a PI3K-dependent pathway in cardiac myocytes. J Mol Cell Cardiol 32: 1385-1394. [Crossref]
- Guo YF, Zhang XX, Liu Y, Duan HY, Jie BZ, et al. (2012) Neuregulin-1 attenuates mitochondrial dysfunction in a rat model of heart failure. Chin Med J (Engl) 125: 807-814. [Crossref]
- Bublil EM, Yarden Y (2007) The EGF receptor family: spearheading a merger of signaling and therapeutics. Curr Opin Cell Biol 19: 124-134. [Crossref]
- Vejpongsa P, Yeh ET (2014) Prevention of anthracycline-induced cardiotoxicity: challenges and opportunities. J Am Coll Cardiol 64: 938-945. [Crossref]
- Cantó C, Pich S, Paz JC, Sanches R, Martínez V, et al. (2007) Neuregulins increase mitochondrial oxidative capacity and insulin sensitivity in skeletal muscle cells. Diabetes 56: 2185-2193. [Crossref]
- Grazette LP, Boecker W, Matsui T, Semigran M, Force TL, et al. (2004) Inhibition of ErbB2 causes mitochondrial dysfunction in cardiomyocytes: implications for herceptin-induced cardiomyopathy. J Am Coll Cardiol 44: 2231-2238. [Crossref]
- Pentassuglia L, Heim P, Lebboukh S, Morandi C, Xu L, et al. (2016) Neuregulin-1β promotes glucose uptake via PI3K/Akt in neonatal rat cardiomyocytes. Am J Physiol Endocrinol Metab 310: E782-794. [Crossref]
- Kuramochi Y, Guo X, Sawyer DB (2006) Neuregulin activates erbB2-dependent src/FAK signaling and cytoskeletal remodeling in isolated adult rat cardiac myocytes. J Mol Cell Cardiol 41: 228-235. [Crossref]
- Liu X, Gu X, Li Z, Li X, Li H, et al. (2006) Neuregulin-1/erbB-activation improves cardiac function and survival in models of ischemic, dilated, and viral cardiomyopathy. J Am Coll Cardiol 48: 1438-1447. [Crossref]
- Hill MF, Patel AV, Murphy A, Smith HM, Galindo CL, et al. (2013) Intravenous glial growth factor 2 (GGF2) isoform of neuregulin-1β improves left ventricular function, gene and protein expression in rats after myocardial infarction. PLoS One 8: e55741.
- Galindo CL, Ryzhov S, Sawyer DB (2014) Neuregulin as a heart failure therapy and mediator of reverse remodeling. Curr Heart Fail Rep 11: 40-49. [Crossref]
- Bernd Ebner SAL, Doreen Hollenbach, Nadine Steinbronn, Annette Ebner, et al. (2015) In situ Postconditioning with Neuregulin-1b is mediated by a PI3K/Akt-dependent pathway. Canadian journal of Cardiology 31: 76-83.