The statement that the internal energy of ideal gas depends only on its temperature but not its volume and pressure in the free expansion process has been a topic of continuous argument in academic community. We report experimental validation of the relationship between internal energy of ideal gas and each state function. The relative internal energy in different pressure systems was determined, resulting the regression equation in P, U coordinate system. The continued equality was derived by comparing the regression equation and the definition of heat capacity at constant volume. The relationship of internal energy with volume and quantity was further derived through the state transformation method. Meanwhile, Meyer’s equation and the equation of enthalpy were also derived. Therefore, the internal energy of ideal gas has interrelationship with each state function; and a close relationship between the continued equality derived herein and current theory of ideal gas was well established
continued equality, internal energy, ideal gas, experimental validation, Rossini-Frandsen, state function.
Continued equality  was derived from the experimentally validated conclusion that the internal energy of the ideal gas has interrelationship with each state function.
- The widely-connected “fact community” and “logic community” with the known facts and the current theories were derived
- The conclusions obtained can be merged with all the current accepted view regarding “phenomenon” and “understanding”
- The internal energy of the ideal gas has interrelationship with each state function, and the derived result is mathematically expressed as a continued equality:

- Inclusive of free expansion and Rossini-Frandsen experiments as well as all current basic theories of the ideal gas, therefore, becoming the new addition to the current thermodynamics and related basic theories
The “ideal gas” is a fundamental theoretical model adopted from the studies of natural principles in thermodynamics. Joule’s Law obtained by free expansion experiment in 1834 states as: “the internal energy of an ideal gas is independent of its volume and pressure; instead it depends only on its temperature”. Joule’s law was then used to define the ideal gas. Many researchers have reported corrections to this experiment [1], and the precise measurements showed that temperature is not a constant in the process of free expansion [2]. This means “internal energy and temperature can be separately considered”, which essentially challenges the “privilege” that internal energy only depends on its temperature. This has also been causing continuous argument [3-6]. Finally someone suggested that the free expansion cannot be used as a verdict whether the internal energy of an ideal gas is independent of its volume [7]. Joule’s Law then relies on the support from Rossini-Frandsen experiment [8]. In recent years, the academic community has been further debating on ideal gas, among which, included the discussion of the relationship between internal energy and state of an ideal gas [9-14]. We reported [15-17] the investigation of the relationship between state and internal energy of ideal gas utilizing the theoretical methods of thermodynamics, statistical physics, analytic geometry and probability theory, and so on. All of these studies generated a consistent conclusion that the internal energy of ideal gas has the same character of dependence with each function of state, and which can also be expressed as a continued equality in mathematics. In this paper we report the experimental data to verify these theoretical results.
Experimental principles
For an ideal gas system closed in a fixed container, it can be concluded based on the definition of heat capacity at constant volume and the First Law of Thermodynamics that the temperature increment is directly proportional to its internal energy increment:

The Charles’s Law states that temperature is directly proportional to pressure in this system of ideal gas: 
So: 
If we heat the gas system directly by electrifying the heating wire in a container, the quantity of heat input of the system can be derived as the following equation according to the Law of Electric Conversion: Q = IUe t
So, Q = IUe d t =
The above principles explain that for this ideal gas system with fixed volume in a closed container, the time t for electrifying the heating wire with fixed current and voltage is directly proportional to the internal energy increment dU, temperature increment dT, and pressure increment dP of the system.
In order to eliminate the effect of heat leakage factor in the experiment, one can record pressure change in the whole process of ohmic heating, and then calculate the slope for time t = 0. By combining with the initial voltage P0 , the equation used to eliminate the effect of heat leakage can be derived as: P = k t + P0 . According to the ideal gas temperature scale experiment, when extrapolating the pressure of this equation to P→0, the absolute temperature of this system should also be T→0. This indicates that the internal energy difference for the two different determined states (P, T, V) and (P→0, T→0, V) can be derived through a mathematical method. Under the condition of the limit state (P→0, T→0, V), assuming the internal energy value of this system is 0, and then the internal energy difference of these two states is the relative internal energy of the system.
According to the ideal gas temperature scale experiment, for the gas system that sealed up in the same container, no matter how its initial pressure (or gas quantity) changes, the states of the system have the same characteristic when P→0 (P→0, T→0, V). In this experiment, setting the internal energy of this limit state U = 0 as the reference criterion, and making the electrifying time t as a measure unit of internal energy, the internal energy of the system under the initial condition of Pi can be measured uniformly when “volume and temperature are constant”. Finally, we can then study the relationship between pressure and internal energy via the regression analysis of their corresponding values.
Experimental devices
The experimental devices are depicted in Figure 1. The calorimeter used in this experiment has an interlayer, which ensures the environment temperature stable in the experimental gas system by a flow of water with constant temperature. There is a heating wire in the calorimeter, which provides energy to the system by utilizing constant current and voltage. The Precision thermometer in the calorimeter is used for testing the linear relationship between temperature and pressure in the system of a uniform state. Calorimeter and mercury pressure gauge are connected, and video equipment is used to record the time for electrifying the heating wire and the pressure change in the whole process.
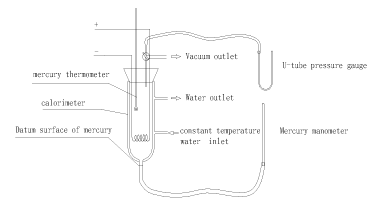
Figure 1. Schematic Diagram of Experimental Devices
Main experimental instruments
Calorimeter volume is about 800 ml, with an interlayer for water circulation.
Material: thick wall and horniness glass (accuracy of pressure instruction: 1 mmHg)
Origin: homemade
Vacuum pump 2X spin-on-chip vacuum pump,
Origin: Zhejiang Vacuum Group
Thermostatic bath Type 501 super thermostat (accuracy + /–0.1 °C)
Origin: Shanghai Experimental Instrument Factory
Voltage regulator III B-614 type electronic ac voltage stabilizer
Origin: Yichang Electronic Instrument Factory
Powerstat TDGCJ-1
Ammeter 59 L1-A (value of a scale division is 0.2 A)
Voltmeter 44L1-V (value of a scale division is 2 V)
Precision thermometer range is 0–50 °C (value of a scale division is 0.1 °C)
U-tube pressure gauge range is 0-760 mmHg (accuracy is 1 mmHg)
Experimental gas
Experimental gas in the calorimeter is the natural air. There are three reasons to use natural air: 1) the natural air is usually used in gas research experiments during the time period Jouele’s laws were first reported; 2) the ideal gas in thermodynamics is referred as “the gas under the condition that the temperature is not too low and the pressure is not too high”, and the conditions of standard state are 0 °C, 1 atm, and 22.4 l/mole. This experiment was carried out at 0 °C and 1 atm, therefore, the natural air meets the requirements of following equations:  ,
,  ,
,  and so on, and the experimental phenomenon of classical “free expansion”; 3) natural air was also used in Rossini-Frandsen experiment in 1932, which enabled us to extrapolate the experimental results to P→0, thus the experimental phenomena can be studied according to the requirements of “ideal gas” in statistical physics.
Experiment procedure: 1) Turn on circulating water with constant temperature in the thermostatic bath into the interlayer of calorimeter, and keep air in the sealed calorimeter at 30 °C for 30 minutes to allow the system well balanced; 2) Electrify the built-in heating wire for 30 minutes (current, 1 A; voltage, 6 V), record the pressure changes via mercury pressure gauge in the whole process by video equipment, keep the water temperature in interlayer constant after electrifying, and allow the temperature of the system restore to 30 °C; 3) Adjust the water temperature in thermostatic bath, heating the system of experiment with hot water in the interlayer. In the changing ranges of temperature increasing and pressure increasing during the electrifying process, read the corresponding values of temperature and pressure for five balanced systems to verify the linear relationship between pressure and temperature. All other experiments were carried out in the same calorimeter and at the same temperature by the same procedure as described above except the varying pressure to examine the effect of pressure.
Experimental observation: 1) Pressure had no obvious change in the first second since electrifying, and it then began to increase steadily, however, the pressure oscillated irregularly until the end of electrifying. The delay at the initial stage is due to the internal energy increment was tiny. In the process of overcoming the mercury inertia in the pressure gauge and converting internal energy to kinetic energy, the time is required for gradually accumulating energy. This is one of the error sources. Therefore, the error has to be removed during data processing. The oscillation occurred later can be considered as the alternative conversion of the internal energy of the system with the kinetic energy and the potential energy of mercury while the sum of all the energies for each oscillation is constant. The pressure of the system observed at the equilibrium point in oscillation should be correct. The mercury in the capillary of the pressure gauge rose about 20 mm with ohmic heating because the internal energy loss and volume change caused are so small that it can be neglected; 2) A good linear relationship between pressure and temperature of the system was observed. However, in the process of electrifying, the change of temperature reflected by mercury thermometer was obviously lagged behind the change of pressure, and their changes are not at the same speed until the late stage of the experiment. This indicated that there is a dynamic temperature field in the system during the electrifying process. The results obtained from any one temperature point cannot be used to describe the state of the system. The temperature results obtained only through pressure conversion can be considered as the overall representative results. It corresponds to the finally balanced temperature value after the system is fully “isolated”; 3) The experimental results under different pressure generated the heating curves with extremely similar form, characteristics, and phenomena.
Experimental determination of the system internal energy
Here, we take a specific experimental example to describe the process for the determination of system internal energy. The experimental conditions are: natural atmosphere pressure P = 992.5 hPa, initial system temperature t = 30 °C, initial system pressure P = 627.2 hPa, current of heating wire I = 1 A, voltage Ue = 6 V, and the electrifying time t = 30 minutes.
Verification of linear relationship between temperature and pressure: The experiment results in Figure 2 shows the linear relationship between temperature and pressure when the device is in the equilibrium state.
The following results were generated from above experimental data (Figure 2):
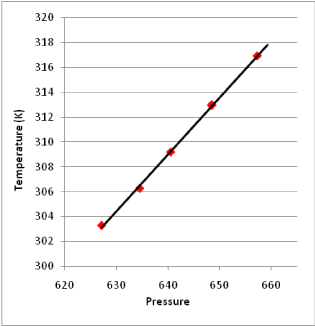
Figure 2. Linear Relationship between Temperature and Pressure in the Equilibrium State
1). equation of the linear relationship between pressure and temperature measured by this device is:
T = 15.0946 + 0.45923 P, r = 0.9996
The confidence rate is over 99%, which indicates the linearity of this pressure thermometer itself is very high.
2). When extrapolating the pressure to 0 Pa, the limit value of temperature equals to 15.0946 K, and the absolute temperature of ideal gas should be 0 K theoretically. In addition, the extrapolation error is about 5 K per 100 K, which indicates the experimental error is in the reasonable error range of the U-tube mercury pressure gauge.
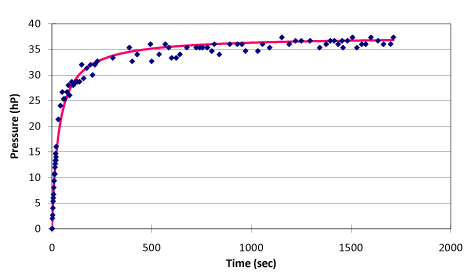
Regression analysis results as shown in figure 3 from the whole process of ohmic heating can be generated as follow:
The physical equation: p = t / (0.904009 + 0.026636 t) + p30 (p30 refers to the pressure of initial state system when temperature is 30 °C)
The statistics test of the regression equation: r = 0.993354, the linearity is over 99%.
The regression equation for the time of ohmic heating and the pressure change in the whole process: 
When the ohmic heating time t = 0, the system can be considered as no heat leaking, the slope of this point is: 
Then, under the no-leaking condition, the linear equation of pressure with time can be derived as 
Extrapolating the linear relationship of pressure P and time t to limit of P →0, the internal energy of this system can be calculated as follow:
The slope obtained according to the result of the experiment is:
k = 1.106184
The pressure equation of the system with no heat leaking is:
 =1.106184t+ 627.2 (initial pressure p30 = 627.2 hPa).
The pressure difference between initial state and the state of P →0 is converted to ohmic heating time: t = 627.2 ÷ 1.106184 = 566.992 seconds
The internal energy of initial state in this system is: 1 (A) x 6 (V) x 566.992 seconds = 3401.954 J.
Experimental result
This experiment is conducted by the same calorimeter in six different pressure systems, respectively. Initial temperature is controlled at 30 °C. The internal energy results can be obtained from the six experimental systems according to the process described above. The experimental result is summarized in Table 1.
We can conclude from the results in Table 1:
Conclusion 1: Internal energy is directly proportional to pressure in the system (see figure 4).
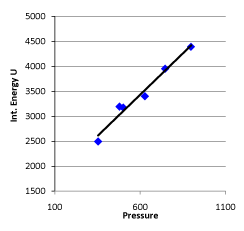
Figure 4. Linear Relationship between Pressure and Internal Energy of the System at 30 °C
The regression equation of initial pressure and internal energy of the system is:
U = 1447.581 + 3.309104 P30; r= 0.985939
This result shows that in the gas system with “the same volume and the same temperature”, the probability that internal energy is directly proportional to pressure or gas quantity of the system is above 99%.
Conclusion 2: The slope k of the internal energy changing with pressure has a linear relationship with the initial pressure  (corresponding data in the first column and last column are in a linear relationship in Table 1) (Figure 5).
Table 1. Experimental Result at 30 °C and 303.15 K
Exp. No. |
Initial pressure
p0 (hPa) |
Internal energy
U (J) |
Pressure equation of no heat leaking |
r |
Slope of pressure change (k) |
1 |
353.5544 |
2495.737 |
P = 0.8499 t + 353.5544 |
0.9829 |
0.8499 |
2 |
479.0103 |
3192.628 |
P = 0.9002 t + 479.0103 |
0.9889 |
0.9002 |
3 |
501.0084 |
3171.532 |
P = 0.8782 t + 501.0084 |
0.9938 |
0.8782 |
4 |
627.1977 |
3401.954 |
P = 1.1062 t + 627.1977 |
0.9933 |
1.1062 |
5 |
745.5214 |
3953.161 |
P = 1.1315 t + 745.5214 |
0.9907 |
1.1315 |
6 |
896.8417 |
4393.619 |
P = 1.2247 t + 896.8417 |
0.9871 |
1.2247 |
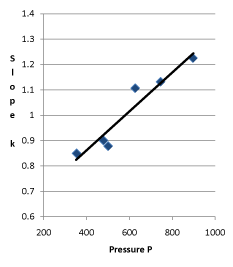
Figure 5. Linear Relationship between Pressure and Slope of the System in 30 °C
The regression equation of slope and the initial pressure is:
k = 0.55432+0.000767 ; r = 0.958943
The probability that the slope of the internal energy changing with pressure is in proportion to the initial pressure or gas quantity is above 99%.
Continued equality derived according to experimental result
According to the conditions of “standard state of ideal gas”, all the measurements resulted from this experiment using the air at 30 °C and under less than 1atm pressure should be considered as the ideal gas of thermodynamics theory. The results stated above at Conclusion 1 above: U = 1447.581+3.31 , indicates that the internal energy is directly proportional to pressure (gas quantity). After differentiation, substituting it by equation of ideal gas and comparing to the definition of heat capacity at constant volume, we can then get:

So, under the current experimental condition,
Then 
The experimental result verified that the “continued equality” is tenable to ideal gas in the thermodynamics theory system.
Based on the theory of statistical physics, only under the condition of pressure  for the initial state during experiment, it meets the requirement of the “ideal gas”:
The result from Conclusion 1 is: U = 1447.581 + 3.31 , when
 ,
,  J
J
And the result from Conclusion 2 is:  , when
 ,
, 
So, the gas in the closed calorimeter is in the extremely low pressure limit:
 (p → 0)
It then indicates that internal energy is also proportional to pressure in the gas system with low pressure limit. The same continued equality can also be obtained using the same mathematical method mentioned above.
 (
( )
)
 value became very small in the experimental process, which exhibited the conceptual difference of the ideal gas between statistical physics and thermodynamics. With these series of experimental data, we have successfully verified “continued equality.”
Further verification of experiment
Whether this new standpoint Continue Equality stands mainly depends on whether it can well connect to all the current theory systems. Therefore, we derived the same results from the internal energy vs pressure and transformed internal energy vs temperature by utilizing the experimental data described above. The reliability of the experimental condition and resulted relationships obtained were further verified by micro-disturbance of the experimental results.
- Methods for analysis
A coordinate system including the results of extrapolation has to be established first. Y-coordinate denotes pressure P of the system; make the point P = 0 on the pressure axis as the origin O of the coordinate system; x-coordinate denotes the time t (i.e. function of internal energy) for electrifying the heating wire. Setting the origin by this way means the internal energy difference of initial state pressure P30 and P = 0 in the experimental system can also be converted to electrifying time of the system (see Figure 6)
Dotted Lines bcd and all other similar curves are recorded from the six experiments described thus far (see Figure 3 as an example). When the electrifying wire releases heat in the closed system that has constant volume, the temperature and pressure of the system will rise. Because of the possible heat leakage of calorimeter itself, the processes of temperature and pressure increment present as curves. The system keeps stable in the new thermal equilibrium state when the speeds of hot leakage and heat release of heating wire are equal.
Line abO and similar straight lines are those represented by the equations in the column of “pressure equations of no hot leaking” in Table 1. Each line is the tangent of corresponding experimental curve when the ohmic heating time t = 0. Point b is not only the initial state point of the experimental system, but also the tangent point of the pressure curve at the place of t = 0.
Obviously, as the initial state of the system has been known, one degree of freedom t is still required if we want to determine the point b in the coordinate system shown in Figure 6, and it must be determined through experiment. This also demonstrated the validation process highly depends on the experiment. Section 1.5.2 of this paper gave the method for the determination of point b.
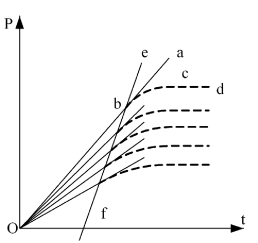
Figure 6. Principle Chart for Result Analysis
Line ebf is the straight line in Figure 4 obtained by connecting initial state point (or every tangent point) of every experiment. The equation thus obtained is U (J) = 1447.581 + 3.309104 p30. Because this line reflects the corresponding relationship between pressure and internal energy in this system, the line ebf is also the verification line of the thermodynamics. In this experiment, the same volume and temperature are used, therefore the pressure differences can only be obtained through adjusting gas quantity in every experiment. As we know based on the extensive property of internal energy that "internal energy is directly proportional to gas quantity", the straight line ebf is obtained.
2. Influence of temperature and volume on results in the coordinate system of internal energy and pressure
The influence of temperature on line ebf was examined first: the equation for line ebf is: U (J) = 1447.581 + 3.309104 p30. Assuming the experimental temperature was decreased by 1/10 (about 0 °C = 273.15 K) from 30 °C (303.15 K), under the condition of same volume and same gas quantity, the corresponding pressure obtained from the ideal gas equations is 
According to the definition of heat capacity, then its corresponding internal energy is  . The corresponding converted result is shown in Table 2.
Table 2. Pressure vs Internal Energy of the System at 273.15 K
Exp. No. |
0.9 P0 |
0.9 U0 |
1 |
318.1990 |
2246.163 |
2 |
431.1093 |
2873.365 |
3 |
450.9076 |
2854.379 |
4 |
564.4779 |
3061.759 |
5 |
670.9693 |
3557.845 |
6 |
807.1575 |
3954.257 |
The data in Table 2 gives the new equation of internal energy: U = 1302.823 + 3.309104 p0. Comparing to the original equation, only intercept changes by 1447.581–1302.823 = 144.758, which means the difference is 1/10. This explains that the intercept of line ebf is the direct function of temperature. But the slope keeps the same at 3.309104, indicating that the slope of line ebf is independent of temperature.
Therefore, the equation obtained above indicated that the slope of line ebf is the function of volume in the linear relationship between pressure and internal energy.
Attempting to change the volume of the experimental system with the methods described above: according to Boyle’s Law and under the constant temperature and gas quantity of the experimental system, when volume of calorimeter increased 10%, the corresponding pressure is . In this case,
  the internal energy of this system, is not changed according to the definition of heat capacity. The result in Table 3 was then derived.
Table 3. Pressure vs Internal Energy after the Volume Increased by 10%
Exp. No. |
0.9 P0 |
0.9 U0 |
1 |
321.4131 |
2495.737 |
2 |
435.4639 |
3192.628 |
3 |
455.4622 |
3171.532 |
4 |
570.1797 |
3401.954 |
5 |
677.7467 |
3953.161 |
6 |
815.3106 |
4393.619 |
According to the results in Table 3, the data regression analysis shows: U = 1447.581 + 3.640015 p30, Comparing with the corresponding equation obtained from the data in Figure 5, only the linear slope changes 3.640015–3.309104 = 0.330911, namely 10% (directly proportion). And its intercept is still 1447.581, which shows that the intercept of line ebf in Figure 5 is a direct proportion function of temperature, and slope is a direct proportion function of volume. The expression of general function form is:

Since we set the reference criteria according to the ideal gas temperature scale experiment in classical theory, so when T →0, we will surely get
  →0, therefore
  = 0 can be determined. In addition, the ideal gas temperature scale under the same pressure can also be expressed as:
  , so, when V →0, then,
  = 0. The formula above can be simplified as:
Transforming the formula above through differential and the ideal gas equation into the function form of temperature, and then comparing with the definition of heat capacity, the following equation is derived:

The other types of expression for heat capacity can be obtained: 
The result can be transformed into the function form of pressure and volume using the ideal gas equation:

After rearrangement and appropriate substitution, the equation of heat capacity is:

So far, continued equality is derived again.
If the state of this closed system changes, the First Law of Thermodynamics can be used to verify that the continued equality is tenable.
After differentiating of experimental equation  , and comparing it with ⊿U = Q-W, the following equation is derived:
dU = δQ-δW = d(k1VP) + d (k2T)
In the isobaric change, dP = 0, substituting  into the equation above resulted in:

So  ,
,
Substituting the results into the equation of heat capacity derived above gives: 
So, , this result is the Meyer’s Equation routinely used in thermodynamics.
Substituting ,
, into the equation
  obtained from this experiment resulted in:

The enthalpy is expressed as under constant pressure. Further re-arrangement and substitution resulted in
 , which is the definition of the enthalpy. That is, the line ebf obtained from current experiment represents the enthalpy concept in the P, U coordinate system. The following two equivalent forms of equations can thus be obtained after simplified by the ideal gas equation:
Equation 1: 
Equation 2: 
Connecting these two equations resulted in: 
Comparison with the Rossini-Frandsen results by experiment
In 1932, Rossini and Frandsen concluded that the internal energy and pressure of a system are in a linear relationship utilizing high-pressure gas expending toward environment by keeping temperature constant. The result is shown in Figure 7. The straight line in Figure 7 is expressed as: 
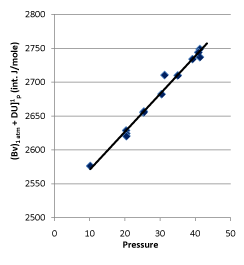
Figure 7. Rossini-Frandsen Experimental Result for the Relationship between Internal Energy and Pressure
When P →0, then U (P, T) →g (T). It, therefore, allowed the researchers concluding that “the internal energy of an ideal gas depends only on its temperature, but not its pressure “.
Our experimental results shown in Figure 5 can be generally expressed as:

Similarly, internal energy also has linear relationship with pressure in P, U coordinate system when P →0, U (P, V, T) →g (T). However, we cannot simply understand as “the internal energy is independent of pressure” because we can study it in the T, U coordinate system through the state transformation.
Because the device in this experiment adopts the principle of “pressure thermometer under constant volume of gas”, therefore, in the process of ohmic heating, internal energy can be measured not only by the change of pressure, but also by the change of temperature. The same set of data obtained from the experiment can be transferred to the coordinate system of temperature T and internal energy U. It is helpful to fully understand the experiment results if one studies it from different angles.
If the pressure of every experiment was transferred to P = 896.8417 hPa (the pressure level of the sixth experiment) utilizing the pressure equations with no heat leaking obtained from every experiment in Table 1 of 1.5.3, the corresponding temperature of the system can be calculated according to the Law of Charles:  . All data from these six experiments can be converted to the results in the system with constant volume and pressure while at different temperature, and then the relationship between temperature and internal energy can be examined.
If the pressure of every experiment is changed to P = 896.8417 hPa, then the required electrifying time for heating is  . After conversion, the corresponding internal energy of the system is U = U0 + IU0 t. All the property parameters obtained through such a transforming process are listed in Table 4.
Table 4. Conversion Results from P, U to T, U Coordinates
Exp. No. |
Equation of no heat leaking for every experiment |
Pressure
after conversion
(hPa) |
Temperature
after conversion
(K) |
Heating
time for conversion
(t) |
Internal energy
after conversion
(J) |
1 |
P = 0.8499 t + 353.5544 |
896.8417 |
768.98 |
639.1766 |
6330.796 |
2 |
P = 0.9002 t + 479.0103 |
896.8417 |
567.58 |
464.1447 |
5977.496 |
3 |
P = 0.8782 t + 501.0084 |
896.8417 |
542.66 |
450.7233 |
5875.872 |
4 |
P = 1.1062 t + 627.1977 |
896.8417 |
433.48 |
243.7605 |
4864.517 |
5 |
P = 1.1315 t + 745.5214 |
896.8417 |
364.68 |
133.7305 |
4755.544 |
2021 Copyright OAT. All rights reserv
6 |
P = 1.2247 t + 896.8417 |
896.8417 |
303.15 |
0 |
4393.619 |
Regression analysis of “temperature K after conversion” and “system internal energy J after conversion” listed in the table resulted in the equation: U = 4.494617 T + 3133.579, r = 0.950455, which indicates that the probability for this series of data having a linear relationship greater than 99% (see Figure 8).
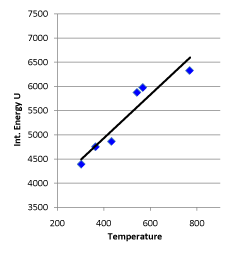
Figure 8. Linear Relationship between Internal Energy and Temperature
Studies on the slope of the straight line in Figure 7: In order to keep the system pressure constant, the temperature will definitely have corresponding change if the gas quantity in the system increases 10% based on the data in Table 4. According to the ideal gas equation, the resulted temperature after the change of gas quantity can be determined as  .
.
In addition, the change of internal energy can be determined as  by the definition of heat capacity, which indicates that the internal energy value of each system is unchanged. Therefore, the data in Table 5 can be derived.
Table 5. Corresponding Temperature and Internal Energy of the System after Gas Quantity is Increased by 10% (derived from the data obtained when P = 896.84 hPa)
Exp. No. |
0.9 P0 |
0.9 U0 |
1 |
692.0853 |
6330.796 |
2 |
510.8237 |
5977.496 |
3 |
488.3946 |
5875.872 |
4 |
390.1319 |
4864.517 |
5 |
328.2130 |
4755.544 |
6 |
272.8350 |
4393.619 |
Regression of temperature and internal energy data in Table 5 resulted in the equation U = 4.994018 T + 3133.579, r = 0.950455, which illustrates the probability for this series of data having linear relationship greater than 99%. Comparing to the equation U = 4.494617 T + 3133.579 derived before gas quantity changes, the intercept keeps constant as 3133.579; the difference of slope values is 4.994018–4.494617 = 0.449461, that is 10%. This indicates that the slope of this straight line is directly proportional to the gas quantity.
Studies on the intercept of the straight line in Figure 7: According to the data in Table 4, the pressure of the system decreases 10%, then P = 0.9P0. Keeping the gas quantity and volume constant, temperature can be determined by the ideal gas equation: 
According to the definition of heat capacity, the internal energy of system can be calculated as . The calculated result is listed in Table 6.
Table 6. Corresponding Temperature and Internal Energy of the System after Pressure Reduced by 10% (derived from the data obtained when P = 896.84 hPa)
Exp. No. |
0.9 P0 |
0.9 U0 |
1 |
692.0853 |
5697.717 |
2 |
510.8237 |
5379.746 |
3 |
488.3946 |
5288.285 |
4 |
390.1319 |
4378.065 |
5 |
328.2130 |
4279.989 |
6 |
272.8350 |
3954.257 |
Comparing to the equation U = 4.494617 T + 3133.579 derived before the gas quantity change, both slopes are the same as 4.494617; the difference of intercepts is 3133.579–2820.221 = 313.3579, reducing by 10%, again. It is concluded that the intercept of this straight line is directly proportional to the pressure of this system. Therefore, the general equation for the temperature being directly proportional to the internal energy in the T, U coordinate system should be expressed as:
 Namely, when T →0, then U→g (P).
If we understand it in the same way, we would conclude that “internal energy is independent of temperature, but depends only on pressure”. Therefore, the two sets of results obtained from the same experiment are conflicted, which indicates that the understanding and analysis of the experiment are insufficient for the conclusion drawn. Therefore, the results “when P →0, then U (P, T)→g (T)”, obtained by Rossini and Frandsen, only shows that the internal energy of gas is related to temperature, but it does not mean that internal energy is not related to pressure. The final comprehensive results of our experiment can be expressed as  . This is the result merged from the two expressions of internal energy in different coordinate systems U (P, V, T) and U (P, T, n) that involve every state function of gas system. Therefore, any one state function can’t be excluded to have influence on the internal energy of the ideal gas. And therefore, the privilege that “the internal energy of an ideal gas depends only on its temperature” does not stand.
The phenomena observed from our experiment are the overall results combined from all the experimental facts of three classical gas laws, electro-thermal equivalent, ideal gas temperature scale, Fourier heat conduction, and others. The phenomena of this experiment and causality of the known facts form an inseparable “fact community” of each other. The continued equality finally derived according to the experimental phenomena includes not only the First Law of Thermodynamics, the ideal gas equation, and the concept of heat capacity; it also includes Meyer equation, concept of enthalpy, the ideal gas temperature scale, free expansion, the Joule law, and others. The continued equality described above constitutes an indivisible “logic community” together with almost all basic content related to ideal gas. These two “communities”, “fact community” and “logic community”, derived above are not only the objectivity approval for the experiment, but also the guarantee that the understanding of it will not conflict with other facts. Because the new phenomenon of this experiment and the new viewpoint derived based on it established an extensive relationship with all the known facts and mature views, Rossini and Frandsen's original conclusion cannot be accepted.
Reference criterion of the internal energy under the limit condition
As described above, according to the experimental facts of the ideal gas scale temperature, we set the relative reference criterion for the internal energy of the system as  when the state for P → 0 is (P →0, T →0, V). It would be necessary to explain for setting this reference criterion. Such a reference criterion, set as such, is reasonable for each system itself at its limit state, and the limit states for six experimental systems can be expressed as (P→0, T→0, V). In the process for these experimental systems approaching the limit state, their intrinsic energy differences decrease (Δε→0). When they almost reaches the limit state, the intrinsic energy differences Δε would be small enough to be neglected in macrocosm.
Based on the Third Law of Thermodynamics, this reference criterion of limit state does not exist in real world. It is just a theoretical hypothesis under temperature scale of the ideal gas. The function for setting this limit state is to represent the corresponding changing trends of the internal energy and state; the significance for setting the reference criterion is to summarize the current theory and known experimental phenomena maximally.
Because internal energy is only the relative value, this specific reference criterion set based on the ideal gas temperature will not reject the “zero point energy” in other axiom system, and it will also not reject the relationship between temperature and the average translational kinetic energy of molecules.
The phenomenon observed and the results derived from our experiments realized widely-connected “fact community” and “logic community” with the known facts and the current theories, which means the conclusions obtained can be merged with all the current accepted view regarding “phenomenon” and “understanding”. Therefore, it can be concluded that the internal energy of the ideal gas has interrelationship with each state function, and the derived result is mathematically expressed as a continued equality:  (
( ).
).
- Stracher GB, Guy GG (1998) The internal energy of a PV = RT gas: a univariable or multivariable function, Math Geol 30: 251-258.
- Klotz IM, Rosenberg RM (1972) Chemical Thermodynamics: Basic Theory and Methods, Third Edition, W. A. Benjamin, Inc., Manlo Park, California.
- Fu XC, Shen WX, Yao TY (1989) Physical Chemistry, Higher Education Press, Beijing.
- Robinson JJ, Trumble KP, Gaskell DR (1997) More on the ideal gas law, J. Miner. Met. Mater. Soc 49: 3.
- Guy AG (1997) More on ideal gas. J Miner Met Mater Soc 49: 4-5.
- Zhu RZ (2005) The independence between Boyle law and Joule law in non-relativistic thermodynamics, College Physics 24: 4-7.
- Zhao KH, Luo WY (1998) Thermology, Higher Education Press, Beijing.
- Rossini FD, Frandsen M (1932) The calorimetric determination of the intrinsic energy of gases as a function of the pressure. Data on oxygen and its mixtures with carbon dioxide to 40 atmospheres at 28°C. Bur Stand J Res 9: 733-747.
- Liu FZ, Wu YX, Han LY (2000) A relationship between internal energy and state of ideal gas. J Xuzhou Norm Univ (Nat. Sci. Ed.) 18: 38-40.
- Yan FL, Gao T (1997) Function forms of PV = 3U/2V, College Physics 16: 21-22.
- Liang Y, Kuang SD (1995) Opinion on internal energy and enthalpy of ideal gas. J Wuhan Instit Chem Techn 17: 17-19.
- Jiang FH (1994) Studies on the process of establishing thermometric scale. J Shandong Institute Build Mater 8: 62-66.
- Bai TX (1997) Demonstration instrument for Joule Law. Phys Exper 15: 165.
- Stepanov I (2014) Explanation of an ideal gas paradox, Phys. Chem.: An Indian J 9: 151-152.
- Yao XW (2011) Mathematics relation between the state function and internal energy of the perfect gas. Henan Sci 29: 397-402.
- An H, Yao XW, Yang GS, Hou JQ, Niu TS (2016) “Studies on the relationship between internal energy and state of ideal gas”, 251at ACS National Meeting, San Diego, CA, USA, March 13-17.
- Yao XW, An H State and Equal-Intrinsic Energy Curved Surfaces of Ideal Gas, This Journal, preamble article.

 was derived from the experimentally validated conclusion that the internal energy of the ideal gas has interrelationship with each state function.


