Objective: Briefly to compare twin and multiple regions of interest (ROIs) in structural magnetic resonance images (sMRI), testing two statistical parametric mapping (SPM) packages against amyloid status in patients diagnosed with mild cognitive impairment (MCI), who underwent positron emission tomography with Pittsburg compound B (PiB-PET). The packages were Voxel-based specific regional analysis system for Alzheimer’s disease (VSRAD) and Brain anatomical analysis using DARTEL (BAAD). Subject data: Data on 65 patients diagnosed with MCI, who had undergone both sMRI scans and PiB-PET beta-amyloid imaging, were downloaded from the Alzheimer's disease neuroimaging initiative (ADNI) database. Of those 65 MCI cases, 18 were found positive by PiB-PET. Data Processing: BAAD interprets sMRI both in false-color images and in Z-scores for 98 brain regions. VSRAD also gives a false-color picture, and one bilateral-twin-ROI z-score, usually for the region of the hippocampus and entorhinal cortex, with ROI-locations specified in MNI coordinates. Results: Receiver operating characteristic (ROC) curves were used to measure the reliability of each set of ROIs by the area under the curve (AUC). VSRAD gave AUC around 0.68 with its default ROIs in the medial temporal lobe. With BAAD, AUC figures depended on the ROIs chosen; AUC values ranged from 0.69 for the hippocampal regions, via 0.86 for 16 (bilateral) ROIs, to 0.98 or more with empirically selected (mostly unilateral) ROIs, not all contiguous. Conclusions: Our results indicated that the multi-ROI approach offers greater versatility and better discrimination of the amyloid-positive MCI cases, improving the prospect of data-acquisition and diagnosis earlier than the MCI stage. Both the number and selection of ROIs are crucial to accuracy. Further testing will be needed to validate ROI combinations for MCI and earlier stages, for other populations and pathologies, and for mixed pathologies.
amyloid, Alzheimer-type pathology, PiB-PET, region of interest, structural magnetic resonance imaging, voxel based, VSRAD, z-score
AD: Alzheimer’s disease; ADNI: Alzheimer's disease neuroimaging initiative; AGD: Argyrophylic grain disease ; AUC: Area under the curve (i.e., under the receiver operating characteristics curve); BAAD: Brain anatomical analysis using DARTEL (version 2); DARTEL: Diffeomorphic anatomical registration through exponentiated Lie algebra (from the Wellcome Department of Imaging Neuroscience); DLB: Dementia with Lewy bodies; ERC: entorhinal cortex ; FTD: Frontotemporal dementia (a sort of FTLD); FTLD: Frontotemporal lobar degeneration; HCScl: Hippocampal sclerosis; hsAD: hippocampus-sparing AD; JMP: statistical software (JMP 7.0 from SAS Institute, North Carolina, USA); LBD: Lewy body dementia; MCI: Mild cognitive impairment; MNI: Montreal Neurological Institute; MRI: Magnetic resonance imaging; Multi-ROI: More than one region of interest, usually more than one per side; ROC: Receiver operating characteristics analysis; ROI: Region of interest (similar to VOI, volume of interest); SD: Semantic dementia, a variety of FTLD; Twin-ROI: only one region of interest on each side, approximately symmetric, e.g., left + right entorhinal cortex; sMRI: Structural magnetic resonance imaging; SPM: Statistical parametric mapping (SPM8 in this study, from the Wellcome Department of Imaging Neuroscience, London, United Kingdom); SUVR: Standard uptake value ratio, in PiB-PET, a pseudo-quantitative measure of amyloid concentration; VaD: Vascular dementia; VBM: Voxel-based morphometry; VOI: Volume of interest (similar to ROI, region of interest); VSRAD: Voxel-based specific regional analysis system for Alzheimer’s disease (Advance version)
The known causes of dementia are many. Alzheimer’s disease (AD) is the most common cause in most populations, and AD-type pathological changes (including amyloid and tau metabolism) begin many years before symptoms; the earlier they and other pathologies can be identified, the better for study and for intervention. It is important also to distinguish those who show poor cognitive abilities (many only temporarily) but are otherwise normal. Amyloid imaging by PET is very effective for identifying AD-type pathology, and PET data were used in this study, but PET is expensive and less available than MRI. MRI, though not cheap, is non-invasive and safe, and while still under development it may offer advantages; it has even been described as an ideal tool for whole-brain assessment [1].
Good information may allow good decisions, and SPM can yield plenty of information, but the questions are how much of it to use, and how. For the maximum signal-to-noise ratio, one can focus on the region or regions expected to show the earliest atrophic changes. In typical AD-type pathology, this mostly means the medial temporal lobe, especially the entorhinal cortex and hippocampus [2-4]. VSRAD, widely trusted in Japan, uses an empirically-selected bilateral twin ROI in the entorhinal/ hippocampal vicinity [5].
However, for a number of reasons, that region is neither a perfect biomarker nor necessarily sufficient. More brain data may be needed for better and earlier differentiation; for additional data from other regions to be explored, and for data to be compared between studies and between centers, thorough use of atlas-based regions is vital. BAAD was designed to give unbiased data for all 90 of the MNI atlas regions plus eight extras, and to use data from any number and combination of those regions.
This study reports the results of testing twin and multiple ROIs against a publicly available sample from the ADNI database.
The aim of this study was to make a pilot assessment of the relative merits of twin versus multiple regions of interest in diagnostic neuroimaging through statistical parametric mapping (SPM) from structural magnetic resonance images (sMRI), using two software packages: VSRAD and BAAD. These were both tested with sMRI data against amyloid-positive and amyloid-negative findings in a data-set provided by the Alzheimer's Disease Neuroimaging Initiative (ADNI).
One package, VSRAD, has been available and widely used in Japan for some years, and the other, BAAD, is under development by a group of researchers, also in Japan.
A set of data representing 65 patients (mean age 75 ± 8 y/o, mean MMSE score 27 ± 2) diagnosed with mild cognitive impairment (MCI) who had undergone both structural sMRI scans and amyloid imaging by Pittsburg compound B (PiB) positron emission tomography (PET) was downloaded from the ADNI database. (Group name; Upitt - PIB PET Analysis [ADNI1], address <https://ida.loni.usc.edu/pages/acccess/studyData.jsp?categoryId=148&subCategoryId=34>, page date 2014). PiB-PET is not absolutely quantitative, and a SUVR threshold was set at 1.5, defining all cases with values below 1.5 as amyloid-negative and thus not representative of AD-type pathology, while all cases (n=18) scoring over 1.5 were considered likely to be representative of AD-type pathology. Of the MCI patients who were initially classified as amyloid-negative by PiB-PET, 3 showed an increase in SUVR from below to above 1.5 during the year after their initial consultation, but they were classified as negative because that was their status at the time of their MRI.
Voxel-based morphometry (VBM) is an analytical approach intended to assess every voxel of a brain image “on a voxel-by-voxel basis” [6,7]. Statistical parametric mapping (SPM) was developed for VBM interpretation, and this report describes two software packages founded on SPM8 software produced by the Wellcome Department of Imaging Neuroscience, London, UK. SPM relies on the compilation, via segmentation and registration, of a template brain from a sample of a population, complete with a statistical model of MRI signal intensity distribution for every voxel (a tissue probability map). The model is then compared to a patient’s MRI image or to another combined model of a sample or population, and the software calculates the differences in terms of standard deviations between the model brain and the other brain or model; a positive z-score in this context indicates atrophy in the subject. In the twin-ROI approach only two ROIs are described, one in each side of the brain, typically with an averaged z-score. In a multi-ROI approach more regions are processed, and not necessarily bilaterally.
One package, Voxel-based Specific Regional analysis system for Alzheimer’s Disease (VSRAD, http://www.vsrad.info/index2.html, in Japanese), has been described as synonymous with “SPM8 plus DARTEL” [8]. It was developed by Matsuda et al., [9] and with further developments has been available and widely used in Japan for some years [10]. It was intended to optimise the signal-to-noise ratio by focusing on a bilateral twin region or volume of interest (ROI or VOI). A typical false-colour map in VSRAD shows a false-coloured patch in each side of a mostly grayscale brain. As the name implies, it is largely used for identifying AD-type pathology. The VSRAD ROIs can be placed anywhere, but they are usually in the region of the entorhinal cortex and hippocampus, where SPM maps of a sample population indicate the greatest Z-scores early in AD-type pathology cases. The VSRAD default ROI location is thus empirically derived, and need not match standard anatomical boundaries [10].
Brain Anatomical Analysis using DARTEL (BAAD) (http://www.shiga-med.ac.jp/~hqbioph/saito/BAAD%28English%29.html) is under continuing development, also by a research group in Japan. If VSRAD may be described as “SPM8 plus DARTEL”, so too may BAAD, but with the addition and integration of three further software toolkits onto that SPM base: Wfu_Pickatlas (Maldigian et al., http://fmri.wfubmc.edu/software/PickAtlas), MarsBaR (MARSeille Boîte À Région d’Intérêt; Brett et al., MarsBaR region of interest toolbox for SPM http://marsbar.sourceforge.net), and XjView (a viewing program for SPM, http://www.alivelearn.net/xjview8/). Other aspects of improving signal-to-noise ratios arise in BAAD processing: BAAD uses maximum-likelihood estimation (MLE) and maximum a-posteriori (MAP) algorithms for more complete and accurate segmentation, and MarsBaR re-calculates t-values within each region, to avoid any masking threshold effect in order to improve accuracy. BAAD is supplied with a standard dataset copied from the IXI database (Information Extraction from Images, Control Group IXI7080), but with the option to use any alternate dataset to suit a target population.
ROC curves (Figures 1-6) were plotted by comparing the Z-scores calculated by BAAD and VSRAD against the PiB-PET results, and 2x2 contingency scores (Table 1) were calculated using JMP software (SAS, http://www.jmp.com/en_us/home.html).
Table 1. The results of AUC calculations and 2x2 contingency tables for various selections of ROIs, showing that figures for accuracy etc. may increase not only with increasing numbers of ROIs, but also with specific selections of ROIs. The best scores here were achieved with a post hoc selection of 10 ROIs, and even a select set of 8 ROIs gave a considerable improvement over the routine 8 ROIs. AUC: area under the ROC curve. AUC Increase: change relative to the VSRAD default result
ROI Selection |
AUC |
AUC increase |
Sensitivity |
Specificity |
Accuracy |
Positive likelihood |
Negative likelihood |
PPV (post-test prob.) |
ROI set 1 (VSRAD) |
0.679 |
- |
0.65 |
0.556 |
0.585 |
1.463 |
0.63 |
0.394 |
ROI set 2 (4 ROIs) |
0.694 |
2.2% |
0.65 |
0.622 |
0.631 |
1.721 |
0.563 |
0.433 |
ROI set 3 (8 ROIs) |
0.773 |
13.8% |
0.65 |
0.778 |
0.739 |
2.925 |
0.45 |
0.565 |
ROI set 4 (12 ROIs) |
0.861 |
26.8% |
0.65 |
0.8 |
0.754 |
3.25 |
0.438 |
0.591 |
ROI set 5 (16 ROIs) |
0.860 |
26.7% |
0.75 |
0.756 |
0.754 |
3.068 |
0.331 |
0.577 |
ROI set 6 (11 ROIs) |
0.979 |
44% |
0.8 |
0.867 |
0.846 |
6 |
0.231 |
0.727 |
ROI set 7 (10 ROIs) |
0.989 |
45.7% |
1 |
0.956 |
0.969 |
22.5 |
0 |
0.909 |
ROI set 8 (8 ROIs) |
0.94 |
38.4% |
0.8 |
0.844 |
0.831 |
5.14 |
0.237 |
0.696 |
ROC curves were plotted to measure the reliability of each selection of ROIs, so that the area under each curve (AUC) accounts for positive and negative, true and false results. We found the results listed here, and calculated sensitivity and other measures by 2x2 contingency tables as shown in Table 1:
ROI selection 1. With the VSRAD default ROI in the hippocampal/entorhinal vicinity, AUC = 0.679 (Figure 1).
The AUC results of BAAD varied according to the ROIs selected:
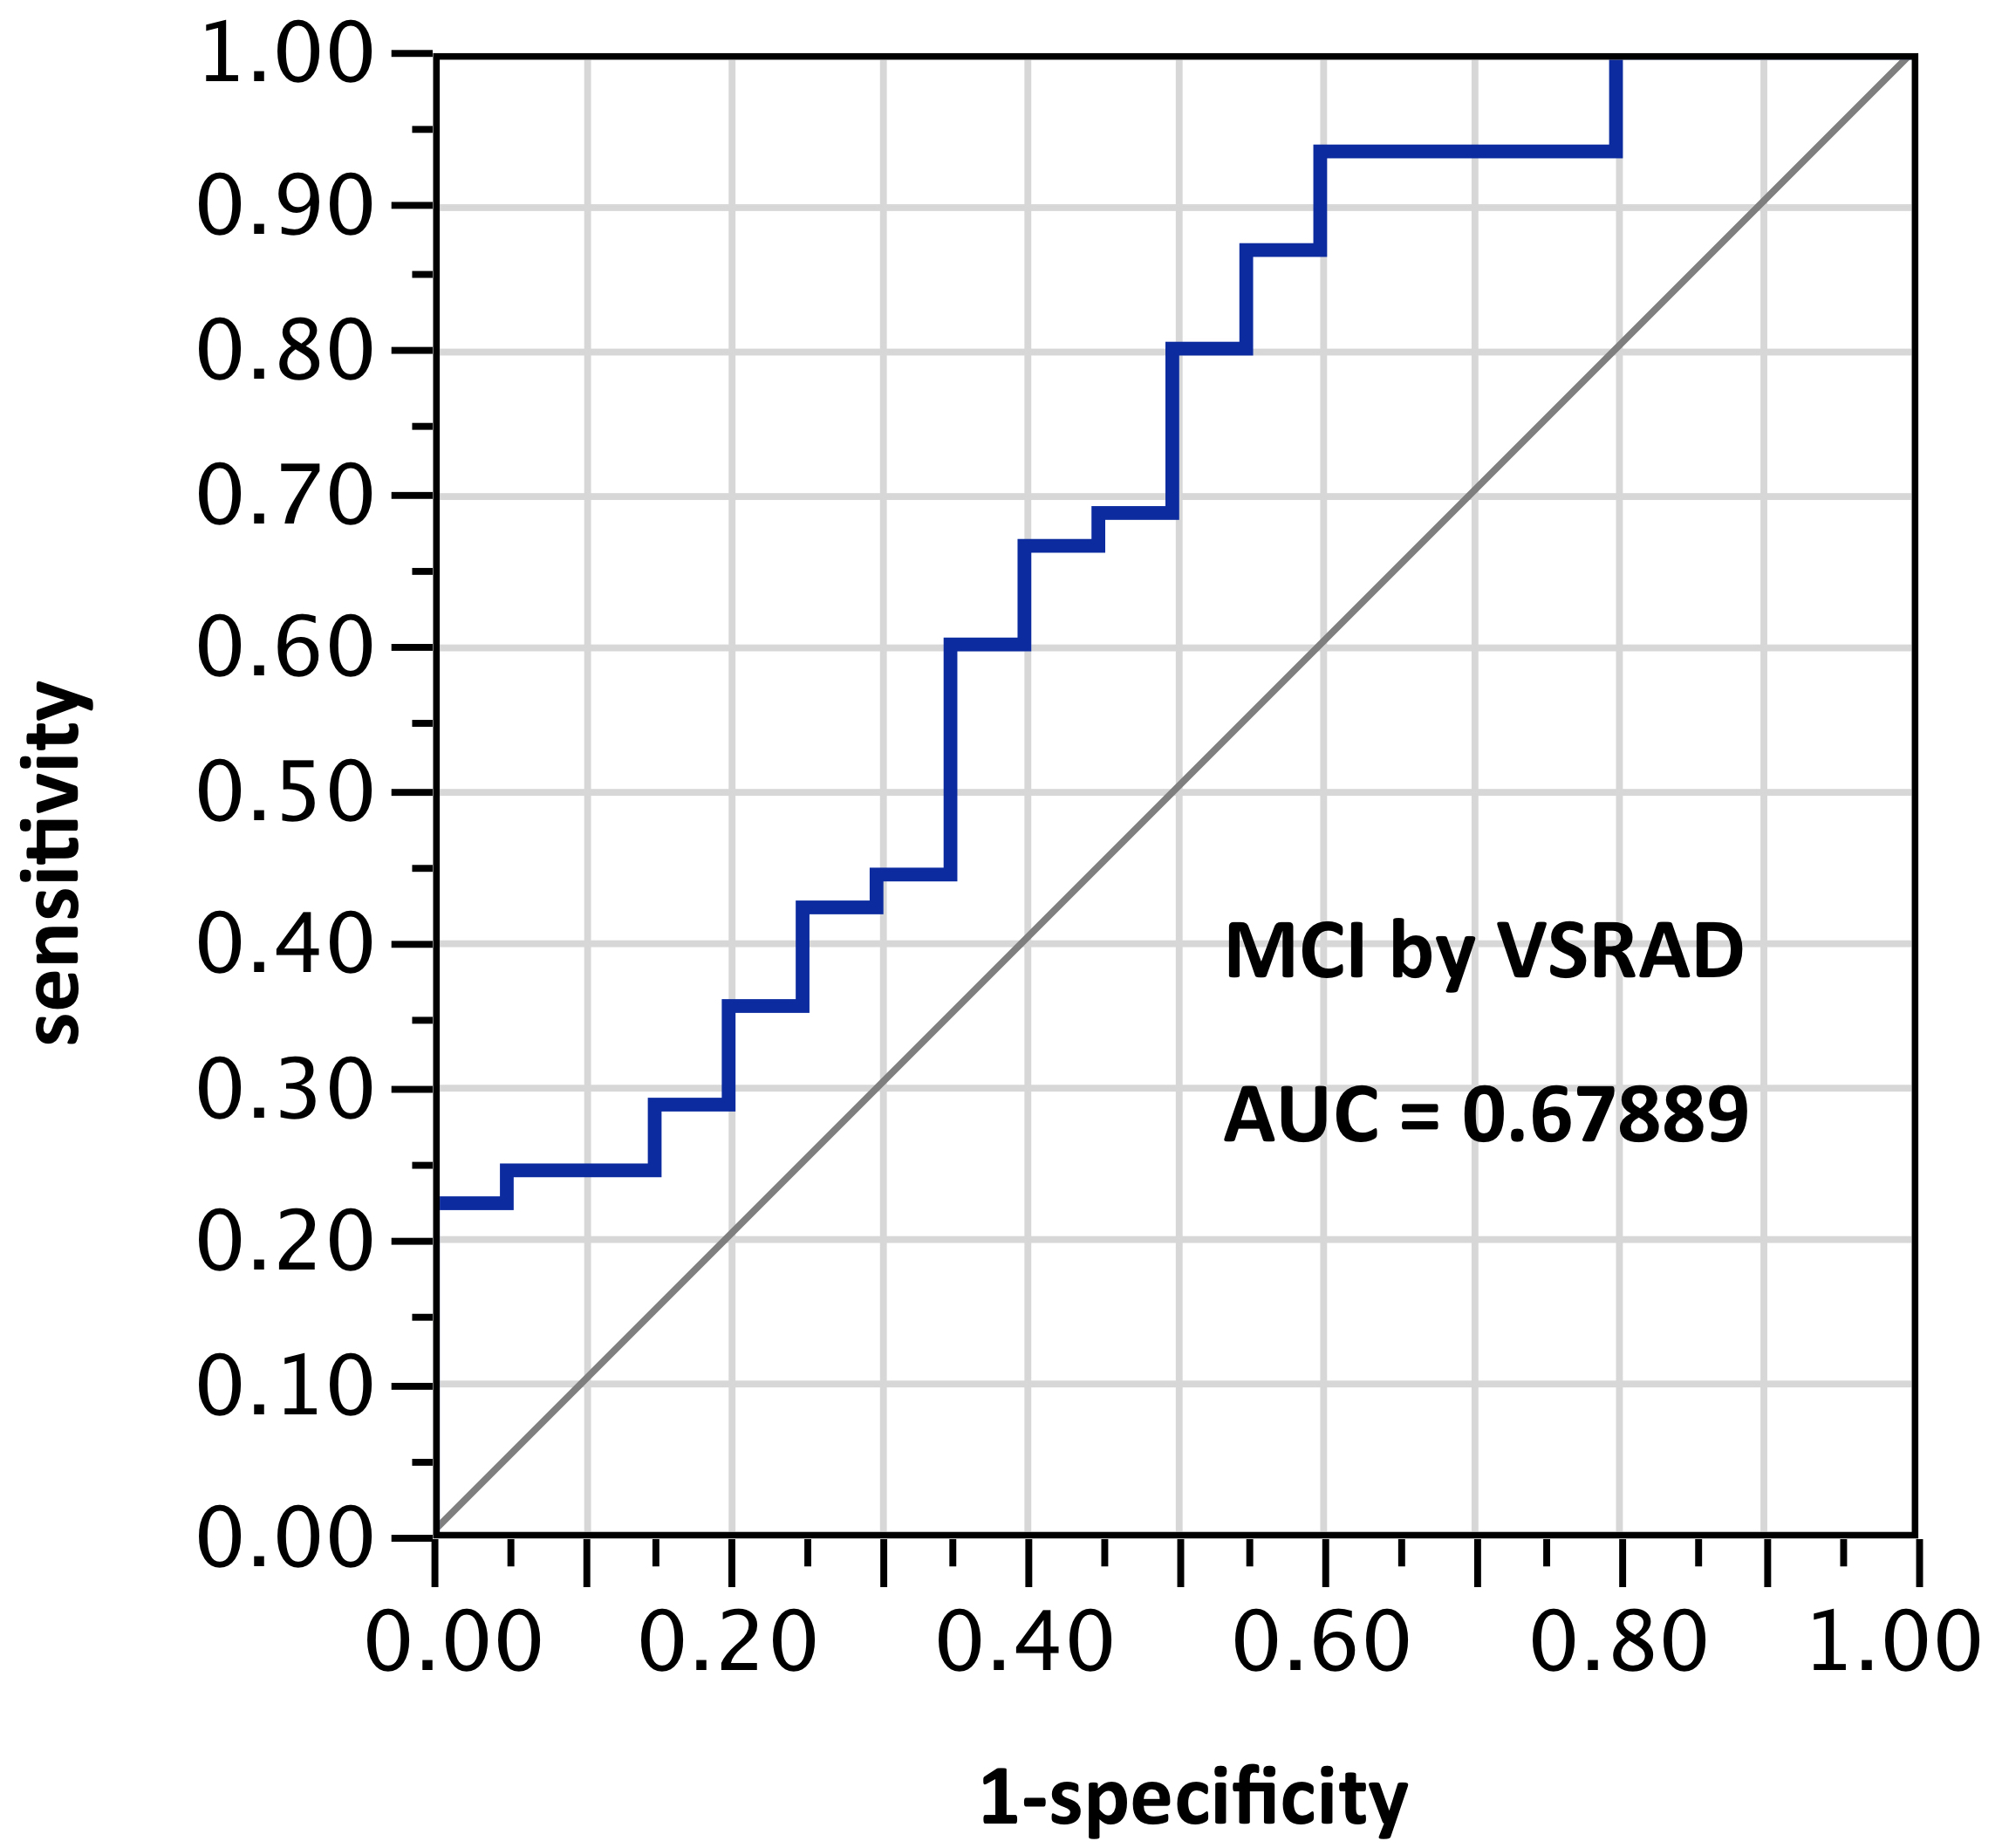
Figure 1. AUC=0.679. MCI differentiation (against PiB-PET status) by VSRAD with default ROIs
ROI selection 2. BAAD using only the bilateral anterior and posterior hippocampus regions (Figure 2, with 2 ROIs per side, for a total of 4 ROIs), AUC = 0.694.
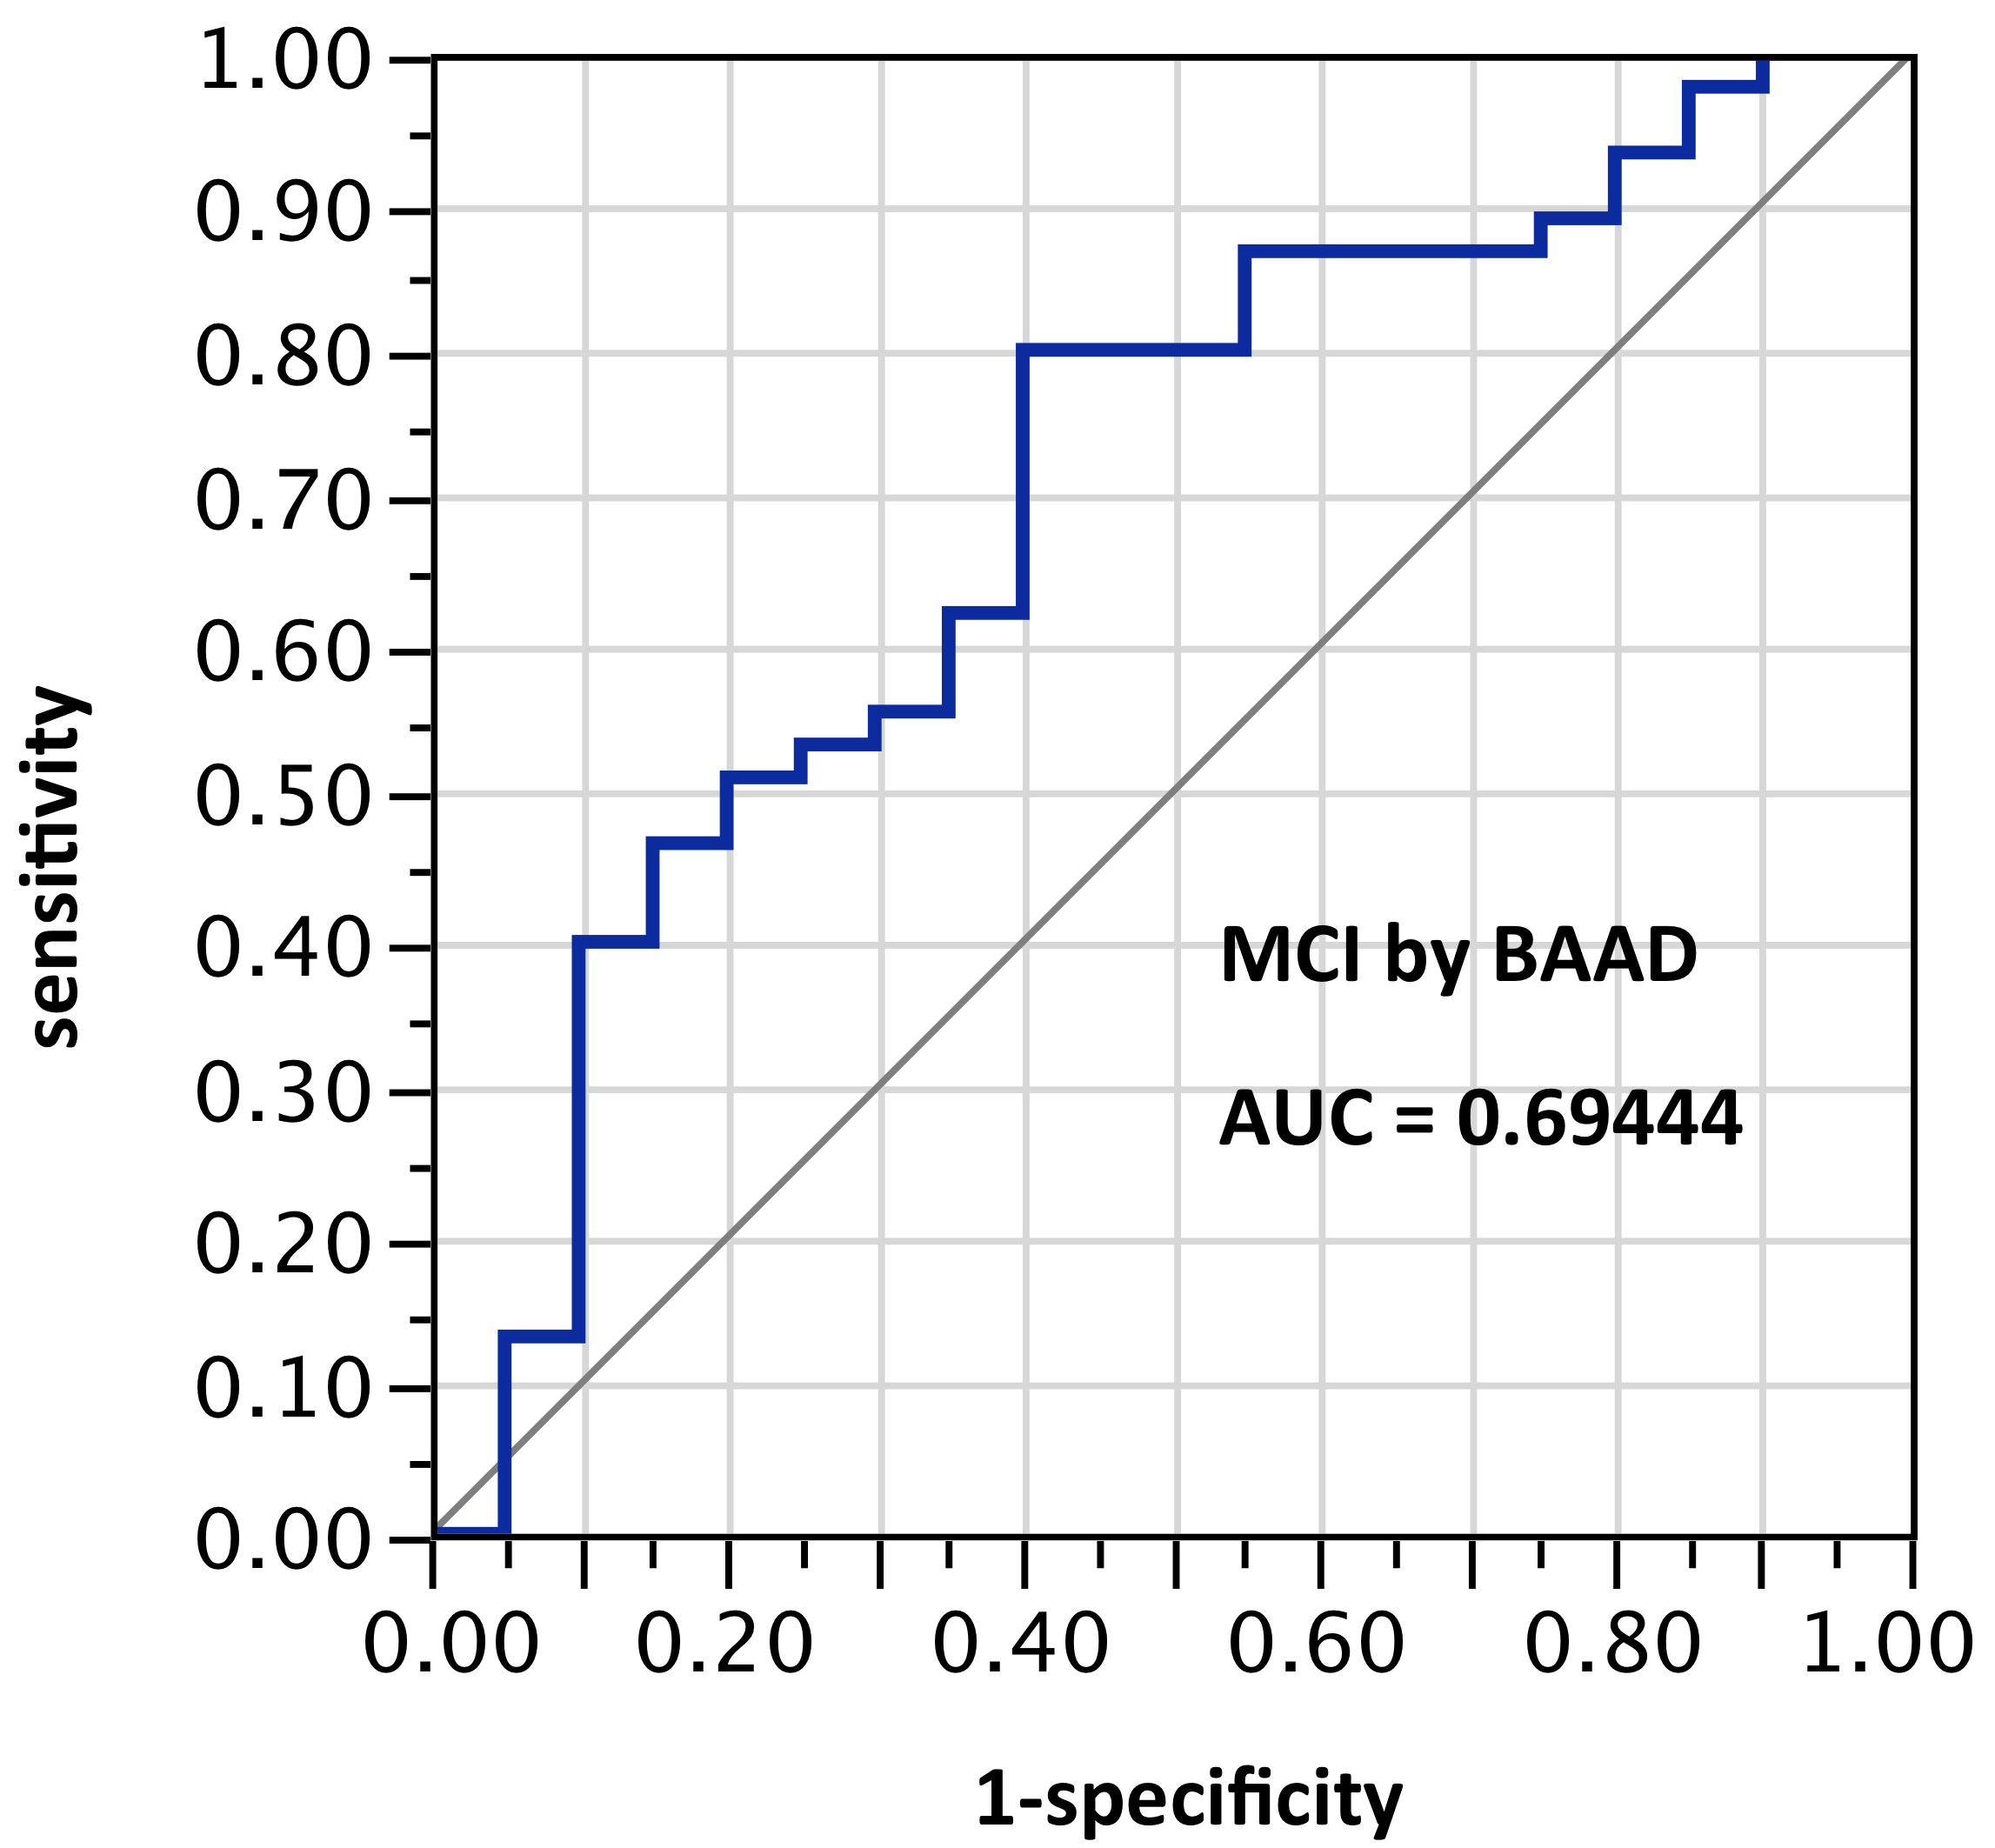
Figure 2. AUC=0.694. MCI differentiation (against PiB-PET status) by BAAD using z-scores in these ROIs: Anterior hippocampus + posterior hippocampus, bilaterally (total: 4 ROIs). This is a slightly better AUC than achieved by VSRAD, which is unexpected because VSRAD uses a default ROI empirically derived for maximum accuracy. One possible reason would be differences between the ABP database built into VSRAD and the IXI database used by default in BAAD, and another would be the extra software (MLE and MAP described above) intended to improve accuracy in BAAD
ROI selection 3. BAAD using the bilateral hippocampus and entorhinal regions, (Figure 3, with 4 ROIs each side for a total of 8 ROIs); AUC = 0.773. Given the nature of the VSRAD bilateral ROI derivation, one might expect AUC equal to VSRAD with this selection.
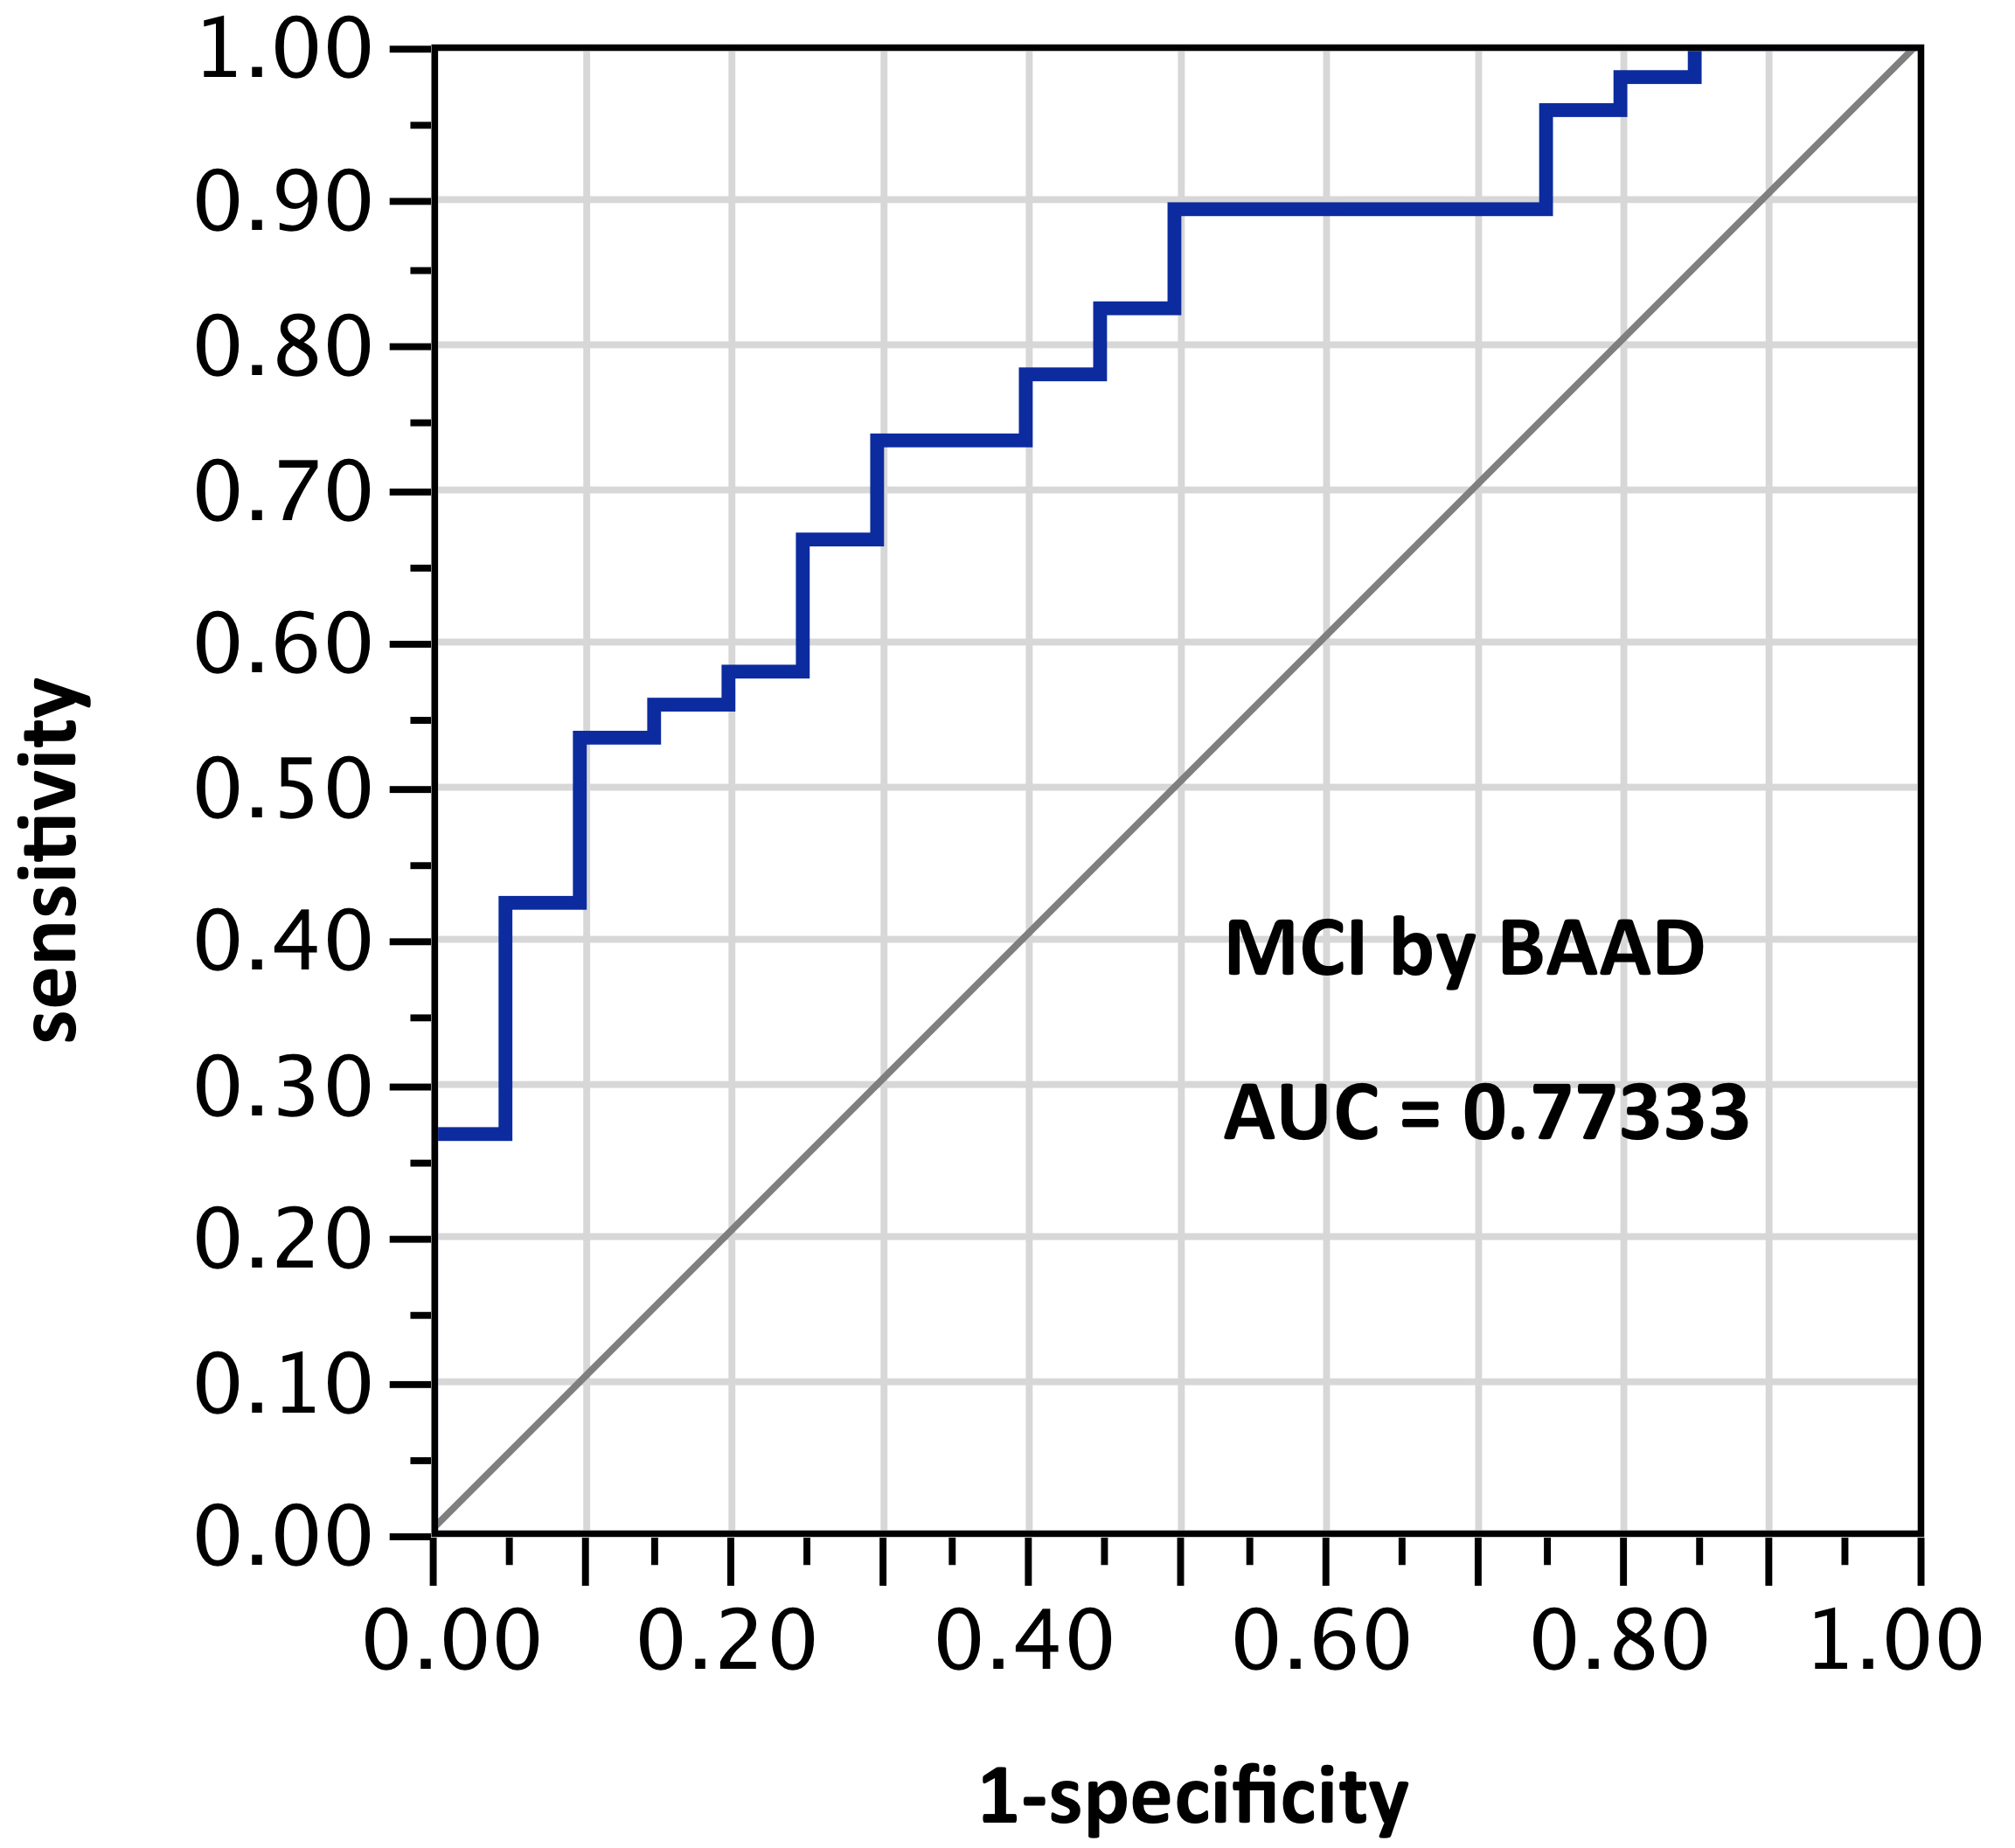
Figure 3. AUC=0.773. MCI differentiation (against PiB-PET status) by BAAD using z-scores in these bilateral ROIs: Anterior hippocampus + posterior hippocampus + Ba28 + BA34 (total = 8 ROIs)
ROI selection 4. BAAD using 12 ROIs (those same bilateral hippocampus and entorhinal regions plus bilateral amygdala and parahippocampal gyrus). Figure 4, with 6 ROIs each side, for a total of 12 ROIs). AUC = 0.861.
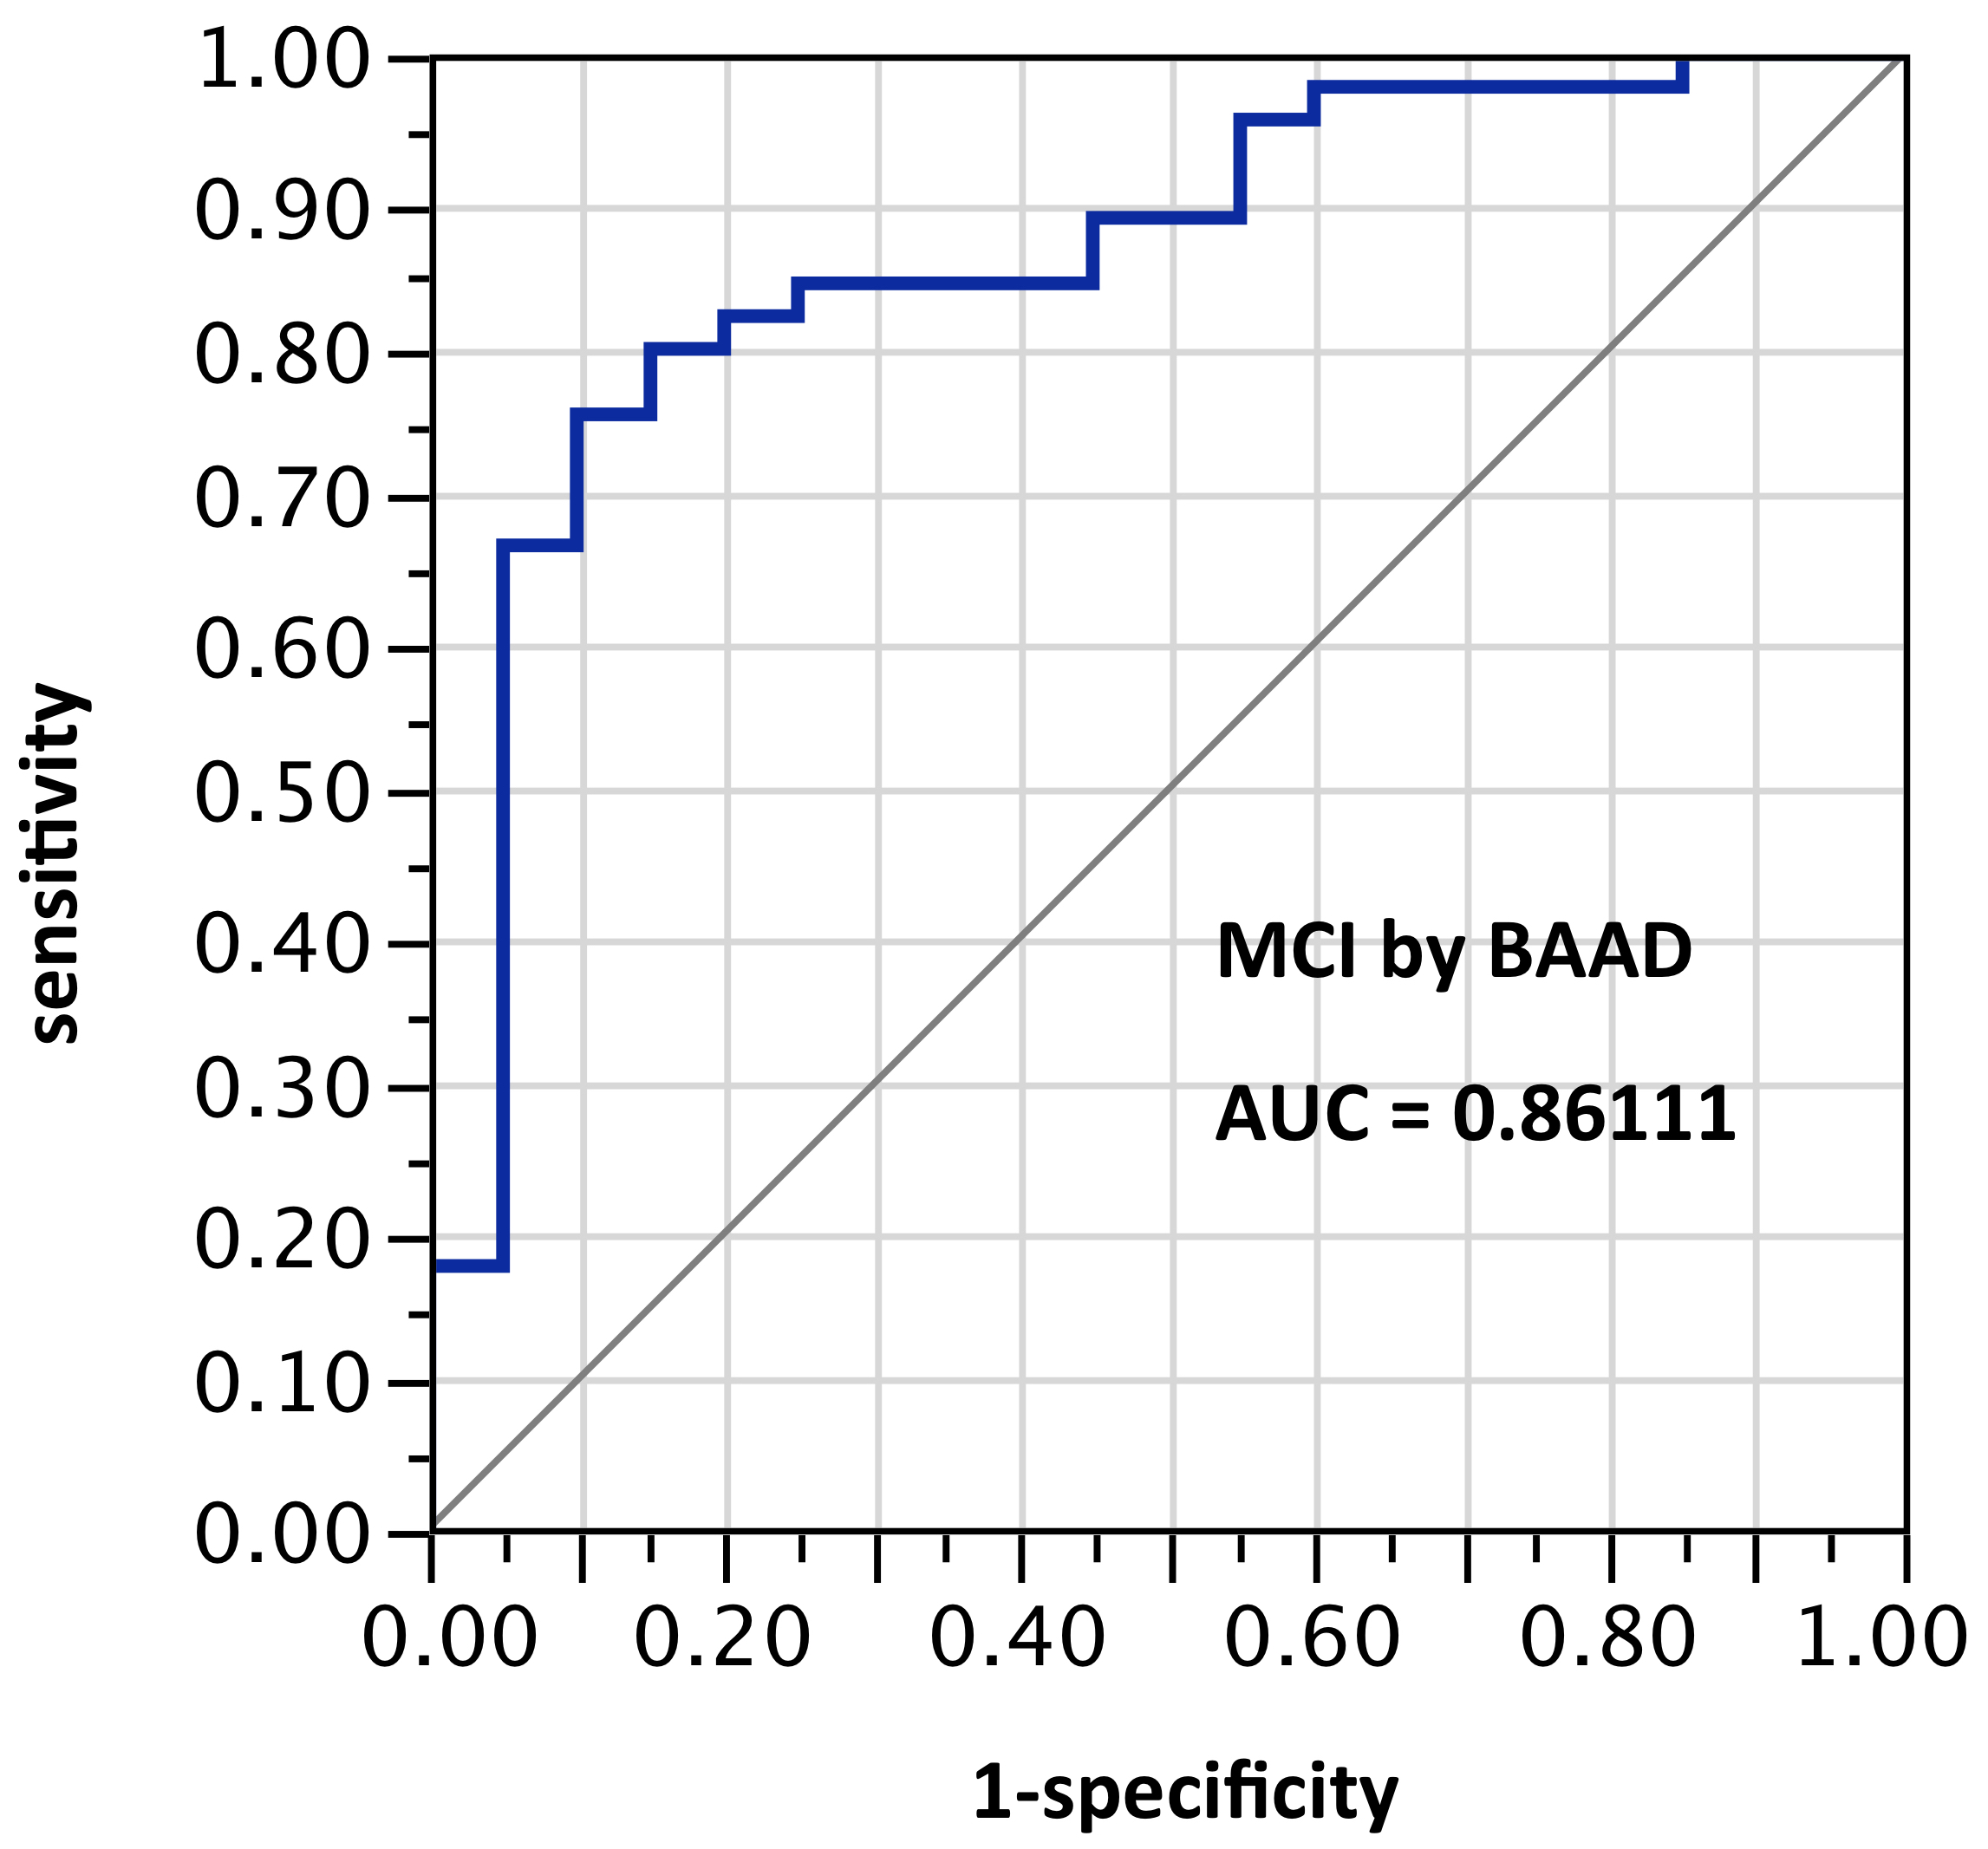
Figure 4. AUC=0.8611. MCI differentiation (against PiB-PET status) by BAAD using z-scores in these bilateral ROIs: anterior hippocampus + posterior hippocampus + Ba28 + BA34 + amygdala + parahippocampal gyrus (total = 12 ROIs)
ROI selection 5. BAAD using those same bilateral hippocampus and entorhinal regions, plus amygdala, plus posterior cingulum, plus fusiform gyrus, plus inferior temporal region (Figure 5, with 8 ROIs each side, for a total of 16 ROIs). AUC = 0.860.
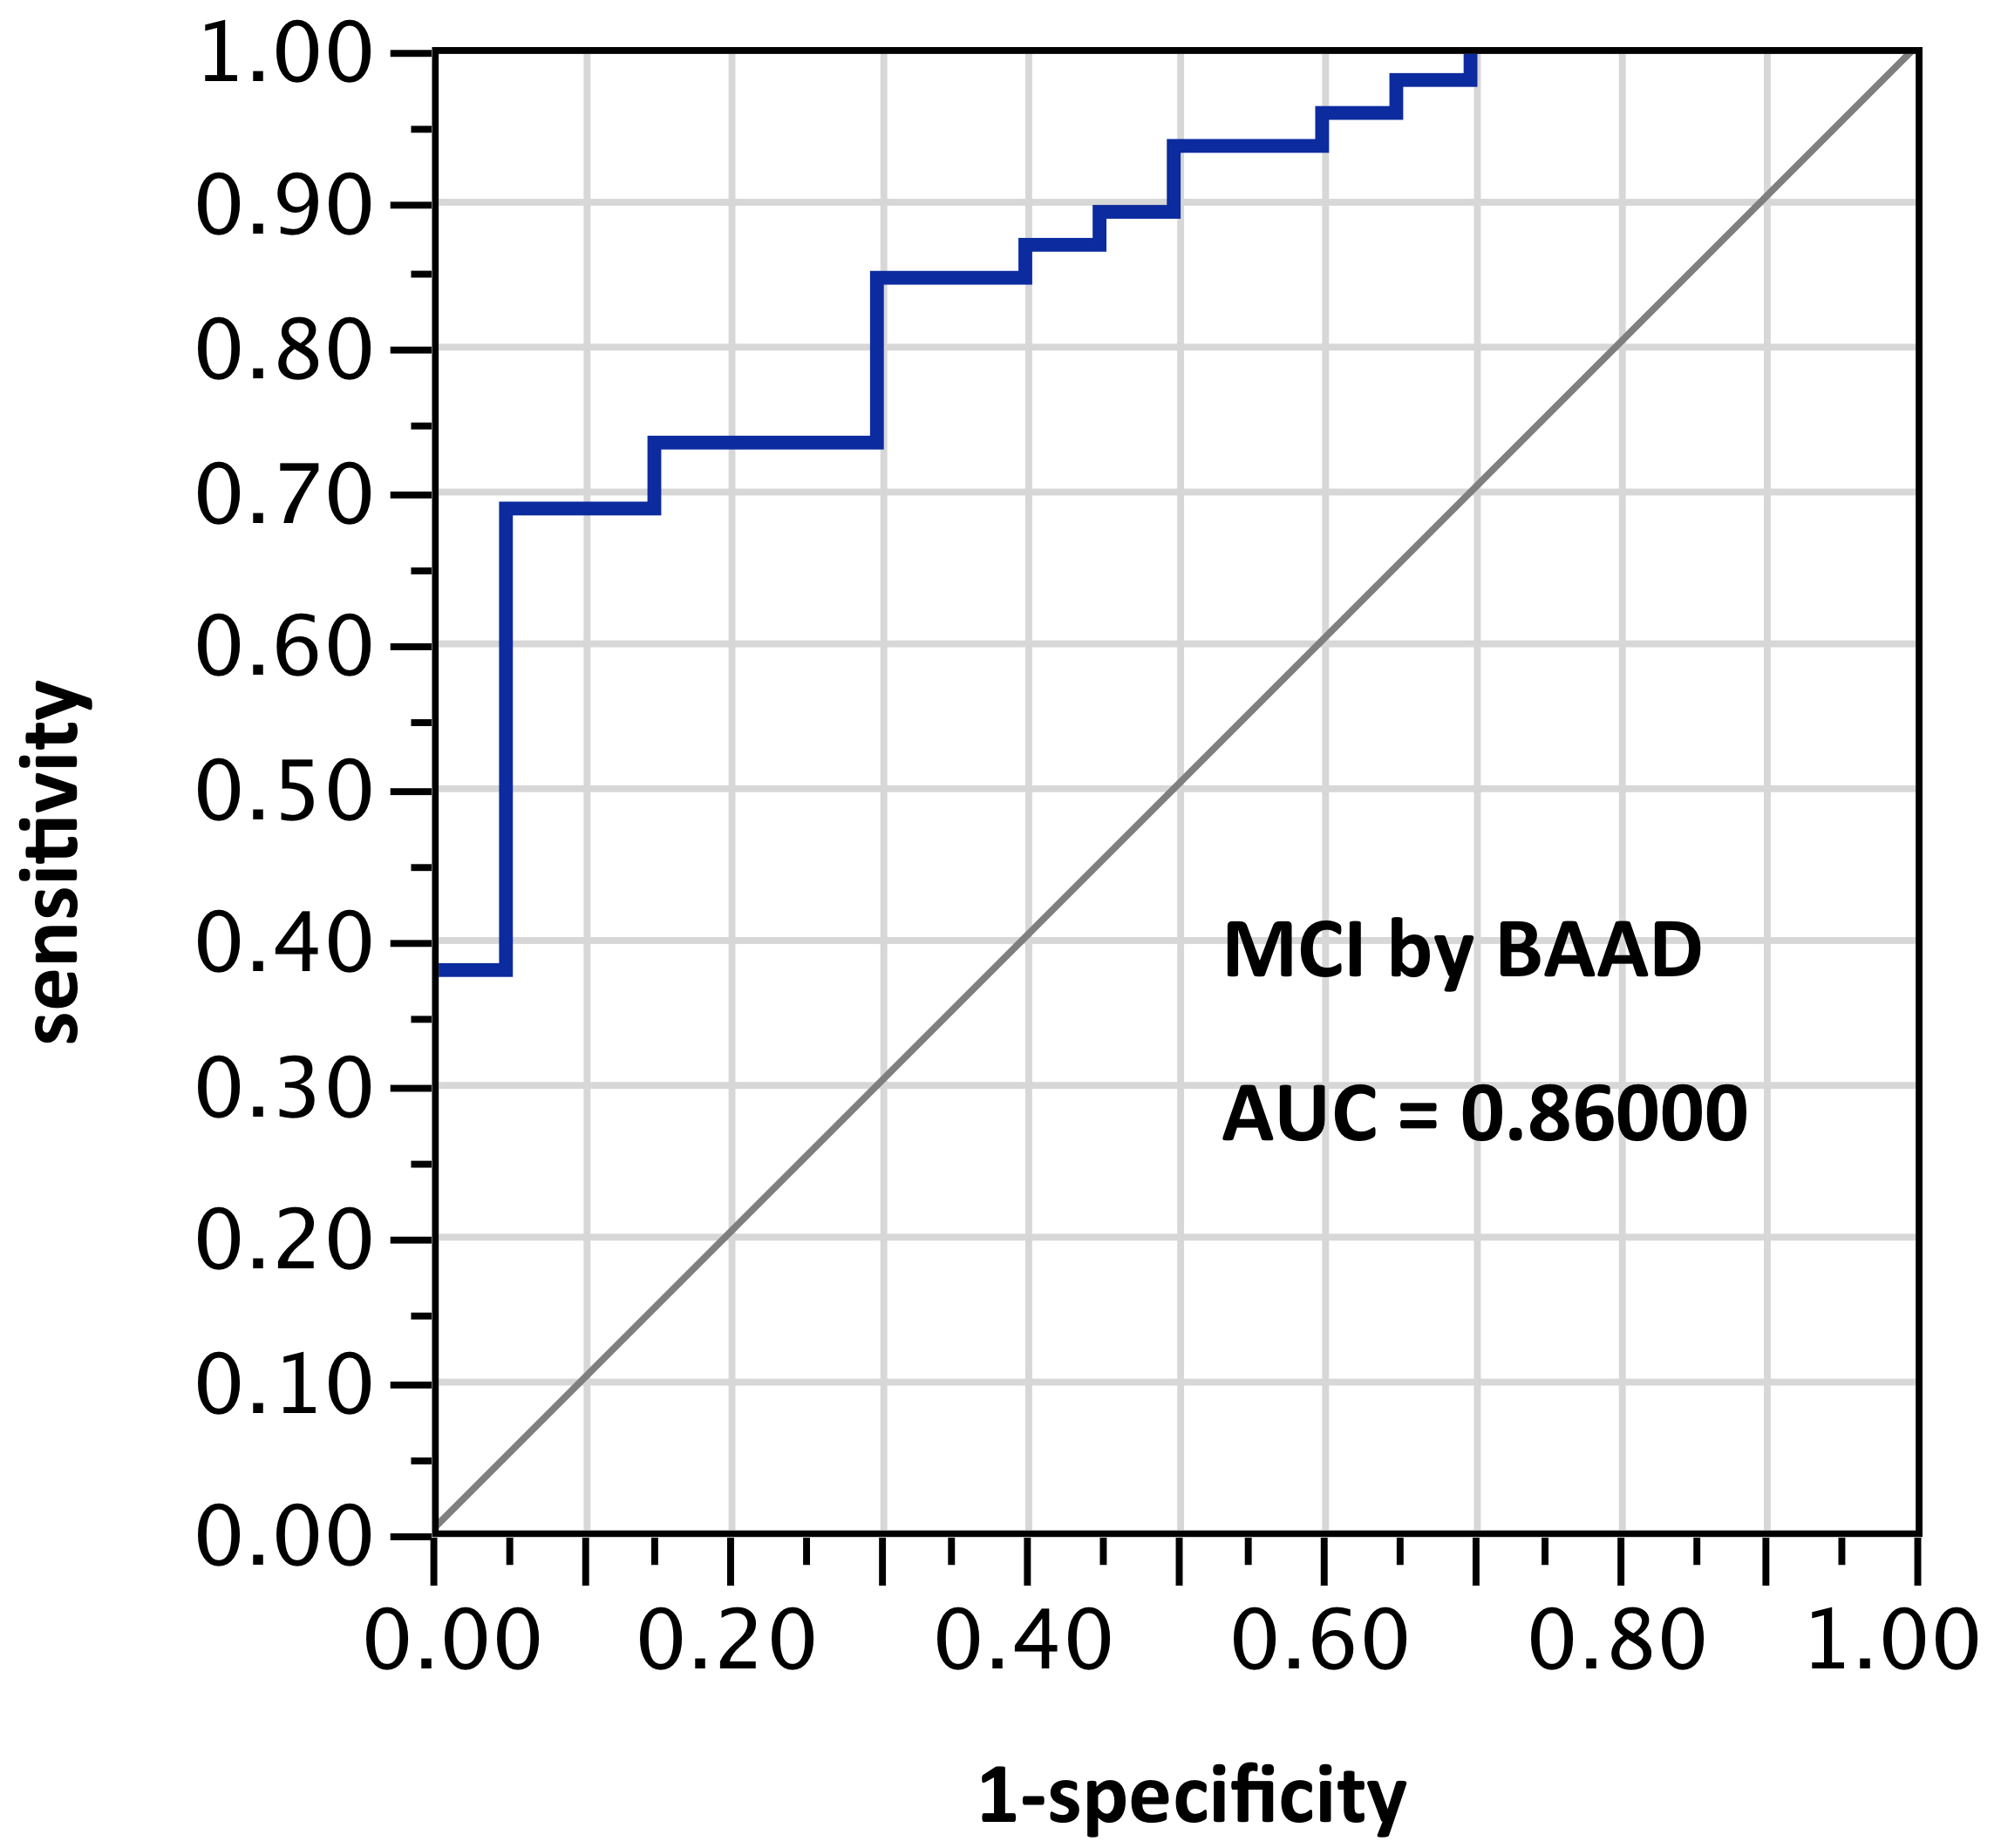
Figure 5. AUC=0.860. MCI differentiation (against PiB-PET status) by BAAD using z-scores in these ROIs: anterior hippocampus + posterior hippocampus + Ba28 + BA34 + amygdala + posterior cingulum + fusiform gyrus + inferior temporal, bilaterally (total=16 ROIs). Apparently the contribution of the parahippocampal gyrus is equivalent to that of the posterior cingulum + fusiform gyrus + inferior temporal regions here
ROI selection 6. BAAD with 11 ROIs (mostly unilateral) selected post hoc (“cherry-picking”) by stepwise forward selection logistic regression, tested against the sample from which they were derived. (Figure 6, with the following ROIs: left anterior hippocampus, right BA28, (part of the entorhinal region), left amygdala, right inferior frontal (the triangular part), middle frontal gyrus, left superior medial frontal, right superior medial frontal, right inferior parietal lobe, left superior parietal lobe, left precuneus, left superior temporal pole.) AUC=0.979.
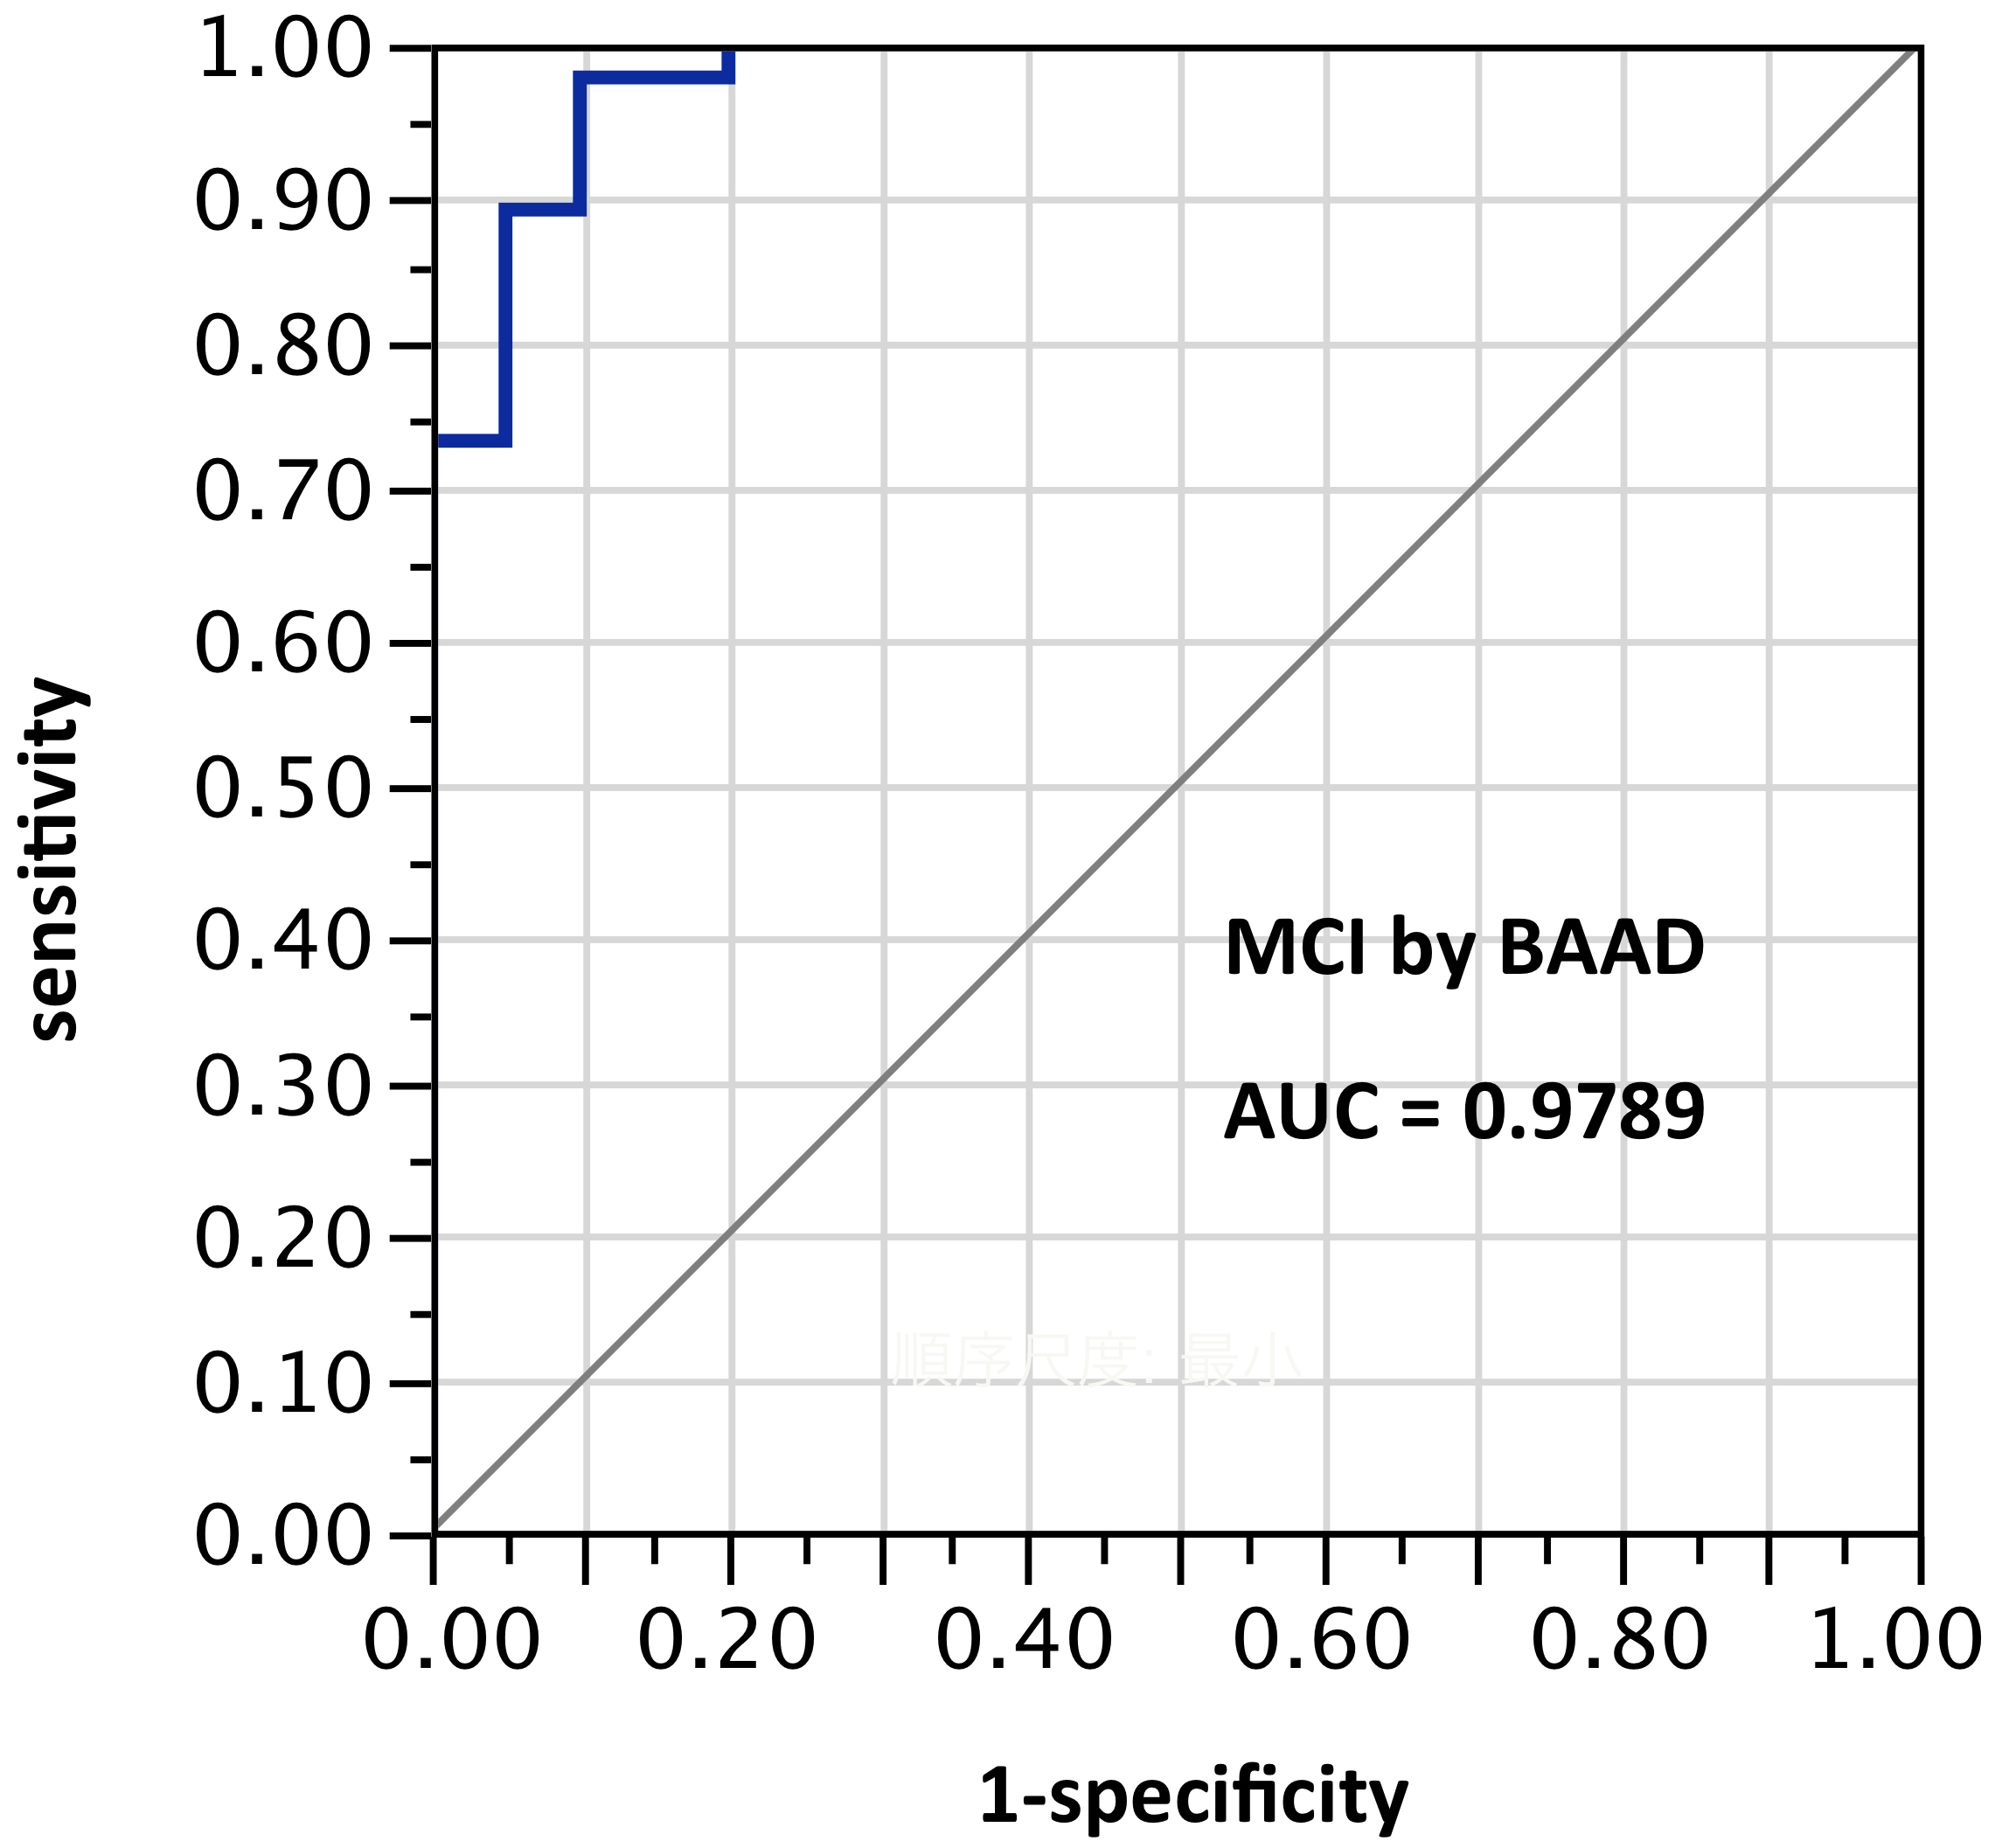
Figure 6. AUC=0.979. MCI differentiation (against PiB-PET status) by BAAD using z-scores in these 11 ROIs selected post hoc but not yet validated: left anterior hippocampus, right BA28, (part of the entorhinal region), left amygdala, right inferior frontal, triangular part, right middle frontal gyrus, left superior medial frontal, right superior medial frontal, right inferior parietal lobe, left superior parietal lobe, left precuneus, left superior temporal pole
ROI selection 7. BAAD with a different post hoc selection of 10 ROIs: right BA28, left amygdala, left angular gyrus, left frontal inferior operculum, left superior medial frontal + right superior medial frontal, left middle occipital, left superior parietal, left Rolandic operculum, and left middle temporal pole. This alternate selection showed the best performance overall, though with fewer ROIs than sets 5 and 6. Pending validation, this nevertheless seems to indicate considerable potential for improved performance using ROI-selections calculable from atlas-based morphometry. AUC=0.989.
ROI selection 8. BAAD with a third post hoc selection of 8 ROIs: left anterior hippocampus, left amygdala, right inferior triangular frontal, right middle frontal, left inferior parietal, left superior parietal, left superior temporal pole, right thalamus. AUC=0.94. This showed an improvement in test scores, not only over the twin-ROI VSRAD results, but also over ROI set 5, while using only half as many ROIs as set 5. This also will require external validation when further data become available.
Notably, not all these ROIs are contiguous, nor are the selections intuitively obvious. The precuneus is particularly distant from the hippocampus/entorhinal regions, and the precuneus cannot reasonably be included in a twin-ROI approach without abandoning the main target areas.
Test results such as AUC, specificity, and accuracy scores vary greatly with the parameters of each test. The greater and more obvious the difference measured, the better the test seems to perform; the morphometric differences between AD patients and normal healthy controls are usually larger than between amyloid-positive and amyloid-negative MCI, so any test applied to the former difference would seem to perform much better than if applied to the latter, because the sorts of memory impairment which attract a clinical diagnosis of MCI are likely to involve hippocampus dysfunction, which makes morphometric differential diagnosis more difficult. Many reports of morphometric assessment in the medial temporal vicinity show AUC and accuracy scores of at least 0.8 or 85%, and in 2005, Hirata et al. reported VSRAD scoring an AUC of almost 0.95 [9]. In the present report, VSRAD scored an AUC of only 0.68 against a more difficult target sample and with an unvalidated control group. VSRAD was included in the present study, partly to show whether the BAAD results were in a plausible range.
The principle of focusing on the vicinity where the best signal-to-noise ratio is expected (i.e., the hippocampus and entorhinal cortex for AD-type pathology), differentiates AD-type cases at a level widely considered acceptable, as in the ROC curves in Figures 1 and 2. The AUC values are approximately equal between VSRAD and BAAD, despite differences between the ROC curve shapes, which may be due to the difference in control groups and/or the slightly different ROI placements. The fact that the VSRAD result is not visibly better than BAAD despite using an empirically-derived (and hence presumably better) ROI may have been due to the difference in control groups, or to more accurate processing in BAAD, but considerable further testing may be needed to ascertain the effects of different control groups.
As more of the significantly atrophic ROIs are added in BAAD, the AUC improves. A similar improvement is expected if the VSRAD ROIs are expanded to include more of the medial temporal lobes; with VSRAD, however, there would be no standard location, no atlas-based z-score map, nor regional boundaries, all of which are useful or indispensable for multicenter studies. Researchers in other centers, perhaps using other acquisition protocols and even other software packages, should still be able to share and compare data using the same atlas standards; this is possible with BAAD due to the integrated atlas components.
An important limitation of this study arises from the scarcity of data on sMRI + PET cases: the available cases are too few to allow external validation, so while the results presented here indicate considerable potentialities for accuracy, validation will have to wait for enlargement of the database. At the same time, the differences between the AUC scores, especially between figures 2 and 5 showing a 24% increase in AUC, or between figures 2 and 6 showing a 41% increase in AUC, do look very promising.
Comparing Figures 4 and 5, the AUCs show that not all regions are of equal value for differential diagnosis; the contribution of the parahippocampal gyrus seems approximately equal to the combined contribution of the posterior cingulum + fusiform gyrus + inferior temporal. Evidently there may be a law of diminishing returns: more ROIs are better, but only in proportion to the quality of the signal acquired from each.
Figures 6-8 show remarkably high AUCs, from surprising and mostly unilateral selections of ROIs. Notably, not all these ROIs are contiguous; the precuneus is particularly distant from the hippocampus/entorhinal regions, and cannot reasonably be included in a twin-ROI approach without abandoning the main target areas. These sets were selected by post hoc “cherry-picking”, and applied to the sample from which they were derived; while they need to be validated on further cases not yet available, the test scores are so much higher than the usual as to deserve some further investigation.
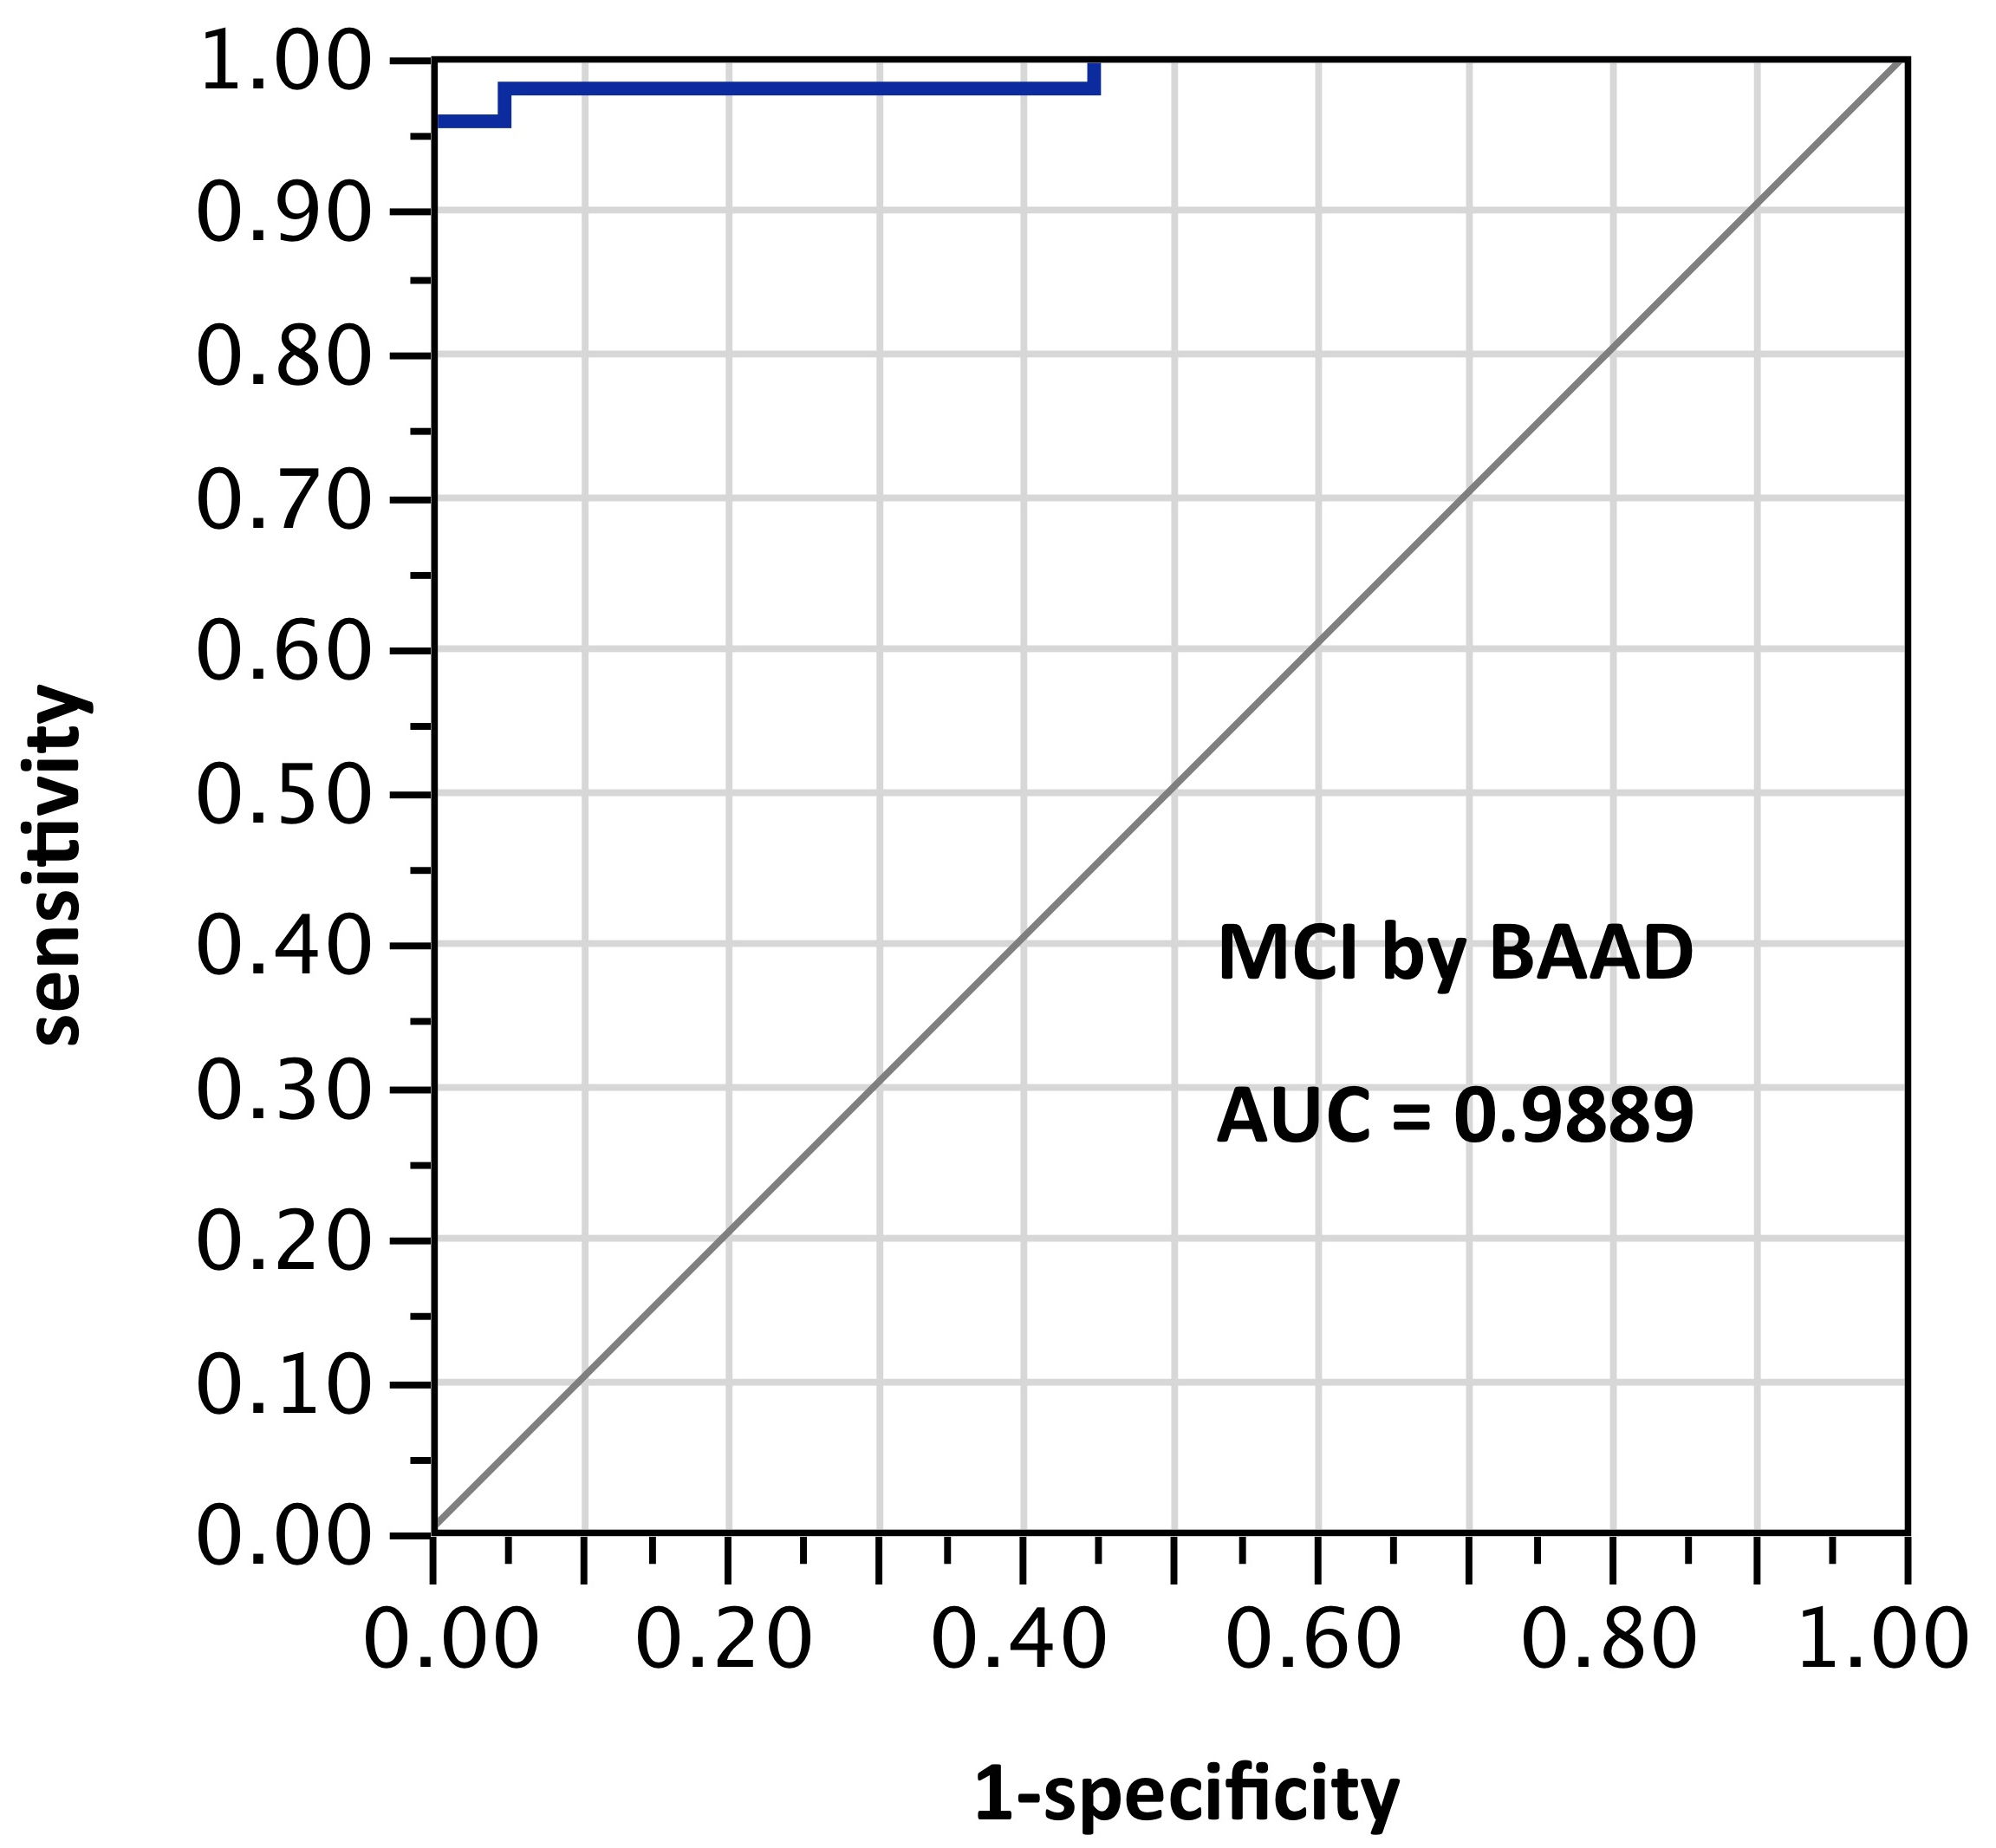
Figure 7. AUC=0.989. This is similar to Figure 6, but using z-scores in these 10 ROIs selected post hoc and not yet validated: right BA28, left amygdala, left angular gyrus, left frontal inferior operculum, left superior medial frontal + right superior medial frontal, left middle occipital, left superior parietal, left Rolandic operculum, and left middle temporal pole
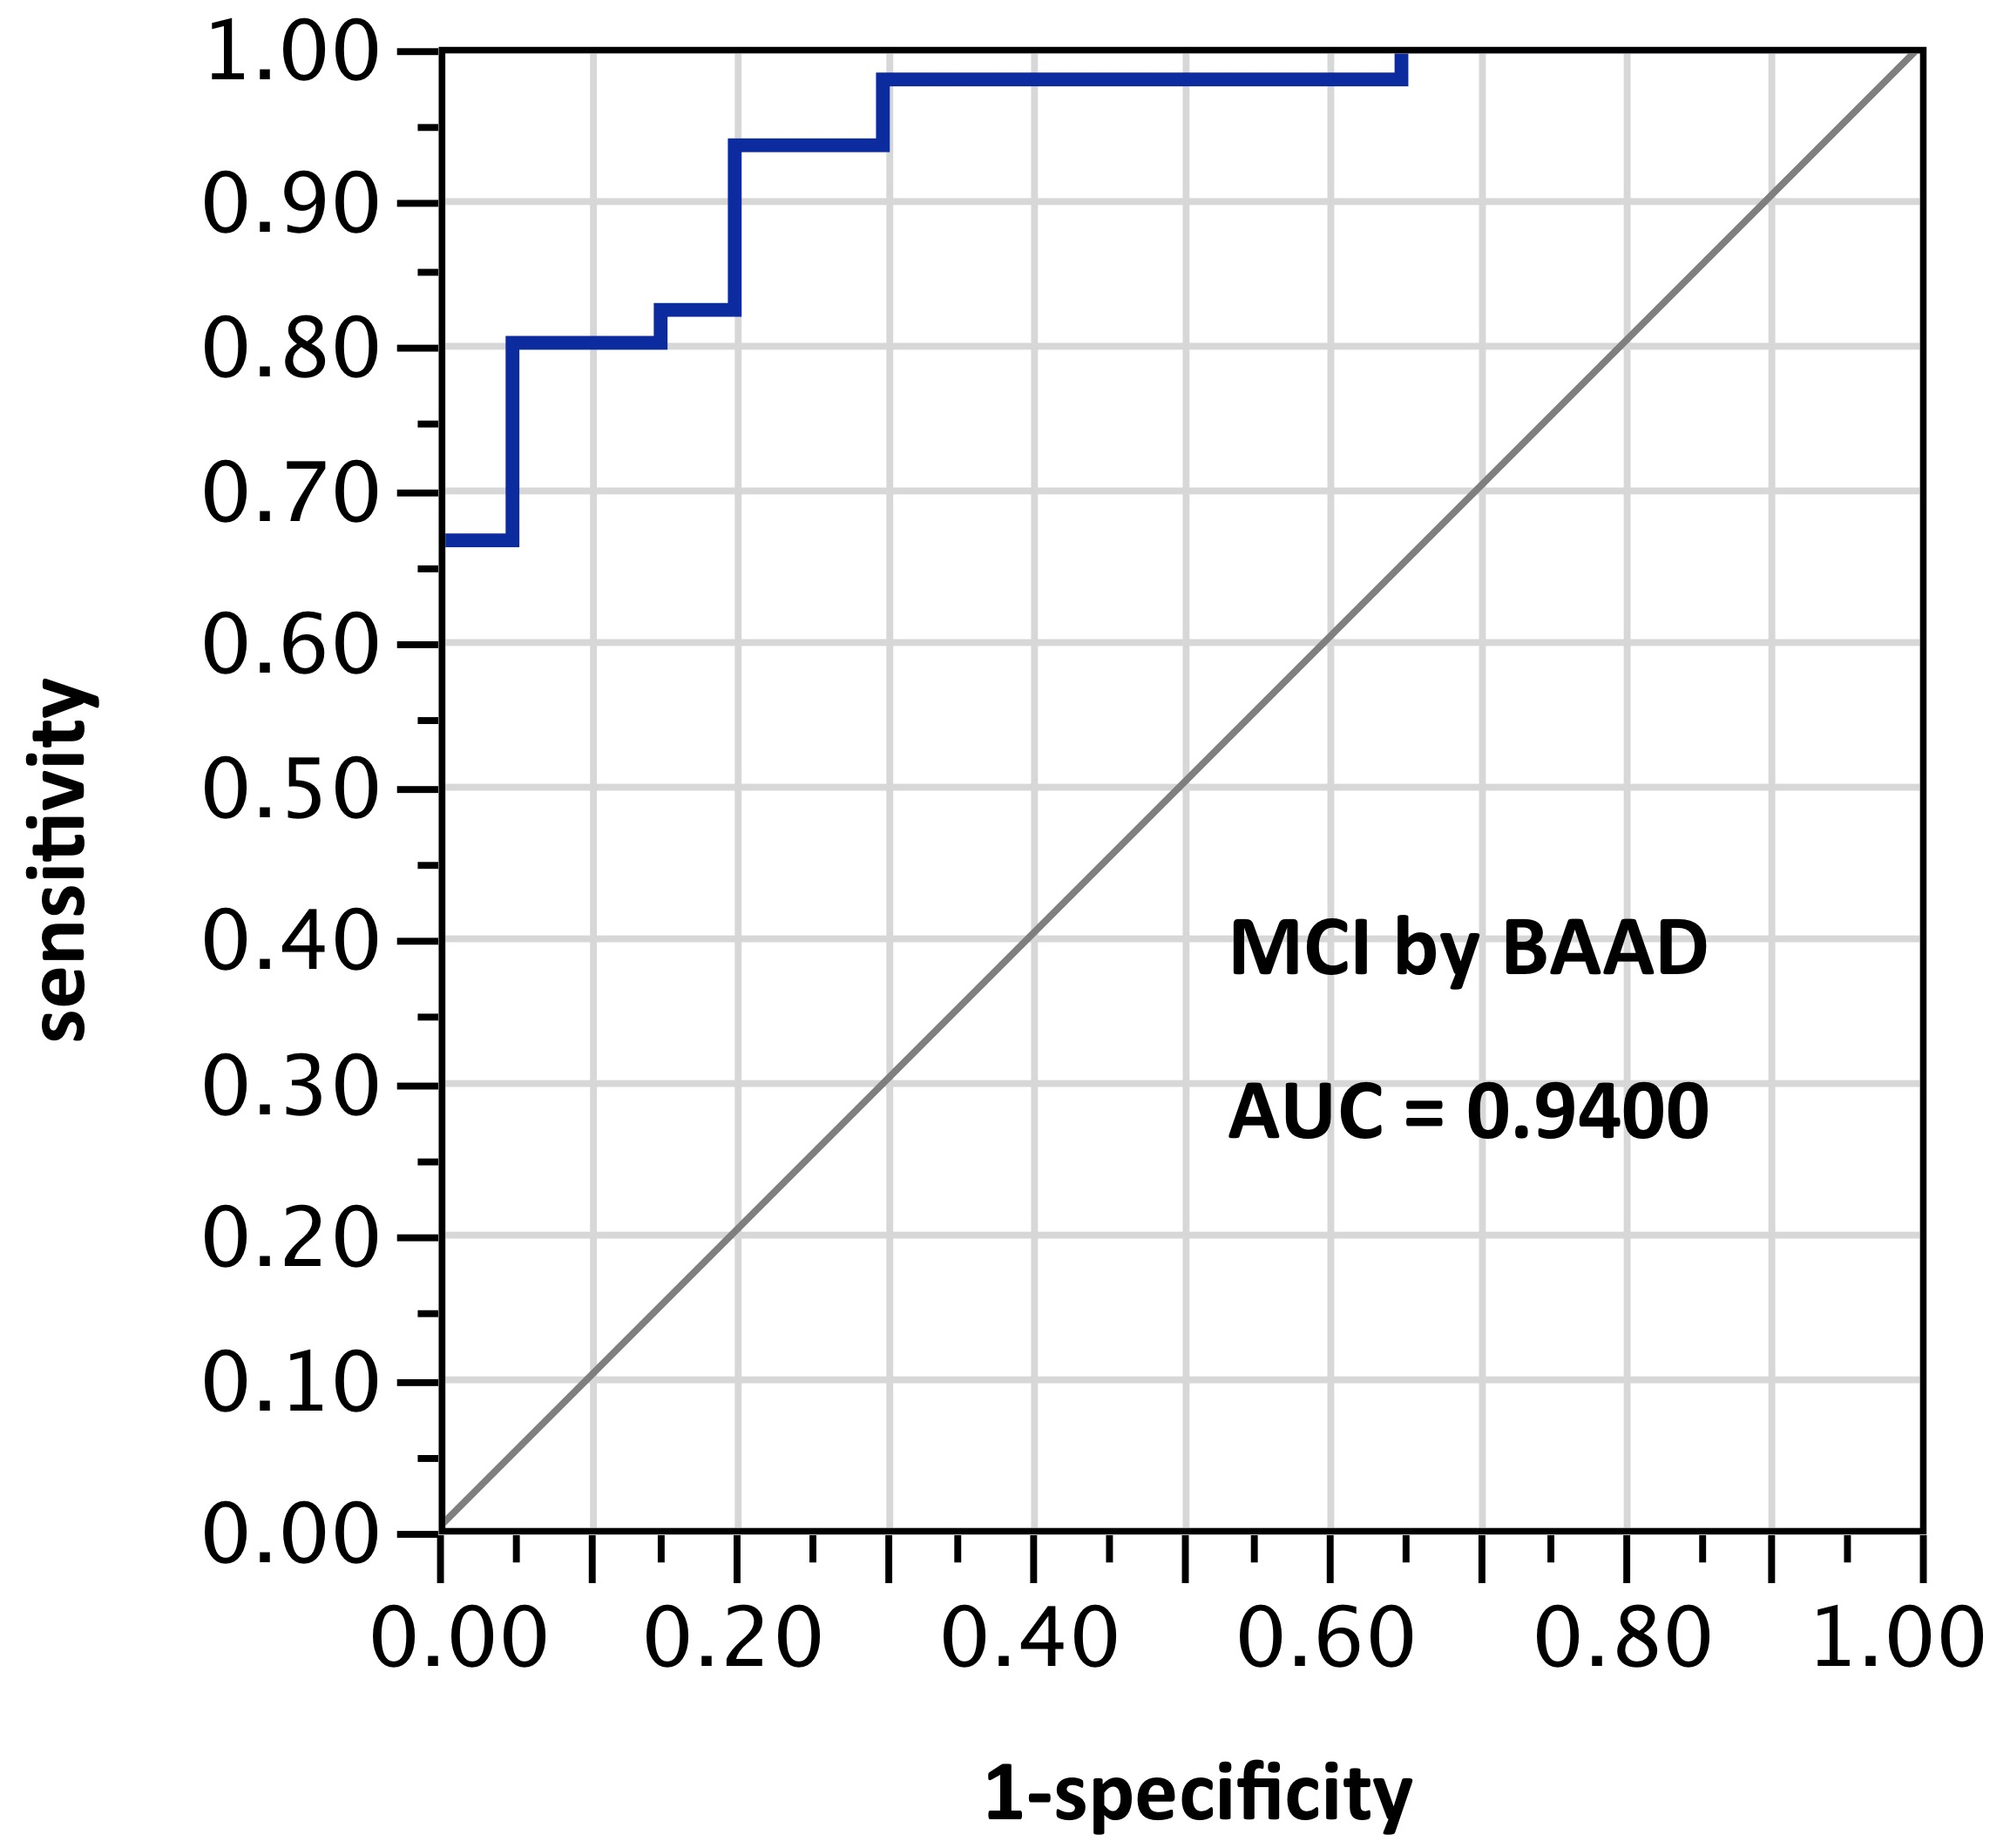
Figure 8. AUC=0.94. This too is similar to Figure 6, but using z-scores in these 8 ROIs selected post hoc and not yet validated: left anterior hippocampus, left amygdala, right inferior triangular frontal, right middle frontal, left inferior parietal, left superior parietal, left superior temporal pole, right thalamus
Although VSRAD allows improved AUC results if one uses an expanded bilateral twin ROI, it lacks the versatility of a truly multi-ROI package both in use and in data-processing. This does not mean that its z-scores are not reliable in certain contexts; when Matsuda et al. greatly enlarged their VSRAD ROI across the medial temporal structures, their numerical results were of the same order as the better BAAD results reported here (see Supplemental Material below) [10].
Although a simple-shaped region can be described more or less adequately by its MNI coordinates and radial size, a standard atlas is far more useful for general purposes, and such a selection as that in Figure 6 would probably only be derived from a range of atlas-based z-scores such as those automatically produced by BAAD. A map of places with the greatest z-scores could equally be produced in VSRAD, but only one ROI would have a numerical score attached, and no standard brain regions would be defined. There is no obvious reason for the unilaterality of so many ROIs giving this good result, and pending validation with further samples, we have to wonder whether this or anything like it will be as successful as it seems, and whether other non-obvious selections might do better for other populations. In particular, we know of no reason to be confident that this particular set would be optimal for still earlier stages, and this would be a commendable prospective study project: if sufficient numbers of asymptomatic and early-MCI people can be imaged over a period of years, the optimal multi-ROI selections for very early warning may be deduced (perhaps with machine-learning). With the complete atlas-linked z-score data, finding patterns becomes a matter of statistical mathematics facilitated by the standardized brain regions. Despite a range of relevant studies, we believe that still not enough is known about z-score distributions in AD, nor in other pathologies in diverse populations, but the standardized BAAD range of data output seems to provide good research material for finding out. With long-term multi-center multi-ROI studies, it may be possible to devise reliable SPM-based screening tests for AD and other pathologies even when the abnormal protein deposition is just beginning.
We suspect that it may be feasible to use spreadsheets of z-scores of atlas-based regions to deduce well-fitting profiles of atrophy distributions for other conditions too. It may further be feasible to compile contrasting templates to distinguish components in mixed pathologies.
Twin ROIs may seem enough. In neuroimaging, the signal-to-noise ratio (a.k.a. source-to-noise ratio) can be maximized by measuring only the regions(s) showing the earliest/greatest change (the “signal” in sMRI being atrophy) for the pathology in question, while excluding other parts, and this is the VSRAD approach. In typical AD-type pathology the earliest atrophic changes measurable by sMRI are widely said to begin in the medial temporal region in the following sequence: (1) the entorhinal cortex, (2) hippocampus, (3) then amygdala, parahippocampus, and neocortex [2-4]. The first two of these regions seem obvious targets for morphometry or volumetry, and the hippocampus has been found easier to measure than the entorhinal cortex. Also, morphometrically detectable hippocampus damage corresponds with the most obvious feature of AD, which is loss of the ability to form memories [11-13].
The literature contains many commendations for the hippocampus as a biomarker; it is among the first regions to show damage in AD, both in terms of morphometrically detectable hippocampus damage [13,14] and in terms of accumulating amyloid plaques and neurofibrillary tangles very early in AD pathology [15,16]. Morphometrically detectable hippocampus atrophy has repeatedly been found predictive of cognitive decline or dementia [12]. Reportedly it may be detectable in the amnestic mild cognitive impairment (aMCI) stage, and even before symptoms are noticed, perhaps 10 years before dementia is usually diagnosed [17,18]. In later stages it correlates roughly with the severity of cognitive loss [19] and strongly with Braak and Braak stages of AD [20] As a biomarker for AD it has been commended variously, as “the best-established”, [21] “the most established... to date”, [22] and “one of the best…” [13].
VSRAD was developed to measure structural abnormality relative to a Japanese control-group (the “able-bodied person database” or ABPDB) in that relatively small, empirically-selected bilateral ROI in the hippocampus/entorhinal vicinity [5]. The obvious advantage of VSRAD’s small bilateral ROI is speed: one patient’s MRI data can be processed through VSRAD in a quarter of an hour or less, including input time, on a standard desktop PC running Windows 8. A disadvantage is that batch processing is not possible. Another is that VSRAD, in its current iteration, does not allow substitution of control groups alternative to the ABPDB. Also, as far as we know, no version is yet available in languages other than Japanese.
There may be some tendency for clinicians to think of dementia primarily in terms of AD, which is not wholly wrong if AD is present in very approximately two-thirds of dementia cases (actual figures varying greatly with the population). At the same time, one should remember that very approximately two-thirds of dementia patients suffer some other pathology, with or without AD. Bearing that in mind, the medial temporal region may not be the only location in which quantitive assessment might prove informative. There are other reasons too, not to trust hippocampus morphometry unreservedly.
Firstly, the hippocampus may not be where AD-related atrophy really starts; the sequence seems to be dorsal raphe before entorhinal cortex, then hippocampus, then amygdala, parahippocampus, and neocortex [2-4,15,23], and it may be that the posterior cingulate, and precuneus regions show atrophy very early too [24].
Secondly, hippocampus atrophy is non-specific. Each pathology might be expected to produce a more-or-less characteristic pattern of damage to be seen by structural neuroimaging, but these may overlap significantly in terms of tissues affected, so that atrophy of any part – such as the hippocampus – may be difficult to diagnose on its own. Hippocampus atrophy may be caused by various other pathologies, perhaps in addition to AD, including the following:
Argyrophylic grain disease (AGD), for example, is virtually impossible to distinguish from AD except in post-mortem histology, where it has been reported in 1-5% of AD patients [25]. Like AD, AGD damages the entorhinal cortex, hippocampus, and amygdala.
Frontotemporal dementia (FTD) is yet another cause of hippocampal region atrophy, and another example of the need to take other brain regions into account, to put the medial temporal region z-scores into perspective. Atrophy in the frontal and parietal regions may mean FTD [26,27].
Hippocampal sclerosis (HCScl) and AD have different aetiologies and rates of onset, [27,28] but are so similar in the distribution of atrophy which they cause in the entorhinal cortex, hippocampus, and amygdala, [29] and even in the hippocampus subfields —the CA1 and the subiculum [30] — and hence are so similar in effects, that 75% of HCScl cases are misdiagnosed as AD even at final diagnosis [29]. HCScl is not as rare as might be thought; it was the most common non-amyloid cause of suspected AD in an autopsy series, [31] and it has been found at autopsy in 5-30% of nonagenarians, [27] though as a single pathology at autopsy it has been reported in only 0.4% [30]. Because HCScl causes damage faster than expected from AD, it might be suspected in context of medial temporal changes disproportionate to those in other brain regions. In other words, for morphometric purposes there is little point in evaluating only the medial temporal regions and subregions, unless further regions are also evaluated to provide context.
Semantic dementia (SD, a variety of FTLD) is another disease very closely resembling AD; AD and SD cause early and equal atrophy not just in the hippocampus, but also in the CA1 subfield, [18] rendering the CA1 per se as nonspecific for diagnosis as is the hippocampus in total. Again, some wider perspective is needed, such as a finding of atrophy in the speech areas, to distinguish early SD from early AD [18,27].
Vascular dementia (VD), perhaps the second-most-common cause of dementia, [32] and other cerebrovascular pathologies can cause hippocampus atrophy too [27].
The entorhinal cortex and hippocampus are not alone for long in AD. AD-type pathological changes are thought to begin many years before symptoms, and for the large majority of patients, testing begins only after symptoms start, by which stage other regions are also affected. For example, Scahill noted that the inferolateral temporal and medial parietal regions are already likely to be showing significantly increased rates of atrophy when symptoms of AD-type pathology are noticed [17].
The ROC results in this paper show dramatic differences achieved by the inclusion of ROIs outside the entorhinal cortex and hippocampus— i.e., outside the default ROIs of VSRAD, and it is worth emphasising that the test cases chosen from ADNI were all MCI cases, and thus less atrophic and less easy to distinguish by sMRI than full AD cases would be. Even if one could somehow rule out all pathologies except the most common variety of AD, one still could not justify limiting sMRI to only the entorhinal cortex and hippocampus.
Some AD cases do not cause hippocampus atrophy; [33] some variation in incidence figures is to be expected, and Bobinski et al. reported only that “more than 90%” of AD cases show hippocampus shrinkage [34]. Hippocampus sparing AD (hsAD) confounds established twin-ROI interpretation. Murray et al. reported that 11% of all AD cases were hsAD, and of those 11% more than half were misdiagnosed as something other than AD [28]. The 3 types are distinguished by their distributions of excessive neurofibrillary tangles: frontal, parietal, and temporal. These cases tend to be misdiagnosed as frontotemporal dementia, corticobasal syndrome, and primary progressive aphasia respectively [28].
2021 Copyright OAT. All rights reserv
Other ROIs have been used in other studies; as the following 6 sources illustrate, various ROIs beyond the usual entorhinal/hippocampal vicinity have been found relevant to AD-type atrophy: Arimura et al. used cerebrospinal fluid (CSF) volume, cerebral cortical thickness, gray matter volume, and white matter volume [35]. Kidron et al. measured ventricular CSF volumes and temporal gray matter volumes [36]. Macdonald et al. measured the temporal horn and hippocampus [37].
Doré et al. measured cortical thickness in the posterior cingulate, precuneus and hippocampus [38]. Whitwell et al. noted involvement of the fusiform gyrus, the medial parietal lobe, and the middle and posterior temporal lobe [39].
Kilimane et al. found significant volume reductions of all parts of the basal forebrain cholinergic system (BFCS), which were most marked in the posterior nucleus basalis Meynert (NbM). They reported: “Diagnostic accuracy of posterior NbM volume was superior to hippocampus volume... despite higher multicenter variability of the BFCS measurements.”[40].
BAAD in a real sense covers all those regions automatically; its combination of SPM, WFU_Pickatlas, MarsBAR, and xjView allows any desired selection of one or more anatomical brain regions, whether grey or white matter or CSF, unilateral or bilateral, plus measurements of intracranial volume and of CSF. Routinely, the MarsBaR stage yields a z-score for each of the 98 regions delineated or “masked” by PickAtlas; these are the standard 90 Montreal Neurological Institute (MNI) regions, plus 4 extra regions bilaterally: the anterior and posterior hippocampus and the BA28 and BA34 regions covering the entorhinal cortex, which extra regions were added to improve definition.
Causes of dementia may be classified in various ways, such as (a) reversible, (b) fixed, and (c) progressive, and in considering the possibilities it is well to remember at least two key facts.
Firstly, the earlier the diagnosis, the better, and for good reasons. Some etiologies are at least partially reversible (e.g., metabolic disturbances, anti-AD drug overdose, hormone anomaly, vitamin deficiency, or normal pressure hydrocephalus); and against AD several drug treatments have already shown promise in counteracting functional changes in the brain and delaying the onset of symptoms, while other treatments are under research and development, but in every case, the sooner the pathology (whether typical or atypical) is identified, the better, not only for treatment but also for timely study and for preparations for the future.
Secondly, no neurodegenerative disease is known to protect against any others; patients may suffer multiple, coexisting pathologies (or comorbidities), no two of which need be expected to begin at the same time, nor to progress at the same rate. The progressive or degenerative causes (some of which are described above as causing hippocampus atrophy) include the degenerative neuropathies or “brain destroying diseases” including: Alzheimer’s disease (AD), including 3 varieties of hippocampal-sparing AD (hsAD), argyrophylic grain disease (AGD), AIDS related dementia, alcohol-dementia, dementia with Lewy bodies, frontotemporal lobar degeneration (FTLD) including frontotemporal dementia (FTD), progressive nonfluent aphasia, and semantic dementia (SD), hippocampal sclerosis (HCScl), Creutzfeld-Jakob disease (CJD) and the transmissible new variant CJD (nvCJD), Korsakoff’s psychosis, Lewy body dementia, Parkinson’s-associated dementia, primary progressive aphasia, progressive supranuclear palsy, subacute sclerosing panencephalitis, vascular dementia, and Wernicke’s encephalopathy.
Absolute and relative incidence rates of pathologies vary with time and with populations, but none is so rare as to be unimportant to the patients who suffer it and to their carers and families. While AD is commonly described as the commonest cause of dementia, reported rates of AD vary so widely that in some populations vascular dementia (VaD) has been found more common than AD [41,42].
Figures for rates of multiple-cause dementias also vary, and while most reports put mixed states below the rate of pure AD, at least one source suggests that mixed states “are probably more usual than pure dementia syndromes” [42].
Much research is still needed on interactions of morbidities, but there have been suggestions that some, such as AD and VaD, may interact synergistically, and some may give entirely false indications if only a narrow biomarker range is used. For example, even precise monitoring of the entorhinal and hippocampus regions might be too narrow if a patient suffers hsAD plus VaD, or AD plus SD.
Our results indicated that the multi-ROI approach exemplified by BAAD offers greater versatility in assessment and diagnosis than the twin-ROI approach represented by the originally single-purpose VSRAD, as well as facilitating information exchange between study centers, thanks to BAAD’s atlas components.
One obvious limitation of this comparison between results obtained through BAAD and VSRAD was the mis-match between the groups: the ABP database in VSRAD, the IXI set in BAAD, and the population which gave rise to the ADNI database. This illustrates a fundamental requirement in SPM: Control groups from which templates are derived are crucial. BAAD allows substitution of any control database, allowing BAAD to be used anywhere, but presumably the software of VSRAD can be updated to allow similar adaptability, so this is not an inherent limitation in the approach. Another possible limitation was the use of PiB-PET amyloid-imaging; PiB-PET is usually accepted as indicative of AD, but there is still some lack of clarity about the roles of amyloid and tau, particularly regarding atrophy in the medial temporal regions, which may be afflicted with tau changes before amyloid plaques. If tau-imaging data had also been available, they would have been used.
Even allowing for the limitations of this study, multi-ROI combinations showed better discrimination than did twin-ROI between the amyloid-positive and amyloid-negative MCI cases. Certain ROIs can contribute significantly more than others to accurate discrimination between etiologies. Although the “cherry-picked” post hoc selections demonstrated in this paper should not be considered reliable until validated with further cases, their excellent initial scores seem to indicate considerable potential in multi-ROI combinations for this MCI context. Validation and further testing may also prove worthwhile if reliable databases can be developed for ROI combinations, in BAAD or any other multi-ROI system, to account for other populations, other pathologies than typical AD, and mixed pathologies.
: Dr. Akihiko Shiino, who performed the calculations for this report, is also a member of the BAAD development team; however, the ADNI data and BAAD software are available in the public domain. No other conflicts of interest, financial or otherwise, are declared.
Our results showed that selectively increasing the number of ROIs in BAAD increased the accuracy of discrimination between PiB negative and positive cases. Matsuda et al. achieved a similar effect in VSRAD by expanding their VOI to include “medial temporal structures involving the entire region of the entorhinal cortex, hippocampus, and amygdala”, and reported accuracy of 91.6%, with specificity of 97.5% and sensitivity of 86.4% for cases of very mild AD [10]. Those figures were obtained with a Japanese population database appropriate to the Japanese patients, and so may be comparable to BAAD used with the ADNI cases, though since very mild AD should show more atrophy than MCI, better scores would be expected in this case.
An important distinction in this context is that expanding a twin ROI is equivalent to combining multiple standard MNI brain regions only when those regions are contiguous or very nearly so.
VSRAD is widely used in Japan for diagnosis and research, having undergone continuing development since its introduction in 2005. VSRAD has been focused on various regions, as follows:
- 1) The entorhinal cortex [43-45]
- 2) The medial temporal regions (including the entorhinal cortex) [9,46]
- 3) The hippocampus region. [9,47-49]
- 4) The amygdala + parahippocampus [50]
- 5) The parahippocampus [51,52]
6) White Matter: [53] As in other brain regions, white matter damage is difficult to link specifically to any one cause, and white matter may show damage from three relatively common dementia-causing pathologies: AD, DLB, and VaD [54]. Nakatsuka et al. used VSRAD to identify DLB-specific white matter atrophy, [55] showing that although VSRAD was named for its target pathology of AD, it can be applied anywhere, and for pathologies other than AD. So too, of course can BAAD.
- Kakeda S, Korogi Y (2010) The efficacy of a voxel-based morphometry on the analysis of imaging in schizophrenia, temporal lobe epilepsy, and Alzheimer's disease/mild cognitive impairment: a review. Neuroradiology 52: 711-721. [Crossref]
- Apostolova LG, Dutton RA, Dinov ID, Hayashi KM, Toga AW, et al. (2006) Conversion of mild cognitive impairment to Alzheimer disease predicted by hippocampal atrophy maps. Arch Neurol 63: 693-699. [Crossref]
- Johnson KA, Fox NC, Sperling RA, Klunk WE (2012) Brain imaging in Alzheimer disease. Cold Spring Harb Perspect Med 2: a006213. [Crossref]
- Lehéricy S, Baulac M, Chiras J, Piérot L, Martin N, et al. (1994) Amygdalohippocampal MR volume measurements in the early stages of Alzheimer disease. AJNR Am J Neuroradiol 15: 929-937. [Crossref]
- Goto M, Aoki S, Abe O, Masumoto T, Watanabe Y, et al. (2006) Utility of Axial Images in an Early Alzheimer Disease Diagnosis Support System (VSRAD). Nihon Hoshasen Gijutsu Gakkai Zasshi 62: 1339–1344. [Crossref]
- Ashburner JT (2009) Computational anatomy with the SPM software. Magnetic Resonance Imaging 27: 1163–1174
- Ashburner JT (2010) VBM tutorial. Tech rep. Wellcome Trust Centre for Neuroimaging.
- Waragai M, Hata S, Suzuki T, Ishii R, Fujii C, et al., (2014) Utility of SPM8 plus DARTEL (VSRAD) combined with magnetic resonance spectroscopy as adjunct techniques for screening and predicting dementia due to Alzheimer's disease in clinical practice. J Alzheimers Dis 41: 1207–1222. [Crossref]
- Hirata Y, Matsuda H, Nemoto K, Ohnishi T, Hirao K, et al. (2005) Voxel-based morphometry to discriminate early Alzheimer's disease from controls. Neurosci Lett 382: 269-274. [Crossref]
- Matsuda H, Mizumura S, Nemoto K, Yamashita F, Imabayashi E, et al. (2012) Automatic voxel-based morphometry of structural MRI by SPM8 plus diffeomorphic anatomic registration through exponentiated lie algebra improves the diagnosis of probable Alzheimer Disease. American Journal of Neuroradiology 33: 1109–1114. [Crossref]
- Arlt S, Buchert R, Spies L, Eichenlaub M, Lehmbeck JT, et al. (2012) Association between fully automated MRI-based volumetry of different brain regions and neuropsychological test performance in patients with amnestic mild cognitive impairment and Alzheimer’s disease. Eur Arch Psychiatry Clin Neurosci 263: 335–344. [Crossref]
- den Heijer T, van der Lijn F, Koudstaal PJ, Hofman A, van der Lugt A, et al. (2010) A 10-year follow-up of hippocampal volume on magnetic resonance imaging in early dementia and cognitive decline. Brain 133: 1163-1172. [Crossref]
- Maruszak A, Thuret S (2014) Why looking at the whole hippocampus is not enough--a critical role for anteroposterior axis, subfield and activation analyses to enhance predictive value of hippocampal changes for Alzheimer's disease diagnosis. Front Cell Neurosci 8: 1–11. [Crossref]
- Miller MI, Priebe CE, Qiu A, Fischl B, Kolasny A, et al. (2009) Collaborative computational anatomy: An MRI morphometry study of the human brain via diffeomorphic metric mapping. Hum Brain Map 30: 2132–2141.
- Braak H, Braak E (1995) Staging of Alzheimer's disease-related neurofibrillary changes. Neurobiol Aging 16: 271-278. [Crossref]
- Gerardin E et al. (2009) Multidimensional classification of hippocampal shape features discriminates Alzheimer's disease and mild cognitive impairment from normal aging. NeuroImage 47: 1476–1486.
- Scahill RI, Schott JM, Stevens JM, Rossor MN, Fox NC (2002) Mapping the evolution of regional atrophy in Alzheimer's disease: unbiased analysis of fluid-registered serial MRI. Proc Natl Acad Sci U S A 99: 4703-4707. [Crossref]
- La Joie R, Perrotin A, de La Sayette V, Egret S, Doeuvre L, et al. (2013) Hippocampal subfield volumetry in mild cognitive impairment, Alzheimer's disease and semantic dementia. Neuroimage Clin 3: 155-162. [Crossref]
- Apostolova LG, Dinov ID, Dutton RA, Hayashi KM, Toga AW, et al. (2006) 3D comparison of hippocampal atrophy in amnestic mild cognitive impairment and Alzheimer's disease. Brain 129: 2867-2873. [Crossref]
- Apostolova LG, Morra JH, Green AE, Hwang KS, Avedissian C, et al. (2010) Automated 3D mapping of baseline and 12-month associations between three verbal memory measures and hippocampal atrophy in 490 ADNI subjects. NeuroImage 51: 488–499. [Crossref]
- Teipel SJ, Grothe M, Lista S, Toschi N, Garaci FG, et al. (2013) Relevance of magnetic resonance imaging for early detection and diagnosis of Alzheimer disease. Med Clin North Am 97: 399-424. [Crossref]
- Apostolova LG, et al. (2014) Pathologic Validation of the EADC-ADNI Harmonized Hippocampal Protocol (P6.331).
- Grinberg LT, Rüb U, Ferretti RE, Nitrini R, Farfel JM, et al. (2009) The dorsal raphe nucleus shows phospho-tau neurofibrillary changes before the transentorhinal region in Alzheimer's disease. A precocious onset? Neuropathol Appl Neurobiol 35: 406–416. [Crossref]
- Grinberg LT, Rueb U, Heinsen H (2011) Brainstem: neglected locus in neurodegenerative diseases. Front Neurol 2: 42. [Crossref]
- Delacourte A, Jellinger KA (2009) Argyrophilic Grain Disease (AGD).
- Ashburner J, Csernansky JG, Davatzikos C, Fox NC, Frisoni GB, et al. (2003) Computer-assisted imaging to assess brain structure in healthy and diseased brains. Lancet Neurol 2: 79-88. [Crossref]
- Nelson PT, Smith CD, Abner EL, Wilfred BJ, Wang WX, et al. (2013) Hippocampal sclerosis of aging, a prevalent and high-morbidity brain disease. Acta Neuropathol 126: 161-177. [Crossref]
- Murray ME, et al. (2014) Focal Cortical Patterns in Hippocampal Sparing AD Reveal Significant Clinical Differences (S48.001).
- Onyike CU, Pletnikova O, Sloane KL, Sullivan C, Troncoso JC, et al. (2013) Hippocampal sclerosis dementia: An amnesic variant of frontotemporal degeneration. Dement Neuropsychol 7: 83-87. [Crossref]
- Ala TA, Beh GO, Frey WH 2nd (2000) Pure hippocampal sclerosis: a rare cause of dementia mimicking Alzheimer's disease. Neurology 54: 843-848. [Crossref]
- Rasmusson DX, Brandt J, Steele C, Hedreen JC, Troncoso JC, et al. (1996) Accuracy of clinical diagnosis of Alzheimer disease and clinical features of patients with non-Alzheimer disease neuropathology. Alzheimer Dis Assoc Disord 10: 180-188. [Crossref]
- Chan D, Fox NC, Scahill RI, Crum WR, Whitwell JL, et al. (2001) Patterns of temporal lobe atrophy in semantic dementia and Alzheimer's disease. Ann Neurol 49: 433-442. [Crossref]
- Lim A, Jung WS, Ahn KJ, Won WY, Hahn C, Lee SY, et al. (2012) Relationships between hippocampal shape and cognitive performances in drug-naïve patients with Alzheimer's disease. Neuroscience lett 516: 124–129. [Crossref]
- Bobinski M, de Leon MJ, Wegiel J, Desanti S, Convit A, Saint Louis LA, et al. (2000) The histological validation of post mortem magnetic resonance imaging-determined hippocampal volume in Alzheimer's disease. Neuroscience 95: 721–725. [Crossref]
- Arimura H, Yoshiura T, Kumazawa S, Tanaka K, Koga H, et al. (2008) Automated method for identification of patients with Alzheimer's disease based on three-dimensional MR images. Acad Radiol 15: 274-284. [Crossref]
- Kidron D, Black SE, Stanchev P, Buck B, Szalai JP, et al. (1997) Quantitative MR volumetry in Alzheimer's disease. Topographic markers and the effects of sex and education. Neurology 49: 1504-1512. [Crossref]
- Macdonald KE, Bartlett JW, Leung KK, Ourselin S, Barnes J; ADNI investigators (2013) The value of hippocampal and temporal horn volumes and rates of change in predicting future conversion to AD. Alzheimer Dis Assoc Disord 27: 168-173. [Crossref]
- Doré V, et al. (2013) Cross-sectional and longitudinal analysis of the relationship between Aß deposition, cortical thickness, and memory in cognitively unimpaired individuals and in Alzheimer disease 70: 903–911.
- Whitwell JL, Przybelski SA, Weigand SD, Knopman DS, Boeve BF, et al. (2007) 3D maps from multiple MRI illustrate changing atrophy patterns as subjects progress from mild cognitive impairment to Alzheimer's disease. Brain 130: 1777-1786. [Crossref]
- Kilimann I, Grothe M, Heinsen H, Alho EJ, Grinberg L, et al. (2014) Subregional basal forebrain atrophy in Alzheimer's disease: a multicenter study. J Alzheimers Dis 40: 687-700. [Crossref]
- Massoud F, Devi G, Stern Y, Lawton A, Goldman JE, et al. (1999) A clinicopathological comparison of community-based and clinic-based cohorts of patients with dementia. Arch Neurol 56: 1368-1373. [Crossref]
- Ritchie K, Lovestone S (2002) The dementias. Lancet 360: 1759-1766. [Crossref]
- Hayashi H, Kawakatsu S, Suzuki A, Shibuya Y, Kobayashi R, et al. (2012) Application of the VSRAD, a specific and sensitive voxel-based morphometry, to comparison of entorhinal cortex atrophy between dementia with Lewy bodies and Alzheimer's disease. Dementia and geriatric cognitive disorders 34: 328–331. [Crossref]
- Kume K, Hanyu H, Sato T, Hirao K, Kanetaka H, et al. (2010) Prediction of the development of Alzheimer disease in patients with mild cognitive impairment. Nihon Ronen Igakkai Zasshi 47: 147-152. [Crossref]
- Li X, Shimizu S, Jibiki I, Watanabe K, Kubota T (2010) Correlations between Z-scores of VSRAD and regional cerebral blood flow of SPECT in patients with Alzheimer's disease and mild cognitive impairment. Psychiatry Clin Neurosci 64: 284–292. [Crossref]
- Makizako H, Shimada H, Doi T, Yoshida D, Ito K, et al. (2011) The Association Between Decline in Physical Functioning and Atrophy of Medial Temporal Areas in Community-Dwelling Older Adults With Amnestic and Nonamnestic Mild Cognitive Impairment. Arch Phys Med Rehabil 92: 1992–1999. [Crossref]
- Anan F, Masaki T, Shimomura T, Fujiki M, Umeno Y, et al. (2010) Abdominal visceral fat accumulation is associated with hippocampus volume in non-dementia patients with type 2 diabetes mellitus. NeuroImage 49: 57–62. [Crossref]
- Kamiyama K, Wada A, Sugihara M, Kurioka S, Hayashi K, et al. (2010) Potential hippocampal region atrophy in diabetes mellitus type 2: a voxel-based morphometry VSRAD study. Jpn J Radiol 28: 266-272. [Crossref]
- Shimomura T, Anan F, Masaki T, Umeno Y, Eshima N, et al., (2011) Homocysteine levels are associated with hippocampus volume in type 2 diabetic patients. Eur J Clin Invest 41: 751–758. [Crossref]
- Matsuda H (2007) The role of neuroimaging in mild cognitive impairment. Neuropathology 27: 570-577. [Crossref]
- Koumi H (2013) Basic study on relation between cognitive function and parahippocampal-gyrus atrophy in Patients with Alzheimer’s disease: applying neuropsychological assessment containing Wechsler memory scale-revised (WMS-R), and the voxel-based specific regional analysis system for Alzheimer”s disease (VSRAD). 21: 85–95.
- Suzuki Y, Oishi M, Ogawa K, Mizutani T (2010) Atrophy of the parahippocampal gyrus and regional cerebral blood flow in the limbic system in chronic alcoholic patients. Alcohol 44: 7–7. [Crossref]
- Sakakibara M. White matter lesions versus Alzheimer’s disease: which is more significant burden on OAB and incontinence in the elderly dementia?
- Barber R, Scheltens P, Gholkar A, Ballard C, McKeith I, et al. (1999) White matter lesions on magnetic resonance imaging in dementia with Lewy bodies, Alzheimer's disease, vascular dementia, and normal aging. J Neurol Neurosurg Psychiatry 67: 66–72. [Crossref]
- Nakatsuka T, Imabayashi E, Matsuda H, Sakakibara R, Inaoka T, et al., (2013) Discrimination of dementia with Lewy bodies from Alzheimer's disease using voxel-based morphometry of white matter by statistical parametric mapping 8 plus diffeomorphic anatomic registration through exponentiated Lie algebra. Neuroradiology 55: 559–566. [Crossref]