It has been known that sample dimension and lattice defects affect critical behavior of superconductivity. Particular type of porous samples called fractal bodies have well-defined non-integer dimensions dependent exclusively on the geometrical feature of structures. Differences in sample dimension and lattice defects are quantitatively described by such fractal dimensions (Ds). Powder samples of high-TC cuprates with 2.5 £ D £ 3 were prepared, and their superconducting properties were compared as regards critical temperature TC, critical current JC, and critical magnetic field HC. While the variation in HC for different Ds was within experimental error (for the lower HC) or too high to be measured (for the upper HC), TC and JC correlated with D: they both exhibited complex patterns of D-dependence immediately below D = 3 and maximum enhancement of ∽0.7% in TC and ∽7% in JC were observed. The observed behavior is semi-quantitatively explained by considering fractal structures of the samples. In addition, the D-dependences of TC and JC are explained with the same quantitative discussion as those of Néel temperatures of fractal CoO powder samples. This suggests underlying universal physics for cooperative phenomena in fractal dimensions.
High-TC cuprate, magnetization curve, sponge structures, superconducting characteristics, critical phenomena
Introduction
YBa2Cu3O7-d (YBCO) and its related copper oxides have been the centre of interest in the research field of superconductivity, mainly because of their exceptionally high critical temperatures (TCs) [1,2]. During the hundred years since the discovery of superconductivity, the highest TC has increased by ~150 K, which is found in HgBa2Ca2Cu3Oy [3-7]. Besides TC, the superconducting characteristics include critical magnetic fields HC and critical current densities JC. They are also important properties in both terms of basic and applied research. There are extensive studies to enhance HC and JC. It is well known that these characteristics vary depending not only on the chemical formulae and the crystal structures, but also on the sample forms such as thin films and fibres. Similarly lattice defects also affect these superconducting properties. Generally speaking, samples with low-dimensional forms and with many defects often exhibit evidently low TC, HC, and JC. Such a trend has been empirically known, yet there are few systematic or quantitative experimental studies on the relation between the dimensionalities of samples and the superconducting properties, though there are extensive theoretical studies using fractal dimensions (Ds) [8-15]. The effects of defects on the superconducting properties have been studied by irradiating ions or neutrons at the single crystals [16-23]. The important findings include enhancement of TC or JC after introduction of controlled defects by the particle-irradiation. The YBCO sponges are synthesized by use of a sol-gel method with appropriate additives/dopants, and the sponges exhibit improved JCs [24]. Although the authors do not refer to the fractal dimensions of the sponges, they apparently form fractal bodies judging from the SEM/TEM images (Figures1b-1d [24]). In the meantime, the XRD patterns clearly indicate that the sponges contain impurities such as BaCuO2 and Y2BaCuO5, the net effects on JC of the sample form (sponge) and impurities cannot be distinguished.
Alternatively, defects can be introduced simply by mixing the powder samples with alkylketene dimer (AKD), and the amount and distribution of defects can be quantitatively estimated by fractal dimensions of the mixed powder samples [25-27]. This method cannot produce geometrically controlled defects such as columnar defects in single crystals, yet it is a facile and reproducible way to produce isotropic defects in a powder sample with a finely controlled value of D (2.50 £ D £ 3.00). Using this method, the magnetic ordering in the cobalt oxide CoO having fractal dimensions has been recently studied [27]. The results show that the magnetic ordering temperatures, i.e. the Néel temperatures (TNs) of CoO depend on D, and rapidly enhance immediately below D = 3. The observed behaviour (TN vs. D) is explained by a simple calculation considering the interactions between magnetic sites (i.e. spins) assumed to be distributed to give a fractal dimension D. Since this model is general and appears to be appropriately applied to other cooperative phenomena, the superconducting properties TC, HC and JC are examined on the powder sample of YBCO with different Ds in this work. The detailed results and discussion are described below.
Materials
YBCO and AKD were synthesized by standard procedures described in Supporting Information. The value of d in the chemical formula of YBa2Cu3O7-d was determined to be d = 0.01-0.04 by iodometry using nine different samples with 3-time titrations each. The powder samples of YBCO with desired fractal dimensions were prepared by the same procedures applied to the CoO powder samples having fractal dimensions [27]; AKD and YBCO were mixed and well ground in the agate mortar to be homogeneous fine powder (~for an hour). Because AKD is independent of superconducting mechanism, AKD plays a role of defects, corresponding to void spaces and holes in fractal bodies. The fractal dimension D was controlled by the mixing ratio between YBCO and AKD. Details of how we estimated the fractal dimension D are described in Appendix A. Experimental errors are ±0.05 in D and << 0.1 % in AKD content. The errors in D were estimated from the arbitrariness and statistical errors (standard deviations) in the curve-fitting analysis of neutron diffraction of the mixed powder samples with AKD [25, 27]. The arbitrariness was examined by independent curve-fitting analyses with different ranges and initial parameters. Thus obtained mixed powder samples were characterized by powder X-ray diffraction (PXD; Figure S2; one sample for each D), X-ray photoelectron spectroscopy (XPS; Figure S3; five samples for each D) and scanning electron microscopy (SEM; Figure S4; seven samples for each D) in order to check any artefact originated from the sample. All these results of characterization clearly indicated that the mixing with AKD changes none of the crystal structure and d in the chemical formula of YBCO.
Physical measurements
The electrical resistivity was measured on the compaction pellets by a four-probe method. The electrical contacts were made by gold wires (25 mmf) and gold paste (Tokuriki Chemical Research Co., Ltd. No. 8560). The equipment was home-made liquid-nitrogen-cryostat consisting of a digital voltmeter (Keithley Nanovoltmeter 2182A), a current/voltage source (Keithley SourceMeter 2400), a digital temperature controller (LakeShore, Model 331), and a diffusion/rotary pumping system (DIAVAC, DS-A412N). In order to minimize the joule heating of the sample and a resultant thermoelectric power, a constant current of 0.3-2 mA was applied for 20 ms, and the voltage drop was measured in a synchronized way with the current source. Immediately (~ 20 ms) after the first measurement, the voltage was reversed and the same measurement was carried out. Then the average was taken to cancel out the thermoelectric power. The measurement was carried out on two samples having the same D to confirm sample dependences and reproducibility. The errors in the electrical resistivity measurements were estimated to be ~±0.25 for T [K] and ~ ±0.3 for r [Wcm] based on scatterings and sample dependences of the data.
The magnetic susceptibility was measured using a SQUID (Quantum Design, MPMS-XL7minBXR3). The powder sample was formed into a compaction pellet of 1-2 mm in height and 2.0 mm in diameter (~2-18 mg), and set in a gelatin capsule. The capsule was cylindrical (EM-Japan, G7330, No.4, 5.0 mm in inner diameter, 13.9 mm in height) and diamagnetic (~ -10-4 emu) and had some pinholes for ventilation. The capsule was set in the middle of a polystyrene straw (Quantum Design), and subjected to a DC measurement. Both of field cooled (FC) and zero-field cooled (ZFC) processes were examined. For the determination of TC, the magnetization were measured in an FC process from 300 to 2 K with a magnetic field H = 100 G. For HC and JC, the magnetization curves were measured from 0 to 4 T, 4 to - 4 T, and then - 4 to 0.5 T at 2 K. The measurement was carried out on five samples having the same D to confirm sample dependences and reproducibility. The errors in the magnetic susceptibility measurements are estimated to be ~±1´10-5 [T] for the applied magnetic field H, ~±0.1% for observed magnetization, and ~ ±0.25 [K] for the temperature control based on the specification of the equipment utilized and reproducibility observed.
Estimation of JC
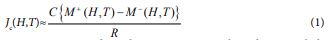
JC was estimated by following reported methods [28,29]. For a type II superconductor with a cylindrical shape (radius = R), JC can be estimated from the observed hysteresis in the magnetization curve using equation (1).
where C is a constant dependent on experimental conditions including the shape of the sample, and M+ (H,T) and M- (H,T) are observed values of magnetization in M-H curves at a given magnetic field H and temperature T in the decreasing- and increasing-field processes, respectively (M + > M - ).
For determination of TC, Figures1(a)-1(e) show the temperature dependences of magnetic susceptibility c and resistivity r, in addition to TC (midpoint) vs. D. The D-dependences of onset TC and offset TC are shown in Figure S5 in Supporting Information. Figure 2 shows the observed hysteresis curves at 2 K for the sample of 2.5 £ D £ 3. For more details, each curve is shown in Supporting Information (Figures S6(a)-S6(f)). The observed hysteresis curves well agree with those previously reported [29]. In all the samples, the lower critical fields HC1 occur at H ~ 2310 G, while upper critical fields HC2 far exceed the highest field available (7 T) in the measurements. The minimum values of magnetization, M- are plotted against the fractal dimensions D in Figure 3. The D-dependence well agrees with that of TN (observed behavior) of the fractal spin systems in CoO/AKD [27].
Figure 2. Hysteretic M-H curves at 2 K for the fractal YBCO sample of 2.5 £ D £ 3. (a) data of a whole loop of H = 0 ® 4 T ® - 4 T ® 0.5 T, and (b) Quadrant IV of the same data; note that magnetization is shown by absolute values. For clarity each curve is offset by 50 Gg-1 with its baseline (dotted line). The YBCO content (vol%) and D of each sample are designated at the top/side of the graph.
The values of JC derived from the hysteresis in Figure 2(a) using equation (1) are shown in Figure 4. All the magnetic susceptibility data measured on the five samples were utilized to extract JC, which are similar to each other, and typical results are shown in Figure 4. As is well known, JC rapidly decreases with increasing external field H [30,31]. For comparison, we shall discuss the values of JC normalized by JC at D = 3 (Figure 5). The errors in JC and JC(D)/JC(3) are approximately ±1.5% and ±2.5% of each value, respectively. They are estimated from data scatterings in Figures 4(a) and 4(b) by taking the standard deviations. With decreasing D from 3 to 2.5, JC decreases rapidly until it takes a minimum at D = 2.92. Then it makes a sudden upturn to take a maximum at D = 2.88, and then it exhibits a plateau or a subtle increase between D ~ 2.8 and D = 2.5. This behavior does not qualitatively depend on H, and well corresponds to a reverse behavior of that in Figure 3 [i.e., (4pM)-1 vs. D] as well as with our previous observation of TN vs. D in the fractal spin system in CoO [27].
Figure 4. JC derived from the hysteresis in Fig. 2(a) using equation (1). (a) Raw data, and (b) data normalized by < em>JC with D = 3.00. The YBCO content (vol%) and D of each sample are designated at the top of the graph.
Superconducting characteristics of fractal YBCO
The sintered compacts of YBCO were confirmed to be an orthorhombic phase of YBa2Cu3O7-d with d = 0.02±0.02 by X-ray powder patterns and iodometry, respectively. After mixing with AKD, XPS and PXD proved that YBCO retained its original crystal and electronic structures irrespective of D. The observed differences in HC1 among the samples with different Ds are within experimental error (Figures 2 and S6). The values of HC2 are too high to be measured. Thus we shall discuss the D-dependence of TC and JC below.
Relationship between D and Superconducting Properties (JC and TC)
Apparently, the observed JC deviates from an exponential field dependence (Figure 4(a)). This can be explained by assuming two different pinning sites in the fractal YBCO, i.e., the defects in the AKD part and those in the net YBCO part. Thus a curve-fitting analysis was carried out using equation (2),
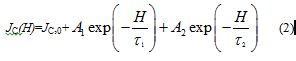
where H, JC,0, Ai, and ti ( i = 1,2) indicate magnetic field strength [G], offset values of JC [A cm-2], amplitudes [A cm-2], and relaxation constant [G-1], respectively. Among the parameters of JC,0, Ai, and ti, only ti (i = 1,2) has a physical meaning intrinsic to the sample and independent of the experimental conditions. The value of JC,0 originates from residual magnetization and depends on the amount and distribution of defects in samples and the experimental conditions such as magnetic fields. The absolute values of Ai depend on the system sizes (the volumes of the AKD and YBCO parts). The relative values of Ai, i.e., A1/A2 or A2/A1, have a physical meaning intrinsic to the fractal dimension D. The relative values of Ai describe the ratio of the number of the flux lines penetrating the AKD parts to that penetrating the YBCO parts. Because AKD (a diamagnetic insulator) and YBCO should have clearly different strengths of pinning magnetic flux lines and thus clearly different values of ti, the curve-fitting analysis above can distinguish one from the other. The fitting results are shown in Supporting Information (Figures S7(a)-7(g) and Table S3) and the obtained parameters are summarized in Figure 6. The errors in ti-1, Ai, and D are approximately ±2.5 %, ±2.5 %, and ±0.01, respectively, which was estimated from the arbitrariness and statistical errors (standard deviations) in the curve-fitting analysis of Jc using equation (2). The arbitrariness was examined by independent curve-fitting analyses with different ranges and initial parameters. The values of ti-1 (i = 1,2) respectively remain constant through 2.5 £ D £ 3.0 (Figure 6(a)), which supports the validity of our assumption that the respective term in equation (2) is related to either of the chemical components, the AKD or (defects in) the YBCO parts. The t1-1 [= (1.8 ± 0.4) ´ 10-5 G-1] is smaller than the other [t2-1 = (1.9 ± 0.2) ´ 10-4 G-1] by one order of magnitude. Thus the magnetic flux lines penetrating the parts characterized by t1 are more tightly pinned than the other and less sensitive to increase in magnetic field H. Therefore t1 and t2 should correspond to the AKD and the YBCO parts, respectively. The values of A1/A2 exhibit a steep rise below D = 3.00, take a sharp maximum at D = 2.98 and another local maximum at D = 2.92 (Figure 6(b)). We shall discuss the origin of this characteristic behavior later. Such behavior semi-quantitatively agrees our previous observation about TN vs. D of the CoO/AKD fractal samples (Figure 3, inset) [27]. Although superconductivity appears to be a quite different phenomenon from magnetic ordering, the D-dependence of TC and JC can be explained by the same discussion as the D-dependence of TN [26, 27] as shown in the next section. By considering an infinite cubic lattice, the D-dependence of critical (Curie or Néel) temperature TC is described by equation (3),
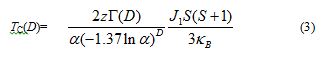
where z, a, J1, S, kB and G(D) are the number of nearest neighbor site, a spatial decay constant of spin-spin interaction (a < 1), the exchange integral between the spin at the origin and one of the spins at the nearest neighbor sites, the spin momentum, the Boltzmann constant, and the Gamma function. The model described by equation (3) is based on a mean field approximation and a Heisenberg model. The calculated TN of CoO within this framework is quantitatively consistent with the observed value [32]. In this model, the exchange energy between the spin at the origin  and all other spins
  is considered to evaluate the magnetic ordering temperature TC. The interaction between and is assumed to decay in proportional to , where b is a constant depending only on the distance between and and thus b is lattice-dependent. The Gamma function describes the number of spins with a distribution having fractal dimension D. The parameter a is introduced to approximately describe the exchange integral J0j between and a spin at the distance j in a progressive manner using the exchange integral J1 between and one of its nearest neighbor spins.
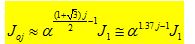
The first term of the exponent (~1.37j) of a is dependent on the geometry of the lattice selected for the model, yet any lattice should give a finite number of a similar order. Thus the term
is considered to be qualitatively similar in general cases.
In a finite system we should take the surface effect into consideration by introducing a correction factor as equation (4) [27].
, where RS/V is the ratio of surface area to volume of a given fractal body. Note that the word “surface effect” includes the effect from grain boundaries. The D-dependence of TC described by equation (4) is shown in the inset of Figure 3 (the black line).
Fractal model in this work
In our previous work, a combination of a Heisenberg model and a fractal spin distribution was applied to explain the observed variation in the Néel temperatures of CoO/AKD mixed powder samples. Here it should be made clear how our previous model can be applied to superconductivity. Firstly, the D-dependence of a cooperative phenomenon, if any, is based on the number of sites around a particular site located at the origin. Because of the self-similarity of fractal bodies, any site can be this “particular site at the origin”. The number of sites is dependent only on the geometrical feature of the site distribution. This distribution is quantitatively and generally described by its unique fractal dimension D. Since both superconductivity and magnetic ordering belong to cooperative phenomena and both are based on interactions between sites, it is considered that their D-dependences should be qualitatively common, i.e. TC should follow the same type of formula like equation (3).
TC= (constant A) × f(D) (3)’
where “constant A” is independent of D (but can be a function of any other parameters related to the system and phenomenon), and f(D) is a function of D only.
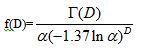
It should be noted here again that our previous model, equation (3), is an application of a Heisenberg model to a spin system having fractal distribution, and that the model is mathematically a product of two terms corresponding the two independent origins as shown by equation (3)’. For example, in the case of the Heisenberg CoO/AKD system, f(D) can be formulated as follows.
In our generalized model described by equation (3)’, all specific conditions are included in the constant A, such as Heisenberg spin system, superconducting mechanism, and so on. Thus the actual values of constant A differ between magnetic ordering and superconducting transitions. However, the Gamma function in equation (3) directly and exclusively originates from the fractal spin distribution, and a spatial decay of inter-site interaction can be generally expressed by an appropriate a (a < 1). Here inter-site interaction is meant for intermolecular or interatomic interaction that forms the electronic structure including electron-phonon interaction. Accordingly, the dependence on D of the TCs of different phenomena should be qualitatively or approximately described by f(D), if the assumption above is valid. In this work we are not interested in the precise value or analytical formula of constant A, but interested in how TC depends on D, i.e. whether TC can be connected with f(D) or not. Additionally JC might have a similar dependence on D.
Thus a tentative discussion will be made here based on the abovementioned analogy. One can obtain the same D-dependence of TC simply by interpreting that the Gamma function describes the number of superconducting sites instead of the number of magnetic sites (spins). Here the superconducting site means the minimum YBCO part having the dimension of the coherent lengths and exhibiting bulk superconductivity. This is why Figure 1(e) (TC vs. D) resembles the inset (the red curve) of Figure 3 (TN vs. D).
Figure 1. Temperature dependences of magnetic susceptibility c and resistivity r. Fractal dimensions D are designated in each graph. (a) overall magnetic behavior below 100 K (cooled process, H = 100 G); note that 4pc is dimensionless, (b) close view around TC, (c) overall electrical behavior, (d) close view around TC, and (e) TC as midpoint vs. D. In (e) red curve is a guide for eye.
The D-dependences of 4pM (Figure 3), JC(D)/JC(3) (Figure 5) and A1/A2 (Figure 6(b)) share the following features;
(A) Complicated dependence on D at ~2.8 £ D £ 3.0
(B) A sharp maximum (in Figures 3 and 6(b)) or minimum (in Figures 5 and 6(b)) at D = 2.95±0.03
(C) A broad maximum (in Figures 3 and 6(b)) or minimum (in Figure 5) at D ~ 2.8
These features also resemble the D-dependence of TC (Figure 1(e)), as mentioned above. Thus there can be an intrinsic origin of the observed D-dependence common to these superconducting properties. The minimum values of magnetization 4pM occur at the lower critical fields HC1, where magnetic flux lines begin to penetrate the YBCO parts in the AKD/YBCO mixed powder samples. With regard to the superconductors, the energy is lower when the magnetic flux lines penetrate the AKD parts than otherwise. However, with regard to the magnetic flux lines, the energy is lower when the magnetic flux lines keep themselves as away from each other as possible due to the repulsion between themselves. This situation generally makes them arrange in a regular geometry like a lattice, and also makes them go as straight as possible. As a result, some of the magnetic flux lines penetrate the YBCO parts. Thus the number of the magnetic flux lines penetrating the AKD parts should depend on the amount and distribution of the AKD parts in the mixed powder samples, i.e., the fractal dimension D. This is why the minimum values of magnetization 4pM (Figure 3) and A1/A2 (Figure 6(b)) vary with D. Because the critical current density JC is also directly dependent on how many magnetic flux lines penetrate the YBCO parts, JC(D)/JC(3) (Figure 5) also vary with D.
Figure 3. Minimum values of magnetization (at H ~ 2310 G) vs. D at 2 K. Broken curve is a guide for eye. Inset shows our previous observation of TN vs. D in the fractal spin system in CoO [27].
Figure 5. Normalized JC vs. D. Broken curves are guides for eye. Red broken curve; based on the data at H = 15100 G, and black broken curve; based on the data at H = 402.5 G.
Figure 6(a)-(b). D-dependences of best-fitting parameters in eq. (2). (a) ti-1, and (b) Ai. Estimated errors in ti-1, Ai, and D are approximately ±2.5 %, ±2.5 %, and ±0.01, respectively.
Based on the semi-quantitative explanation by equation (4), firstly we shall discuss the observed D-dependence of JC and TC in a qualitative way. When the AKD content is lower, i.e., D is close to 3, some magnetic flux lines should take roundabout routes when they penetrate AKD. This situation has both thermodynamic advantage and disadvantage as discussed above. If there are not AKD parts around a flux line, it would go straight and penetrate YBCO parts. Thus it depends on the detail of distribution of AKD in the sample whether each magnetic flux line actually penetrates AKD or not. The distribution, as well as the content, of AKD is described by D. In particular, when the AKD content is comparable to the defect content in YBCO, it will sensitively depend on D whether each magnetic flux line actually penetrates AKD or YBCO in order to lower the total energy. A series of chemical analysis data shown in the Supporting Information indicated that all the YBCO powder samples used in this study contained only a small amount of defects. Therefore, the AKD content becomes comparable to the defect content in YBCO when D is particularly close to 3. This qualitatively explains the complicated D-dependence of TC and JC in the range of ~2.8 £ D £ 3.0.
On the other hand, when the AKD content is higher, i.e., D is clearly lower than 3, most of the magnetic flux lines can penetrate the AKD parts in the samples. This situation would not change substantially when the AKD content even more increases, i.e., when D even more decreases. This means small D-dependence at lower D.
It requires more quantitative examination of fractal bodies to explain the anomaly at D = 2.95±0.03, which is now under way in our laboratory and will be reported in due course. However, in fact, the observed TC and JC both exhibited anomalies at D ~ 2.9, which can be semi-quantitatively explained by the general D-dependence of cooperative phenomena described by equation (4).
The critical current density JC and critical temperature TC of YBa2Cu3O7-d (d = 0.02±0.02) depend on the fractal dimension D. In particular, both JC and TC sensitively vary in the ranges of ~2.8 £ D £ 3.0 and ~2.9 £ D £ 3.0, respectively, and take the maximum values at D » 2.88 for JC and D » 2.92-2.98 for TC. When the applied magnetic field H is rather low (£ 400 G), JC(2.88) is greater than JC(3) by ca. 7%. Similarly, TC(2.92-2.98) is greater than TC(3) by ca. 0.7%. Such behavior is semi-quantitatively explained by considering the fractal structures of the samples. In addition, the D-dependences of TC and JC are explained with the same quantitative discussion as those of Néel temperatures of fractal CoO-AKD mixed powder samples.
T. Naito planed the study, collected the XPS and a part of the magnetic susceptibility data, analyzed the whole set of data, and wrote the paper. H. Yamamoto prepared and characterized the sapmles, collected conductivity and a part of magnetic susceptibility data. He derived the values of JC by analysis of the magnetic susceptibility data. K. Konishi, K. Kubo, and T. Nakamura helped T.N. in the magnetic susceptibility measurements. H. Mayama carried out the neutron scattering experiments and analyzed the data to derive the calibration curve for estimation of fractal dimension of each sample.
The authors declare that they have no competing interests.
This work is sponsored in part by Grant-in-Aids for Exploratory Research (No. 19655044) from the Ministry of Education, Culture, Sports, Science and Technology, Japan (MEXT), Grants-in-Aid for Scientific Research, Scientific Research (C) (No. 23540432) from Japan Society for the Promotion of Science (JSPS), a financial support from Network Joint Research Center for Advanced Materials and Devices, and a research grant from Ehime University.
- Korshunov MM, Ovchinnikov SG, Shneyder EI, Gavrichkov VA, Orlov Yu S, et al. (2012) Cuprates, manganites and cobaltites: multielectron approach to the band structure. Mod Phys Lett B 26: 1230016.
- Kagan M Yu (2013) Modern Trends in Superconductivity and Superfluidity, Springer, Lecture Notes in Physics 874.
- Takeshita N, Yamamoto A, Iyo A, Eisaki H (2013) Zero resistivity above 150 K in HgBa2Ca2Cu3O8+d at high pressure. J Phys Soc Jpn 82: 023711.
- Schilling A, Cantoni M, Guo JD, Ott HR (1993) Superconductivity above 130 K in the Hg-Ba-Ca-Cu-O system. Nature 363: 56-58.
- Chu CW, Gao L, Chen F, Huang ZJ, Meng RL, et al. (1993) Superconductivity above 150 K in HgBa2Ca2Cu3O8+d at high pressures. Nature 365: 323-325.
- Gao L, Xue YY, Chen F, Xiong Q, Meng RL (1994) Superconductivity up to 164 K in HgBa2Cam-1CumO2m+2+d (m=1, 2, and 3) under quasihydrostatic pressures. Phys Rev B 50: 4260-4263.
- Monteverde M, Acha C, Núñez-Regueiro M, Pavlov DA, Lokshin KA, et al. (2005) High-pressure effects in fluorinated HgBa2Ca2Cu3O8+d. Europhys Lett 72: 458-464.
- de Oliveira IN, dos Santos TB, de Moura FABF, Lyra ML, Serva M (2013) Critical behavior of the ideal-gas Bose-Einstein condensation in the Apollonian network. Phys Rev E 88: 022139.
- Lin YH, Goldman AM (2010) Hard energy gap in the insulating regime of nominally granular films near the superconductor-insulator transition. Phys Rev B 82: 214511.
- Agop M, Paun V, Harabagiu A (2008) El Naschie’s e(¥) theory and effects of nanoparticle clustering on the heat transport in nanofluids. Chaos Solitons & Fractals 37: 1269-1278.
- Agop M, Nica PE, Ioannou PD, Antici A, Paun VP (2008). Fractal model of the atom and some properties of the matter through an extended model of scale relativity. Eur Phys J D 49: 239-248.
- Mola MM, Haddad R, Hill S (2006) Fractal flux jumps in an organic superconducting crystal. Solid State Commun 137: 611-614.
- Kim CK, Rakhimov A, Yee JH (2005) Ginzburg-Landau theory of superconductivity at fractal dimension. Phys Rev B 71: 024518.
- Berti V, Gatti S (2006) Parabolic-hyperbolic time-dependent Ginzburg-Landau-Maxwell equations. Quarterly of Applied Mathematics 64: 617-639.
- Tang Q, Wang S (1995) Time dependent Ginzburg-Landau equations of superconductivity. Physica D-Nonlinear Phenomena 88: 139-166.
- Umezawa A, Crabtree GW, Liu JZ, Weber HW, Kwok WK, et al. (1987) Enhanced critical magnetization currents due to fast neutron irradiation in single-crystal YBa2Cu3O7-d. Phys Rev B 36: 7151-7154.
- Civale L, Marwick AD, Worthington TK, Kirk MA, Thompson JR, et al. (1991) Vortex confinement by columnar defects in YBa2Cu3O7 crystals: enhanced pinning at high fields and temperatures. Phys Rev Lett 67: 648-651.
- Kwok WK, Olsson RJ, Karapetrov G, Paulius LM, Moulton WG, et al. (2000) Effect of defects on the critical points in YBa2Cu3O7-d. Physica C 341-348(Part 2): 953-956.
- Bugoslavsky Y, Cohen LF, Perkins GK, Polichetti M, Tate TJ, et al. (2001) Enhancement of the high-magnetic-field critical current density of superconducting MgB2 by proton irradiation. Nature 411: 561-563.
- Hua J, Welp U, Schlueter J, Kayani A, Xiao ZL, et al. (2010) Vortex pinning by compound defects in YBa2Cu3O7-d. Phys Rev B 82: 024505.
- Izumi M, Noudem J (2012) “Improvement of critical current density and flux trapping in bulk high-TC superconductors”, in Superconductors: Materials, Properties and Applications, Ed. by Gabovich, A. Chap. 4: 61-82.
- Marco S, Mauro C (2013) Disorder in oxides. Current Inorganic Chemistry 3: 35-49.
- Zeljkovic I, Hoffman JE (2013) Interplay of chemical disorder and electronic inhomogeneity in unconventional superconductors. Phys Chem Chem Phys 15: 13462-13478.
- Walsh D, Wimbush SC, Hall SR (2007) Use of the polysaccharide dextran as a morphological directing agent in the synthesis of high-TC superconducting YBa2Cu3O7-d sponges with improved critical current densities. Chem Mater 19: 647-649.
- Yamaguchi D, Mayama H, Koizumi S, Tsujii K, Hashimoto T (2008) Investigation of self-assembled fractal porous-silica over a wide range of length scales using a combined small-angle scattering method. Eur Phys J B 63: 153-163.
- Mayama H, Naito T (2009) Correlation between Curie temperature and system dimension. Physica E 41: 1878-1881.
- Naito T, Yamamoto H, Okuda K, Konishi K, Mayama H, et al (2013) Magnetic ordering of spin systems having fractal dimensions: Experimental study. Eur Phys JB 86: 410.
- Fiez WA, Webb WW (1969) Hysteresis in superconducting alloys: Temperature and field dependence of dislocation pinning in niobium alloys. Phys Rev 178: 657-667.
- Thompson JR, Christen DK, Sekula ST, Brynestad J, Kim YC (1987) Magnetization studies of the high-TC compound yttrium barium copper oxide (YBa2Cu3Oz). J Mater Res 2: 779-782.
- Senoussi S, Oussena M, Collin G, Campbell IA (1988) Exponential H and T decay of the critical current density in YBa3Cu3O7-d single crystals. Phys Rev B 37: 9792-9795.
- Chen DX, Sanchez A, Muñoz JS (1990) Exponential critical-state model for magnetization of hard superconductors. J Appl Phys 67: 3430-3437.
- Kittel C (1976) Introduction to Solid State Physics, 5th edition, John Wiley & Sons, Inc., New York 479-481.
- Mandelbrot BB (1977) The Fractal Geometry of Nature, Freeman, New York.
- Matsushita M (2002) Physics of Fractal (I) (in Japanese), Shohkaboh, Tokyo, Chap. 4: 28-61.
- Matsushita M (2002) Physics of Fractal (I) (in Japanese), Shohkaboh, Tokyo, Appendix B: 151-157.
- Martin JE, Schaefer DW, Hard AJ (1986) Fractal geometry of vapor-phase aggregates. Phys Rev A 33: 3540-3543.
- Hard AJ, Schaefer DW, Martin JE (1987) Surface and mass fractals in vapor-phase aggregates. Phys Rev A 35: 2361-2364.