To compare the signal-to-noise ratio (SNR) and effective dose at low dose (80-100 kV) contrast-enhanced computed tomography (CT) to conventional contrast-enhanced CT (120 kV) in the assessment of the therapeutic outcome in patients with hepatocellular carcinoma (HCC) treated by thermal ablation and/or trans-arterial chemo-embolization (TACE).
Materials and methods: Twenty-one cirrhotic patients (15 male and 6 female, 71 years±15) with HCC(s) were referred to contrast-enhanced CT to assess therapeutic outcome after thermal ablation (n=7) or TACE (n=7) or thermal ablation and TACE (n=7). CT examination was performed at 120 kV after 370 mgI/mL contrast injection (120 kV-370 mgI/mL) before treatment, 100 kV after 370 mgI/mL contrast injection (100 kV-370 mgI/mL) at 3 months and 100 kV after 400 mgI/mL contrast injection (100 kV-400 mgI/mL) 6 months after treatment, and 80 kV after 400 mgI/mL contrast injection (100 kV-400 mgI/mL) at 12, 18 and 24 months after treatment. The SNR was calculated by drawing a region-of-interest in hepatic parenchyma and abdominal fat.
Results: 120 kV-370 mgI/mL vs 100 kV-370 mgI/mL vs 100 kV-400 mgI/mL vs 80 kV-400 mgI/mL did not differ in SNR (3.4±1.2 vs 2.9±1.16 vs 2.9±0.5 vs 2.2±1; ANOVA test, P=0.41) while differed in effective dose (27.9±8.1 vs 17.2±4.6 vs 19.2±5.2 vs 14±5.8 mSv; ANOVA test, P=0.002).
Conclusion: Contrast-enhanced CT at 80-100 KV after high concentration iodinated contrast media injection does not reduce SNR but provides a significant reduction in the effective dose in cirrhotic patients undergoing follow-up after thermal ablation and/or TACE.
CT, liver, HCC, effective dose, signal-to-noise ratio
The assessment and monitoring of therapeutic outcome after loco-regional treatment of hepatocellular carcinoma (HCC) in cirrhotic patients represents an essential item. According to the American Association for the Study of Liver Disease (ASL) [1] and the European Association for the study of the liver (EASL) [2] the modified Response Evaluation Criteria in Solid Tumors (mRECIST) criteria [3, 4] should be used to assess the therapeutic outcome in HCC treated by thermal ablation or trans-arterial chemoembolization (TACE). mRECIST criteria are based on the measurement of the largest dimension of the enhancing tumoral tissue on arterial phase of dynamic computed tomography (CT) or magnetic resonance (MR) imaging [5 – 7].
Even though both CT and MR imaging are accepted as the imaging modalities to be used in the assessment of the therapeutic outcome in HCC according to the mRECIST criteria [3, 4], CT is still the most employed imaging technique in the clinical practice. On the other hand the radiation exposure during CT studies is of concern, especially in patients with HCC who need a prolonged imaging follow-up for an accurate assessment of the therapeutic outcome after loco-regional treatments including thermal ablation and TACE [3, 4]. In these patients, due to multiple CT examinations scheduled during the imaging follow-up period, radiation dose should be kept at a minimum level provided that a diagnostically adequate image quality is maintained. Since the attenuation effect of iodinated contrast material is greater at the mean x-ray photon energy closer to the k-edge of iodine (33.2 KeV), low tube voltage (80 kVp) compared with high tube voltage acquisition (120 kVp) determines that an higher number of x-ray photons on the lower end of the energy spectrum presents a photoelectric interaction with the K-shell electrons with a consequent higher attenuation. For these reasons the use of a low tube voltage allows to employ a lower amount of iodinated contrast material required to achieve the same degree of contrast enhancement [8] and without image quality degradation [9].
By decreasing the tube voltage, the amount of iodinated contrast material can be reduced. In particular, the minimal iodine (I) dose required to achieve an acceptable tumor-to-liver contrast-to-noise ratio on 80-kVp corresponds to 0.3 g I / kg or 11 g I / m2 [10], while for CT performed at 120 kVp the iodine dose necessary to achieve 50-HU hepatic enhancement on portal venous phase is 0.521 g I / kg or 18.6 g I / m2 [11 – 14].
The aim of the present study was to compare 80 kV, 100 kV and 120 kV protocols in the assessment of the therapeutic outcome in HCC.
Patients
This was a prospective observational study which was approved by the IRB of our hospital with a waiver of patients’ informed consent.
Inclusion criteria were: patients with HCC diagnosis based on imaging criteria developed by EASL and ASL [1, 2] or based on histology who were scheduled to undergo thermal ablation (radiofrequency or microwave) or TACE or thermal ablation and TACE at our institution; contrast-enhanced CT examination performed according the following four protocols employed according to the time from treatment: hepatic arterial phase -HAP- and late phase -LP- scan at 120 kV after 370 mgI/mL contrast media injection (Ultravist, Iopromide 370, Bayer, Berlin) before treatment (120 kV – 370 mgI/mL); 100 kV after 370 mgI/ml contrast media injection (Ultravist, Iopromide 370, Bayer, Berlin) 3 months after treatment (100 kV – 370 mgI/mL); 100 kV after 400 mgI/ml contrast media injection (Iomeron, Iomeprol 400, Bracco, Milan) 6 months after treatment (100 kV – 400 mgI/mL); 80 kV after 400 mgI/ml contrast media injection (Iomeron, Iomeprol 400, Bracco, Milan) 12, 18 and 24 months after treatment (80 kV – 400 mgI/mL); no more than 6 months between thermal ablation and TACE.
Initially, thirty-two patients were included over a period of three years. Eleven patients were excluded at the end of the study: in particular seven patients were not referred to the scheduled CT examinations during the follow-up, two patients did not undero HAP or LP acquisition at CT examination, and two patients had numerous HCCs involving the entire liver that may have changed hepatic hemodynamics.
Thus the final study sample consisted of 21 patients (15 male, 6 female; age range, 48–88 years; mean, 69 years ± 15; BMI, 20 - 25; mean, 55.0 ± 8.4 [SD] kg). The age range of the men was 48–88 years (mean, 67.5 years), and that of the women was 52–85 years (mean, 71.0 years).
Thermal ablation and tace
Strategies of HCC treatment by using thermal ablation and/or TACE were discussed at weekly multidisciplinary meetings and were based on pre-procedural CT images.
All thermal ablation procedures were performed by two radiologists with 8 and 10 years of experience in thermal ablation before starting our study. Treatments were performed with the use of local anesthesia and conscious analgesic sedation. Thermal ablation devices included commercially available internally cooled electrode systems for radiofrequency or microvawe antenna with generators (HS AMICA - HS Hospital Service, Varese, Italy). Ablative margins of at least 0.5 cm beyond the tumor boundary were planned for all lesions, with the exception of sub-capsular and perivascular portions. After ablation, electrodes were retracted with cauterization of the electrode path to prevent or minimize bleeding or tumor seeding.
All TACE were performed after femoral artery cannulation with a 5-French catheter to outline the anatomy, delineate the tumors, and identify the portal vein. The third- or fourth-order branches of feeding vessels supplying the HCC were catheterized with a 2.8-French or a 2.1-French microcatheter. Then, the tumors were embolized with a slow fluoroscopy-guided injection of iodinated contrast material mixed with 100–300 µm low-compression beads impregnated with 50 mg of doxorubicin in each vial. The first- and second-order branches of the right or left hepatic arteries were kept patent and documented on postembolization completion angiography.
CT examination
CT of the liver was performed with 256-row multi-detector row CT system (Brilliance iCT 256, Philips, Best, The Netherlands) before and 3, 6, 12, 18 and 24 months after treatment. In those patients who underwent to a second treatment by thermal ablation or TACE, the contrast-enhanced CT follow-up examination was re-scheduled at 3, 6, 12, 18 and 24 months from the last loco-regional treatment. Each contrast-enhanced CT examination consisted in HAP scan (automatic bolus-tracking with a delay of 18 seconds after the threshold of 120 HU had been reached in the abdominal aorta) and LP scan (3 minutes from the beginning of contrast injection) after the i.v. bolus injection of iodinated contrast material (120 mL of iodinated contrast injected at 4 mL/sec followed by 50 mL of saline flush at 2 mL/sec) administered with a dual-syringe power injector (Stellant CT injector, Medrad, Indianola, PA) via a 20-gauge catheter inserted into an antecubital vein. Patients were instructed to hold their breath with tidal inspiration during scanning.
Technical parameters were: detector collimation; 0.625 mm; beam collimation, 128 x 2 x 0.625 mm; normalized beam pitch, 0.975; z-axis coverage, 32–160 mm; reconstruction interval, 0.3-mm; reconstructed section thickness, 3 mm; automatic exposure control on the basis of the x-ray attenuation on antero-posterior and lateral scout images and the reconstruction kernel; tube current (effective mA) 280–400 mA depending on patient size; x-ray tube rotation period, 0.4–0.27 s; field of view, 40 cm. Combined data from both x-ray tubes were reconstructed with weighted filtered back projection by using the B31f standard reconstruction kernel to generate standard-dose datasets (the standard reconstruction used at our institution).
All quantitative analysis was performed on workstation Extended WorkSpace eXplore (Philips, Best, The Netherlands). One board-certified radiologist with 11 years of experience in liver CT and blinded to the different protocols measured the mean attenuation of the hepatic parenchyma with a circular region-of-interest (ROI) cursor.
Figure 1 shows the quantitative procedure used in the present study. Hepatic mean attenuation was measured in Hounsfield Units (HU) in three separate areas (left lobe – II segment - and anterior – V - and posterior - VII - segments of the right lobe) on images obtained at the level of the main portal vein on HAP. If one or more liver segments were absent due to previous resection the ROI was positioned in the adjacent inferior or superior liver segment within the same liver lobe. The attenuation values for each liver segment were averaged and one single ROI value resulted from each exam. An attempt was made to maintain a constant ROI area of approximately 2 cm2; the range was 0.8–2.0 cm2. Visible blood vessels, bile ducts, parenchyma areas treated by ablation or TACE, and artifacts were carefully excluded from ROI measurements in the hepatic parenchyma. One ROI was drawn in peritoneal abdominal fat adjacent to the liver, avoiding possible strands, and the standard deviation was recorded for the calculation of the signal-to-noise ratio (SNR) as: Liver Mean HU / SD where SD means standard deviation.
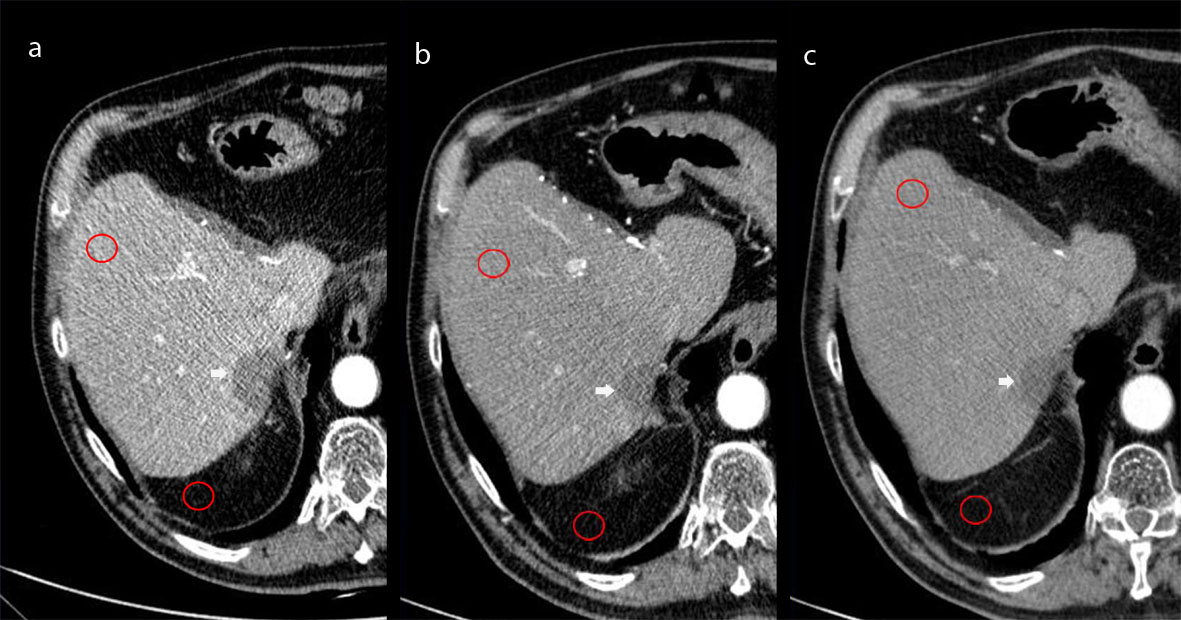
Figure 1. Hepatic mean attenuation measured through one of the three ROIs placed over the fifth segment of the liver and one ROI drawn in peritoneal abdominal fat adjacent to the liver avoiding strands. Images obtained at 80kV (a), 100kV (b), and 120 kV (c).
Contrast-to-noise ratio (CNR) was calculated using background attenuation values and noise from the abdominal fat at each arterial level as: CNR = (HUvessel − HUliver)/[(SDfat).
Attenuation measurements were obtained at hepatic parenchyma and within arterial ROIs as average HU and noise (standard deviation in HU within an ROI) at the level of the aorta at the takeoff of the superior mesenteric artery. The size of the ROIs was consistent for all subjects (52.9mm2 within the aorta). Reference data were obtained from ROIs in the surrounding musculature, either erector spinae muscles or gluteal muscles.
To compare image quality in the different protocols, two board-certified radiologists with 22 and 11 years of experience in abdominal CT performed consensual visual assessments of image quality including the visual assessment of noise and beam hardening artifacts in one single reading session. They were blinded to clinical data and evaluated both HAP and LP images. After their independent evaluations, the reviewers assigned a score in consensus. Image noise was quantified on a 3-point scale on which a score of 3 denoted almost no or minimal image noise throughout the image; 2, a moderate degree of image noise which does not limit the assessment of the liver parenchyma in every segments, and 1, severe image noise that may severely hamper liver parenchyma assessment. Beam hardening that resulted in streak artifacts was rated on a 3-point scale on which a score of 3 denoted almost no streak artifacts throughout the image; 2, a moderate degree of streak artifacts; and 1, strong streak artifacts.
All readings were performed on a Picture Archiving and Communications System (PACS) – integrated workstation (19-inch TFT display, resolution 2560 x 1600 pixels, Ebit Sanità AET, Genoa, Italy) by using a proprietary software package (Ebit Sanità AET, Genoa, Italy). The preset window level of 50 HU and width of 300 HU for 120-kVp images, 60 HU and width of 400 HU for 100-kVp images, and level of 70 HU and width of 450 HU for 80-kVp images could be changed be readers.
We recorded the volume CTDIvol for scans obtained with the three protocols. Calculations were performed at the operating console of the CT scanner. We also recorded the scan range for the liver during the HAP and LP and calculated the dose-length product (DLP, mGy x cm) for the whole length of the liver on the basis of the CTDIvol (mGy) and scan range (cm). We then estimated the effective radiation dose by using the following equation: Effective dose (mSv) = (CTDIvol × scan range) × 0.015 [15].
Statistical analysis was performed using MedCalc (Mariakerke, Belgium). A per-patient analysis was performed.
For data analysis, the SNR and effective dose values measured at CT examinations performed at 12, 18 and 24 months after treatment (80kV - 400 mgI/ml) were averaged in each patient.
One-way ANOVA with Scheffè correction was employed to determine the differences in the SNR and DLP and effective dose among the different CT examination protocols (120 kV – 370 mgI/mL; 100 kV – 370 mgI/mL; 100 kV – 400 mgI/mL; 80 kV – 400 mgI/mL). For all statistical tests, a P value < 0.05 was considered to indicate a statistically significant difference.
Patients underwent only radiofrequency (n=2) or microwave (n=5) thermal ablation or only TACE (n=7) or thermal ablation and TACE (n=7). In those patients who underwent both thermal ablation and TACE the mean temporal range between the two procedures was mean ± SD, 4.43 ± 1 months (range 2 – 6 months).
The number of treated HCC nodules per patient were ≤2 (diameter ± SD, 24.23 mm ± 9.6; range 10 – 40mm) treated by thermal ablation, 2 - 10 (diameter ± SD, 30.6 mm ± 17.1; range 10 – 80mm) treated by TACE, and 1 – 3 (diameter ± SD, 24.9 mm ± 12.7; range 8 – 70mm) treated by thermal ablation and TACE.
On qualitative assessment CT images were quoted with a mean 2.5 visual score (range 2 – 3) without any significant difference (P=0.8) between the different technical protocols. Beam hardening artifacts were visualized only in the 80 kV protocol in all patients with a mean score = 2.
Table 1 shows the results of the SNR, CNR, DLP (mGy*cm), and the values of effective dose (mSv) for the different CT protocols. Within matched comparisons by Scheffè correction the protocols 120 kV - 370 mgI/mL vs 100 kV - 370 mgI/mL vs 100 kV - 400 mgI/mL vs 80 kV - 400 mgI/mL did not differ in SNR (P=0.41).
Table 1. Signal - to - noise ratio for the different CT examination protocols
|
|
120 kV –
370 mgI/mL
|
100 kV –
370 mgI/mL
|
100 kV –
400 mgI/mL
|
80 kV –
400 mgI/mL
|
|
Signal-to-noise ratio (SNR)
|
3.4 ± 1.2
|
- ± 1.1
|
- ± 0.5
|
2.2 ± 1
|
|
Contrast-to-noise ratio (CNR)
|
- ± 4.12
|
0.42 ± 1.93
|
0.42 ± 1.9
|
0.2 ± 2.78
|
|
Dose - length product
(mGy*cm)
|
1861 ± 543.4
|
1148.7 ± 309.4
|
1232.3 ± 353.2
|
936.5 ± 389.7
|
|
Effective radiation dose
(mSv)
|
27.9 ± 8.1
|
17.2 ± 4.6
|
19.2 ± 5.2
|
14 ± 5.8
|
|
Values are expressed as mean ± standard deviation
|
The CNR was significantly different (P=0.03) within matched comparisons between the CT protocols 120 kV - 370 mgI/mL vs 100 kV – 370 mgI/mL vs 100 kV - 400 mgI/mL vs 80 kV - 400 mgI/mL. On the other hand, no significant difference was found between 120 kV - 370 mgI/mL and 100 kV - 370 mgI/mL CT protocols (P=0.4).
2021 Copyright OAT. All rights reserv
The mean effective dose was significantly different (P=0.03) within matched comparisons between the CT protocols 120 kV - 370 mgI/mL vs 100 kV – 370 mgI/mL vs 100 kV - 400 mgI/mL vs 80 kV - 400 mgI/mL. On the other hand, no significant difference was found between 120 kV - 370 mgI/mL and 100 kV - 370 mgI/mL CT protocols (P=0.4).
Currently contrast-enhanced CT is the most frequently used imaging modality to plan and to evaluate the therapeutic outcome in cirrhotic patients with HCC treated by thermal ablation or TACE. According to both EASL and ASL [1, 2] patients treated by thermal ablation and TACE should undergo contrast-enhanced CT examination every 3-6 months to assess the therapeutic outcome. According to the mRECIST criteria [3, 4] contrast - enhanced MR imaging has also been assessed as a valuable method to study patients with HCC, due to its inherent superior tissue contrast resolution and sensitivity for detection of both the lesion and associated posttreatment changes in particular after TACE. Anyway, lower costs and higher availability make CT the most used imaging technqiue for both HCC characterization and post-treatment follow-up for response assessment.
The principal finding of the present study was that CT examination at 80kV or 100kV after high concentration iodinated contrast agent (370 mgI/mL or 400 mgI/mL) injection is feasible in patients with HCC treated by loco-regional therapy by keeping the image quality at acceptable level and by minimizing the effective dose. In our study we found that low kV (80-100 kV) CT protocols after high concentration iodinated contrast media injection (370 – 400 mgI/mL) present a similar image quality and SNR and CNR but a lower effective dose than conventional CT protocol (120 kV). Beside cirrhotic patients with an HCC treated by loco-regional therapies, also those patients with a limited intra-venous access, patients who can receive a limited iodinated contrast dose due to renal failure, patients with subtle attenuation differences, young patients, and small and medium-sized adult patients could benefit from low kV CT examination.
The usual protocol for imaging cirrhotic patients with HCC who underwent loco-regional treatment consists in a multiple phase CT examination including unenhanced images (to allow characterization of residual haemorrhagic component), HAP based on a bolus-tracking method (for accurate peak arterial enhancement), portal venous phase at 60 or 70 seconds, and LP at 120 seconds after iodinated contrast injection at a rate of 4 to 5 mL/s. In this study we employed a biphasic contrast-enhanced CT protocol, excluding unenhanced and portal venous phase scan, to limit the effective dose in cirrhotic patients undergoing repeated CT examinations during the imaging follow-up with the assumption that the inclusion of only two phases, HAP and LP, would achieve comparable diagnostic performance to the conventional multiple phase protocol.
In keeping with our results, a recent study showed that the 80-kV CT protocol with the contrast media dose reduced by 50% (300 mgI/kg) yielded contrast enhancement equivalent to the conventional 120-kVp protocol with the standard contrast media dose (600 mgI/ml) [16]. In our study we maintained roughly the same iodine load per patient (450 – 570 mgI / kg for iodine 400 mgI/ml and 410 – 530 mgI / kg for iodine 370 mgI/ml) and the same fractional dose of iodinated contrast agent (21 - 22 mgI / kg / sec) by keeping constant the volume of iodinated agent administered for each patient.
According to our results in a patient population with a BMI in the range of 20 - 25, low-dose dual-phase CT at 80kV kV or 100 kV after 370 mgI/mL or 400 mgI/ml contrast media injection allow to provide the maximal radiation dose reduction with a DLP mean value (<800 mGy*cm) within the diagnostic reference levels for the abdomen [17] and with acceptable SNR to monitor the therapeutic outcome in cirrhotic patients. Even though the noise level increases at low kV (80 – 100 kV) the SNR remains comparable to conventional 120kV CT scan. This was likely due to the higher photon attenuation from photoelectric interaction with the K-shell electrons and the higher iodine concentration contrast agent (370 – 400 mgI / mL) used at 80 – 100 kV in the present study. Our results are also in keeping with previous studies in which low-kV CT scan provided SNR and CNR values comparable to 120-kV CT scan [18 – 20]. Consequently, we believe that low-kV CT (80 – 100 kV) could be employed routinely in patients with HCC during the imaging follow-up after loco-regional treatment.
Our study is limited by its observational nature and the reduced patients’ number due to the strict inclusion criteria. In conclusion, contrast-enhanced CT at 80-100 KV does not reduce SNR but provides effective dose reduction in cirrhotic patients undergoing follow-up after thermal ablation and/or TACE.
Figure captions
Figure 1a - c: Hepatic mean attenuation measured through one of the three ROIs placed over the fifth segment of the liver and one ROI drawn in peritoneal abdominal fat adjacent to the liver avoiding strands. Images obtained at 80kV (a), 100kV (b), and 120 kV (c).
- Bruix J, Sherman M; American Association for the Study of Liver Diseases (2011) Management of hepatocellular carcinoma: an update. Hepatology 53: 1020-1022. [Crossref]
- European Association for the Study of the Liver, European Organisation for Research and Treatment of Cancer (2012) EASL–EORTC Clinical Practice Guidelines: Management of hepatocellular carcinoma. J Hepatol 56: 908–943. [Crossref]
- Llovet JM, Di Bisceglie AM, Bruix J ( 2008) Design and endpoints of clinical trials in hepatocellular carcinoma. J Natl Cancer Inst 100: 698 – 711. [Crossref]
- Lencioni R, Llovet JM (2010) Modified RECIST (mRECIST) assessment for hepatocellular carcinoma. Semin Liver Dis 30: 52-60. [Crossref]
- Hayashi M, Matsui O, Ueda K, Kawamori Y, Gabata T, et al. (2002). Progression to Hypervascular Hepatocellular Carcinoma: Correlation with Intranodular Blood Supply Evaluated with CT during Intraarterial Injection of Contrast Material. Radiology 225: 143 – 149. [Crossref]
- Asayama Y, Yoshimitsu K, Nishihara Y, Irie H, Aishima S, et al. (2008). Arterial blood supply of hepatocellular carcinoma and histologic grading: radiologic-pathologic correlation. AJR Am J Roentgenol 190: W28-W34. [Crossref]
- Luca A, Caruso S, Milazzo M, Mamone G, Marrone G, et al. ( 2010) Multidetector-row computed tomography (MDCT) for the diagnosis of hepatocellular carcinoma in cirrhotic candidates for liver transplantation: prevalence of radiological vascular patterns and histological correlation with liver explants. Eur Radiol 20 898-907. [Crossref][SK1] [SK2] [SK3]
- Thor D, Brismar TB, Fischer MA (2015) Low tube voltage dual source computed tomography to reduce contrast media doses in adult abdomen examinations: A phantom study. Med Phys 42: 5100 – 5109. [Crossref]
- Nakayama Y1, Awai K, Funama Y, Hatemura M, Imuta M, et al. (2005) Abdominal CT with low tube voltage: preliminary observations about radiation dose, contrast enhancement, image quality, and noise. Radiology 237: 945-951. [Crossref]
- Goshima S1, Kanematsu M1, Noda Y1, Kawai N1, Kawada H1, et al. (2016) Minimally Required Iodine Dose for the Detection of Hypervascular Hepatocellular Carcinoma on 80-kVp CT. AJR Am J Roentgenol 206: 518-525. [Crossref]
- Noda Y, Kanematsu M, Goshima S, Kondo H, Watanabe H, et al. (2015) Reducing iodine load in hepatic CT for patients with chronic liver disease with a combination of low-tube-voltage and adaptive statistical iterative reconstruction. Eur J Radiol 84: 11 - 18. [Crossref]
- Husarik DB, Gordic S, Desbiolles L, Krauss B, Leschka S, et al. (2015) Advanced Virtual Monoenergetic Computed Tomography of Hyperattenuating and Hypoattenuating Liver Lesions: Ex-Vivo and Patient Experience in Various Body Sizes. Invest Radiol 50: 695 – 702. [Crossref]
- Takahashi H, Okada M, Hyodo T (2014) Can low-dose CT with iterative reconstruction reduce both the radiation dose and the amount of iodine contrast medium in a dynamic CT study of the liver? Eur J Radiol 83: 684 - 691. [Crossref]
- Yanaga Y1, Awai K, Nakaura T, Namimoto T, Oda S, et al. (2008) Optimal contrast dose for depiction of hypervascular hepatocellular carcinoma at dynamic CT using 64-MDCT. AJR Am J Roentgenol 190: 1003-1009. [Crossref]
- [No authors listed] (2007) The 2007 Recommendations of the International Commission on Radiological Protection. ICRP publication 103. Ann ICRP 37: 1-332. [Crossref]
- Taguchi N, Oda S, Utsunomiya D, Funama Y, Nakaura T, et al. (2016) Using 80 kVp on a 320-row scanner for hepatic multiphasic CT reduces the contrast dose by 50 % in patients at risk for contrast-induced nephropathy. Eur Radiol. [Crossref]
- European Commission (EC) (1999) Radiation protection 109. Guidance on diagnostic reference levels (DRLs) for medical exposures. Directorate-General, Environment, Nuclear Safety and Civil Protection.
- Matsumoto K, Jinzaki M, Tanami Y, Ueno A, Yamada M, et al. ( 2011) Virtual monochromatic spectral imaging with fast kilovoltage switching: improved image quality as compared with that obtained with conventional 120-kVp CT. Radiology 259 (1): 257 – 262. [Crossref]
- Yu L, Christner JA, Leng S, Wang J, Fletcher JG, et al. (2011) Virtual monochromatic imaging in dual-source dual-energy CT: radiation dose and image quality. Med Phys 38: 6371-6379. [Crossref]
- Pinho DF, Kulkarni NM, Krishnaraj A, Kalva SP, Sahani DV, et al. (2013) Initial experience with single-source dual-energy CT abdominal angiography and comparison with single-energy CT angiography: image quality, enhancement, diagnosis and radiation dose. Eur Radiol 23(2): 351 – 359. [Crossref]