Besides the effect of zeolites against plant diseases and insect pests, zeolites may also have beneficial effects for the treated plant itself. Zeolites are able to adsorb CO2, which may influence photosynthesis. Zeolites may also reduce leaf temperature by reflecting the infrared radiation. These properties lead to a reduction of transpiration rate, which may improve the water-use efficiency, the yield and the fruit quality. In this study, the possible beneficial effects of zeolites on plant growth, dry weight, water uptake and photosynthesis are described. Despite the fact that little or no effects were observed for plant growth, water uptake and dry weight, some effects were noticed for the photosynthesis. A clear trend could mainly be observed for the treated apple trees, i.e. an increase of photosynthesis was observed after treating the apple trees with the zeolites, followed by a decrease after two weeks.
zeolites, photosynthesis, apple tree, tomato plant
Particle film technology can be used for controlling arthropod pests and diseases of agriculture crops. In addition, applying particle films can also have beneficial effects on the treated plants. Recent work carried out, using a kaolin particle film, suggests that it generally reduces heat stress, sunburn and drought stress [1-4]. A higher photosynthesis rate can also lead to favorable effects on plant productivity, including an increase in yield and fruit size [5].
Zeolites are able to adsorb carbon dioxide (CO2) molecules, which results in an increased of the amount of CO2 near the stomata. Because of these findings it is important to examine the influence of zeolites on photosynthesis and their possible mitigating effects on heat and drought stress.
Plant material
The experiment was carried out on two different plant species. Measurements were conducted on cuttings of apple trees (Malus domestica vc. Golden Delicious) obtained from Schrama Nurseries, Biddinghuizen, Netherlands. The trees were approximately 26 cm high and their stem diameter at soil surface was approximately 2.3 mm. Subsequently measurements were conducted on tomato plants (Solanum lycopersicum L. vc. Admiro) obtained from BPK, Duffel, Belgium. The plants were approximately 19 cm high and their stem diameter at soil surface was approximately 4.3 mm. All plant material was divided into twelve groups: one control and eleven treatment groups. Each group consisted of 5 plants.
Plant coating materials
The three zeolite types, BEA, FAU and LTA, together with two formulations of each type were compared with a control treatment. Additionally, two biological equivalents of the zeolites, namely kaolin and its commercial formulation ‘Surround’ (Tessenderlo Kerley, US) were taken into account (Table 1).
Experimental set-up
At the end of July, 60 apple trees and 60 tomato plants, respectively, were planted in 5l pots. The apple trees were placed in the open greenhouse facilities of the Laboratory of Plant Ecology, Faculty of Bioscience Engineering, Ghent University, Belgium. The tomato plants were placed in the growth chamber at the Laboratory of Phytopharmacy, Faculty of Bioscience Engineering, Ghent University, Belgium. Two days before starting the measurements, 5 plants per treatment were sprayed with 4000 mg.l-1 of the selected product until runoff (Table 1). The apple trees and tomato plants were respectively treated with the zeolites at the 3rd and 13th of August 2015.
Measurements
Gas exchange and chlorophyll a fluorescence measurements: Foliar gas exchange and chlorophyll a fluorescence parameters were measured using a portable photosynthesis system (model LI-6400; Li-Cor Biosciences, Lincoln, Nebraska, USA) equipped with a fluorescence head (6400-40 Leaf Chamber Fluorometer, Li-Cor Biosciences, Lincoln, Nebraska, USA). This device is an open differential infrared gas analyser (IRGA).
First of all, light response curves were measured on the third fully developed leaf of three apple trees and tomato plants per treatment. This leaf was selected because a preliminary test showed that the obtained data remained stable. The light response curves were recorded using seven light intensities: 0, 50, 100, 250, 500, 1000 and 1500 μmol PAR.m-2.s-1. This was to detect the light intensity at which photosynthesis rates reached a saturation level. Further, a minimum and maximum waiting time of 5 respectively 7 minutes was applied before measurements on a leaf were recorded to allow stabilisation.
Subsequently, light saturated net photosynthesis (An, µmol CO2.m-2.s-1), stomatal conductance (gs, mol H2O.m-2.s-1) and transpiration rate (E, mmol H2O.m-2.s-1) were simultaneously measured on the third leaf of each apple tree and tomato plant. These measurements were performed at saturating red light (1500 µmol PAR.m-2.s-1) achieved with the red light emitting diode (LED) lamp of the fluorescence head, with an additional 10% of blue light to maximize stomatal opening, and 400 µmol CO2.mol-1 in the cuvette. As temperature influences photosynthesis and transpiration rates, the chamber temperature of the fluorescence head was set to 25°C-26°C. Chlorophyll a fluorescence was quantified by measuring the light adapted photosystem II (PSII) efficiency (Fv'/Fm' = 1-F0'/Fm'), calculated from maximum fluorescence after a saturating light flash (Fm’) and minimum fluorescence after a far-red pulse (F0').
Simultaneous with the measurements of the light response curve, stomatal conductance, transpiration rates and chlorophyll a fluorescence parameters were measured. Ambient parameters, such as air temperature (Tair), leaf temperature (Tleaf), vapour pressure deficit (VPD), photosynthetic active radiation (PAR) and relative humidity (RH) were also recorded. Other variables were calculated, such as the intrinsic water use efficiency (An.gs-1) and the instantaneous water use efficiency (An.E-1).
These measurements were carried out twice a week during 4 weeks. The apple trees had eight examination points, while six examination points were sufficient for the tomato plants.
Growth measurements: Stem height and diameter at the base of each plant were measured at the beginning and at the end (after 4 weeks) of the experiment.
Biomass measurements: At the end of the experiment, all foliage and stem biomass were collected. Immediately after harvesting, the fresh weight (FW, g) of this shoot material was determined. Subsequently, foliage and stem biomass were stored dried in an oven at 70°C for about 14 days and weighed. After dry weight (DW, g) was obtained, the water content was calculated as the difference between FW and DW.
Water use efficiency: Water is the main abiotic factor limiting plant production. Water use efficiency (WUE) is a crucial parameter and can be measured at different scales, ranging from measurements on the leaf to more integrative ones at the plant and crop levels (Figure 1) [10]. WUE measurements on plant (integrated) and leaf (gas exchange) level were conducted in this research.
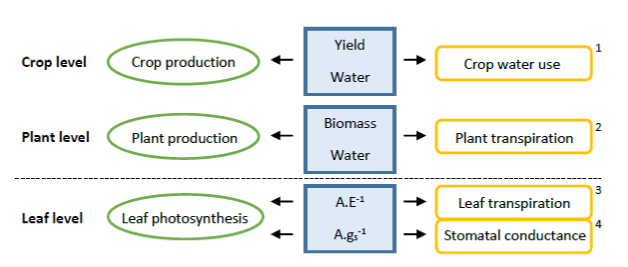
Figure 1. Different complexity levels for water use efficiency measurements, with 1: WUEyield, 2: WUEbiomass, 3: WUEinstantaneous and 4: WUEintrinsic. (adapted from Medrano et al., 2015). Above the line, the measurements were based on the whole plant, while below the line, the measurements were just based on some leaves of the plant. In this study the integrated WUE (2), using a balance, and the gas exchange WUE (3, 4) using the Li-Cor, were measured.
Integrated water use efficiency (= plant related characteristic): The biomass WUE was determined as the total shoot biomass increase divided by the total water consumed by each plant. Just before the start of the experiment 5 plants were weighted and dried to estimate the initial dry weight. This process was also carried out at the end of the experiment. The total shoot biomass increase, during the experiment, was estimated as the difference between the dry weights at the beginning and at the end of the experiment. Plant water consumed over the four weeks was estimated from the sum of the daily water consumption. Plants were daily irrigated with a known amount of water avoiding water run-off. Containers were weighted two hours after irrigation and the day after just before irrigation. Water consumption was measured as a difference between both weights, which include water evaporation and transpiration.
Gas exchange water use efficiency (= photosynthetic related characteristic): The intrinsic and instantaneous WUE were calculated based on the gas exchange measurements, as described in Section Gas exchange and chlorophyll a fluorescence measurements.
Data analysis
A one sample Kolmogorov-Smirnov test was used to assess the normality of the photosynthetic values. The Mann-Whitney test was used to compare the differences between the control and treated samples. Statistical analysis was performed with the Software Package for the Social Sciences (version 10.1 for Windows, SPSS Inc, Chicago, Ill, USA). A p value of < 0.05 was considered statistically significant.
Plant related characteristics
Growth measurements
Plant height
The height of the apple trees and tomato plants was measured at the start and the end of this research (Figure 2). Visual observations prior to these measurements presumed little differences in height between test and control samples, which is also reflected in the results. The average heights of apple trees and tomato plants measured at the start and the end were respectively, 25.40 cm, 49.00 cm, 18.54 cm and 49.30 cm. For both apple trees and tomato plants no significant differences were observed. Dieleman et al. [6] also noticed no effect of elevated CO2 on plant height of pepper plants. These pepper plants were grown in greenhouses containing an increased CO2 concentration. It was observed that the plants can adapt to being exposed for weeks to high CO2 concentrations. This adaptation led to a less efficient use of the present CO2. A possible method to avoid this adaptation was the use of pulsed CO2.
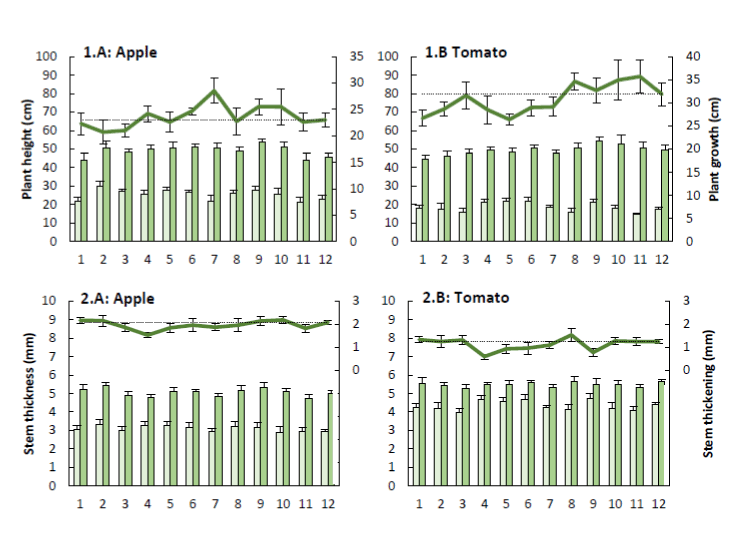
Figure 2. The primary y-axis shows both the initial ( ‾ ) plant height (+ SE; 1) and stem thickness (+ SE; 2) as well as the plant height and stem thickness after four (tomato) or five (apple) weeks ( ‾ ) of apple trees (A) and tomato plants (B) sprayed with the plant coating materials (Table 1). The differences between the initial and final thickness describe the plant growth (1) and stem thickening (2). The secondary y-axis presents the plant growth (+ SE; 1) and stem thickening (+ SE; 2) of the treated samples ( ‾ ) compared to the the control (''') (n=5).
Stem thickness
The stem thickness of the apple trees and tomato plants was also measured at the start and the end of this research (Figure 2). Visual observations prior to these measurements also suggested little difference in thickness between test and control samples, which is also reflected in the results. The average stem diameters of apple trees and tomato plants measured at the start and the end were respectively, 3.09 mm, 5.06 mm, 4.34 mm and 5.49 mm. For both apple trees and tomato plants no significant differences were observed. Dieleman et al. [6] also noticed no effect of elevated CO2 on stem thickness of pepper plants, which can be explained by CO2 adaptation of the pepper plants.
Biomass measurements
The observed results in fresh weight, dry weight and moisture content of the different apple trees and tomato plants are presented in Figure 3. In general, an increased concentration of CO2 provides a higher crop production [7]. The results of this research show that the plants treated with the products listed in Table 1 produced more biomass compared to the control sample. However, no significant differences were noticed for the dry weight and moisture content of the apple trees and tomato plants. Nevertheless, Dieleman et al. [6] did notice an effect of elevated CO2 on the dry weight of leaves and stems of pepper plants and, in general, it is said that an elevated CO2 concentration ensures a higher crop production [7].
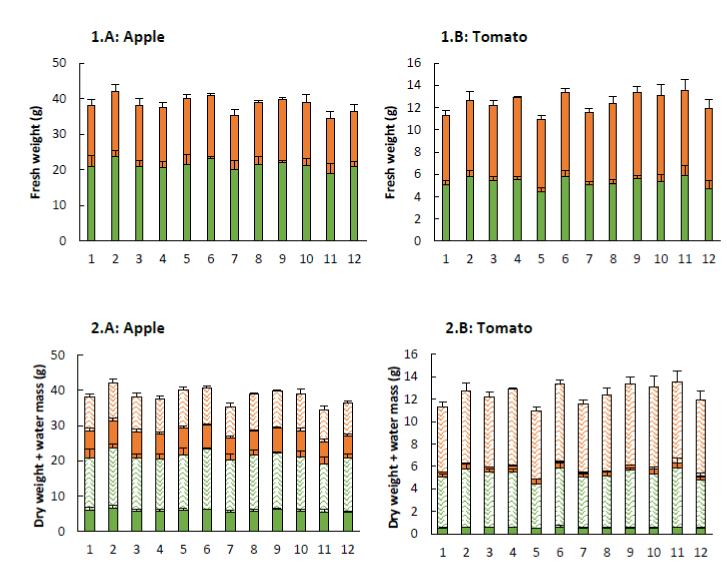
Figure 3. Fresh weight (+ SE; 1) and composition of the fresh weight (+ SE; 2) of apple trees (A) and tomato plants (B) sprayed with the plant coating materials (Table 1). The total shoot fresh weight consist of the fresh weights of leaves (1: ‾ ) and stems (1: ‾ ), and represents the dry weight (2: ‾ and ‾ ) and moisture content (2: ‾ and ‾ ) (n=5).
Table 1. Plant coating materials.
Treatment |
Material name |
Framework type code |
Trade name |
Formulation type |
Manufacturers |
1 |
Zeolite beta |
BEA |
H-BEA-25a |
NOT* |
Clariant |
2 |
Zeolite beta1 |
BEA |
a |
WP |
Fitofarmacia |
3 |
Zeolite beta2 |
BEA |
a |
WP |
Fitofarmacia |
4 |
Zeolite Y |
FAU |
CBV 720b |
NOT |
Zeolyst |
5 |
Zeolite Y1 |
FAU |
b |
WP |
Fitofarmacia |
6 |
Zeolite Y2 |
FAU |
b |
WP |
Fitofarmacia |
7 |
Zeolite A |
LTA |
Zeolite 4Ac |
NOT |
FMC |
8 |
Zeolite A3 |
LTA |
c |
SC |
Fitofarmacia |
9 |
Zeolite A4 |
LTA |
c |
WP |
Fitofarmacia |
10 |
Kaolin |
/ |
Kaolin |
NOT |
Sigma Aldrich |
11 |
Kaolin |
/ |
Surround |
WP |
Tessenderlo Group |
12 |
Control |
/ |
/ |
/ |
/ |
a, b, c The formulations were prepared based on the commercial product.
1,2,3,4 Equal adjuvant composition (confidential information).
* NOT = unformulated
Integrated water use efficiency
The cumulative water consumption and the measured integrated water use efficiency of the samples are shown in Table 2, respectively. Agronomists and crop physiologists define WUE rather from an integrative approach, i.e. the accumulated dry matter divided by the water used by the crop in the same period [8]. Comparison between instantaneous/intrinsic (Section 3.2.4) and whole-plant values sometimes reveals a clear relationship, but often not [9,10].
Table 2. Water use efficiency (WUE; + SE) of the apple trees and tomato plants treated with the plant coating materials (Table 1) based on the produced biomass (increase of dry matter) per unit of water transpired (accumulated water consumption, kg) (n=5).
|
Initial dry
weight shoot
(g) |
Final dry
weight shoot
(g) |
Increase dry weight shoot
(g) |
Cumulated water consumption
(kg) |
WUEbiomass
(g.kg-1) |
Apple |
1 |
4.11 + 0.54 |
13.32 + 1.65 |
9.21 + 1.74 |
3.21 + 0.02 |
2.87 + 0.02 |
2 |
4.11 + 0.54 |
14.32 + 1.59 |
10.21 + 1.68 |
2.79 + 0.05 |
3.66 + 0.06 |
3 |
4.11 + 0.54 |
13.11 + 1.25 |
9.00 + 1.36 |
3.14 + 0.11 |
2.88 + 0.10 |
4 |
4.11 + 0.54 |
12.86 + 0.98 |
8.75 + 1.12 |
2.76 + 0.07 |
3.18 + 0.09 |
5 |
4.11 + 0.54 |
13.66 + 0.98 |
9.55 + 1.12 |
2.88 + 0.08 |
3.33 + 0.10 |
6 |
4.11 + 0.54 |
13.27 + 0.30 |
9.16 + 0.62 |
2.88 + 0.02 |
3.18 + 0.02 |
7 |
4.11 + 0.54 |
11.69 + 1.30 |
7.58 + 1.41 |
3.31 + 0.12 |
2.30 + 0.08a |
8 |
4.11 + 0.54 |
12.76 + 0.68 |
8.65 + 0.87 |
2.92 + 0.15 |
2.99 + 0.16 |
9 |
4.11 + 0.54 |
13.58 + 0.48 |
9.47 + 0.72 |
3.51 + 0.18 |
2.72 + 0.12a |
10 |
4.11 + 0.54 |
12.89 + 1.56 |
8.78 + 1.65 |
3.28 + 0.18 |
2.71 + 0.14a |
11 |
4.11 + 0.54 |
11.76 + 1.60 |
7.65 + 1.69 |
2.72 + 0.11 |
2.83 + 0.11a |
12 |
4.11 + 0.54 |
11.66 + 0.79 |
7.55 + 0.95 |
3.06 + 0.16 |
2.49 + 0.12a |
Tomato |
1 |
0.23 + 0.02 |
0.90 + 0.11 |
0.67 + 0.12 |
1.33 + 0.01 |
0.51 + 0.00 |
2 |
0.23 + 0.02 |
1.02 + 0.11 |
0.79 + 0.11 |
1.35 + 0.00 |
0.58 + 0.00 |
3 |
0.23 + 0.02 |
0.99 + 0.09 |
0.76 + 0.09 |
1.35 + 0.01 |
0.56 + 0.00 |
4 |
0.23 + 0.02 |
1.05 + 0.07 |
0.82 + 0.07 |
1.21 + 0.01 |
0.68 + 0.00 |
5 |
0.23 + 0.02 |
0.90 + 0.06 |
0.67 + 0.06 |
1.29 + 0.02 |
0.52 + 0.00 |
6 |
0.23 + 0.02 |
1.18 + 0.17 |
0.95 + 0.17 |
1.32 + 0.02 |
0.73 + 0.00 |
7 |
0.23 + 0.02 |
0.89 + 0.10 |
0.66 + 0.10 |
1.21 + 0.01 |
0.55 + 0.00 |
8 |
0.23 + 0.02 |
0.92 + 0.07 |
0.69 + 0.07 |
1.34 v 0.03 |
0.51 + 0.00 |
9 |
0.23 + 0.02 |
0.97 + 0.05 |
0.74 + 0.05 |
1.35 + 0.01 |
0.55 + 0.00 |
10 |
0.23 + 0.02 |
0.92 + 0.14 |
0.69 + 0.14 |
1.28 + 0.02 |
0.54 + 0.00 |
11 |
0.23 + 0.02 |
0.94 + 0.07 |
0.71 + 0.07 |
1.30 + 0.03 |
0.55 + 0.00 |
12 |
0.23 + 0.02 |
0.85 + 0.09 |
0.62 + 0.09 |
1.34 + 0.01 |
0.46 + 0.00a |
a No significant differences between sample and positive control treatments (12).
Both, for the apple trees and tomato plants, significant differences were observed between the treated and control samples. This is mainly due to the higher dry weight values observed in the treated plants.
Photosynthetic related characteristics
Photosynthesis light response curve: Photosynthesis increases with higher CO2 concentrations up to a saturation point, beyond which photosynthesis remains constant [11]. In order to determine this saturation point, a total of 36 light response curves were generated on apple trees and tomato plants for all the treatments listed in Table 1. A representative light response curve for both plants is shown in Figure 4. Apple and tomato leaf photosynthesis is of the C3 type with a hyperbolic light response that typically saturates at 500-1000 µmol.m-2.s-1. The light compensation point, i.e. the light level for which the net CO2 exchange is zero and respiration equals photosynthesis, is about 15 µmol.m-2.s-1 for both plants. The maximum mean photosynthetic rates of apple trees and tomato plants were 8 and 6 µmol.m-2.s-1, respectively.
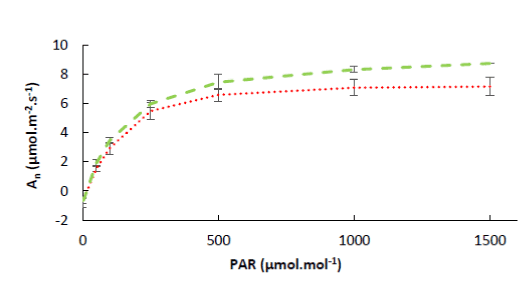
Figure 4. The average photosynthesis light response curve of apple trees (‾ ‾) and tomato plants (.....) (n=36).
Based on these results it was concluded that the tested apple trees and tomato plants were in a healthy state. Good rates of photosynthesis per unit leaf area for healthy exposed apple leaves vary from 15 µmol.m-2.s-1 in early summer to about 8 µmol.m-2.s-1 at harvest time [12-14].
Moreover, the maximum photosynthetic rate was also about 8 µmol.m-2.s-1 in healthy tomato plants [15]. Similar results were found by Vu et al. [16] and Machado et al. [17].
Light saturated net photosynthesis: The values of net photosynthesis (An) are summarized in Figure 5. A significant increase of net photosynthetic rate was observed for the treated apple trees compared to the control. This effect was noticed for the kaolin powder and most zeolites. However, there were no significant differences among the zeolite/kaolin treatments. A trend towards increased photosynthesis was noticed during the first two weeks after one treatment. Afterwards, photosynthesis started to decrease until it reached its initial value.
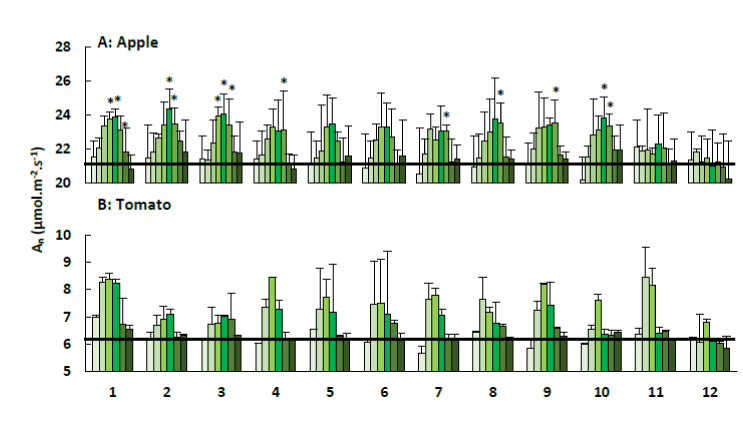
Figure 5. Net photosynthesis (An; + SE) of apple trees (A) and tomato plants (B) treated with the plant coating materials (Table 1) as function of time. Asterisks indicate significant differences (P < 0.05) in An between sample and control treatments at a certain time examination point. The black line indicates the average An of the control treatments and the different colours indicate the different measurements during 4 weeks (n=5).
In contrast with these findings, no significant differences in net photosynthetic rate were noticed for the treated tomato plants compared to the control ones. However, a similar trend, as observed within the apple trees, was seen. Photosynthesis was increased during the first weeks for all sample treatments with the exception of the control, followed by a decrease until it reached its original rate.
In order to explain these findings, the various abiotic factors that influence the photosynthesis are taken into account. Photosynthesis responds to changes in many environmental parameters, such as light, temperature and CO2 concentrations [18,19]. These three main factors, also called the limiting factors, play a crucial role on leaf level controlling the stomatal aperture [19-21].
Light is directly involved in the photolysis of water and excitation of chlorophyll molecules. Indirectly, it controls stomatal movement, leading to diffusion of CO2. As light intensity increases, photosynthesis increases up to a certain limit. At very high light intensity, photosynthesis is inhibited due to other factors. Light intensity requirement varies with the nature of the plant. However, photosynthesis can also increase in plants exposed to weak light for a longer period [22]. This depends on the weakness of the light and the exact exposure duration. In this research photosynthesis was measured at a constant light intensity of 1500 µmol.m-2.s-1. Therefore light intensity will not affect the observed results.
Additionally, temperature directly influences the rate of photosynthesis by stimulating the rates of activity of photosynthetic enzymes and the electron transport chain. At low temperature the rate of photosynthesis increases proportionally with the temperature until it reaches an optimum. Higher temperatures reduce photosynthesis [21]. An increase in air temperature indirectly increases leaf temperature, which elevates vapour pressure deficit (VPD) and stimulates water loss by transpiration [11]. This can also be seen in the results displayed in Figures 8 and 9. Especially the apple trees showed a linear relation between the air temperature and the rate of photosynthesis. Additionally, these figures clearly point out that an increase in air temperature leads to an increase in leaf temperature. However, a higher leaf-to-air temperature was observed for the tomato plants.
As long as water is not the limiting factor, plants will diminish their leaf temperature by transpirational cooling [23,24]. As evaporative demand increases, stomata tend to close to reduce the rate of water loss, resulting in reduced photosynthesis [25]. Overall, the stomata are regulated to maximize carbon gain and minimize water loss [26]. Figure 6 illustrates the measured transpiration rates for the apple trees and tomato plants, observed when measuring the net photosynthesis.
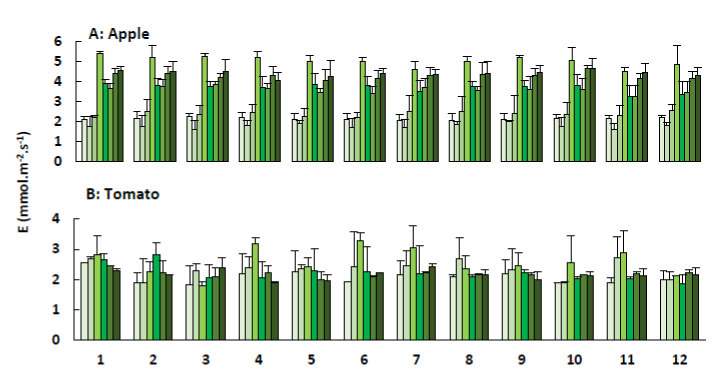
Figure 6. Transpiration (E; + SE) of apple trees (A) and tomato plants (B) treated with the plant coating materials (Table 1) as function of time. The different colours indicate the different measurements during 4 weeks (n=5).
For both species, the observed transpiration rates were within the range reported by Saenger [27]. According to the latter, transpiration rates vary among species, but range from 0.5 to 6.69 mmol.m-2.s-1. The lower transpiration rates of the tomato plants can explain the higher leaf-to-air temperature that was observed in Figure 9. For the apple trees, it can be noticed that the transpiration rates increased when the air and leaf temperature increased. In contrast, the tomato plants were grown at a constant temperature of 26°C, what resulted in a constant transpiration of the leaves.
Furthermore, the transpiration rates of the apple trees showed very low values during the first two weeks compared to the subsequent measurements. Data on relative humidity, illustrated in Figure 8, confirmed a defect of the measuring device. The first three measurements of the relative humidity were too low, indicating that something was wrong.
Normally, higher temperatures reduce relative humidity, what leads to an increase in vapour pressure deficit (VPD). This is also illustrated in Figures 8 and 9. Consequentially, the stoma will tend to close what will reduce photosynthesis and transpiration. However, in some plants, stomata remain open at high temperature even when photosynthesis is significantly reduced and vapour pressure deficit is very high [28,29]. This response has been documented in only a few species and is not well understood, although it appears to be a strategy that uses transpirational cooling of the leaf to avoid or minimize heat stress.
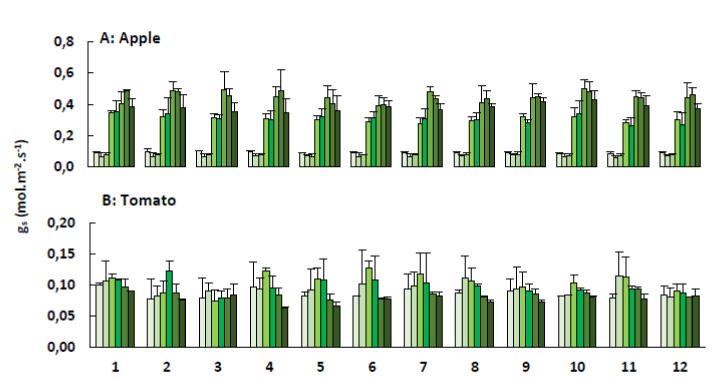
Figure 7. Stomatal conductance (gs; + SE) of apple trees (A) and tomato plants (B) treated with the plant coating materials (Table 1) as function of time. The different colours indicate the different measurements during 4 weeks (n=5).
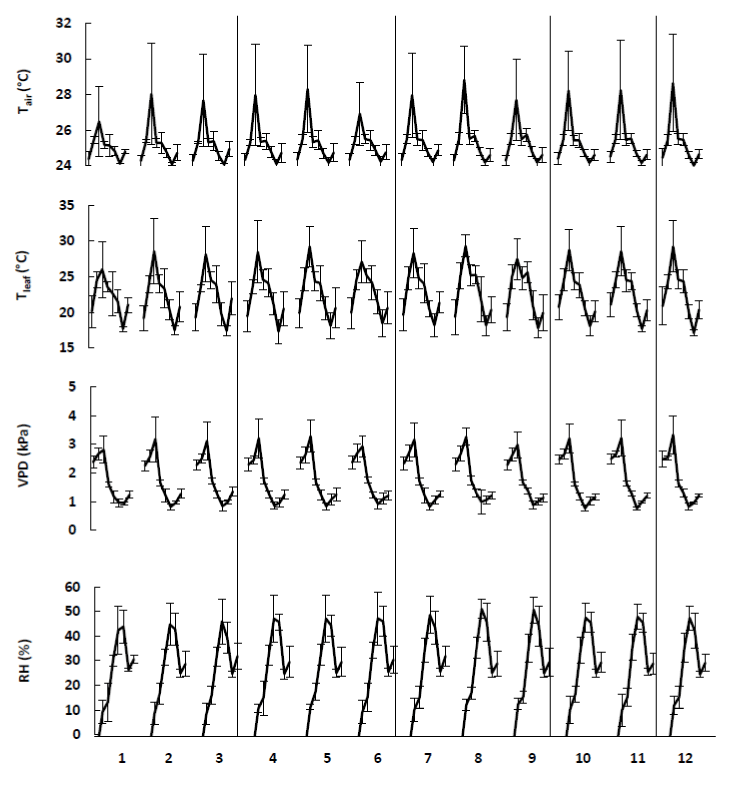
Figure 8. The ambient parameters, i.e., air temperature (Tair), leaf temperature (Tleaf), vapour pressure difference (VPD) and relative humidity (RH), involved during the measurements on treated apple trees (Table 1). The different data points per treatment indicate the mean (+ SE) of different measurements during 4 weeks (n=5).
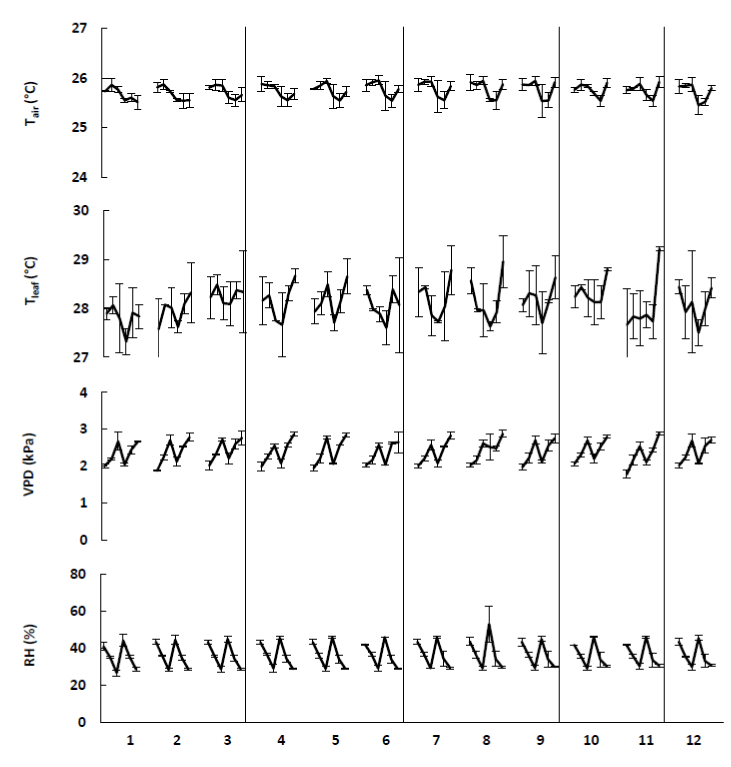
Figure 9. The ambient parameters, i.e., air temperature (Tair), leaf temperature (Tleaf), vapour pressure difference (VPD) and relative humidity (RH), involved during the measurements on treated tomato plants (Table 1). The different data points per treatment indicate the mean (+ SE) of different measurements during 4 weeks (n=5).
The density, size and degree of opening of the stomata have an impact on the rate of photosynthesis and transpiration. This rate of passage is controlled by stomatal conductance. Under most environmental conditions, a close correlation between photosynthesis and stomatal conductance is expected. Stomata close to reduce water loss, resulting in reduced photosynthesis and transpiration. Alternatively, if biochemical limitations reduce photosynthesis, intercellular [CO2] increases, resulting in partial stomatal closure. Figure 7 represents the stomatal conductance for the apple trees and tomato plants, observed during the measurement of the net photosynthesis.
Similar patterns in stomatal conductance and net photosynthesis were observed. This linear relation between gs and An was also confirmed by Yu et al. [30], who measured responses of photosynthesis and stomatal conductance of winter wheat to changes in light intensities. The stomatal conductance of the apple trees also showed very low values during the first two weeks compared to the subsequent measurements. Generally seen, the apple trees and tomato plants showed an increase in An and gs during the first measurements. An increase of CO2 concentration due to the adsorption of CO2 molecules on the zeolites can be a possible explanation. After a while the elevated CO2 concentration reduces gs, which leads to a decrease in An. This latter has also been observed in previous research [31-34]. However, the effect of elevated CO2 concentration on An does not always match the theoretical expectations [32,33,35,36]. The effect is variable and subjected to environmental feedback [31,37-45].
A relation between stomatal conductance and transpiration was also noticed. This can be linked to the interaction of climatic factors, i.e. temperature and relative humidity, as discussed before. An experiment conducted with kaolin instead of zeolites showed a similar increase in gs, An and E of the treated leaves compared to control ones [46].
Chlorophyll a fluorescence: Finally, another potential limiting factor is chlorophyll content, which is qualitatively obtained as “leaf greenness”. Emission measurements of chlorophyll fluorescence has been used as a tool to understand the behavior of plant growth. Water stress and cold stress in plants affect the normal operation of photosynthesis and these can also been detected by chlorophyll fluorescence measurements [47,48].
The greater the value of Fv’/Fm’, the greater the maximum efficiency of the PSII photochemistry [49]. Values obtained for the apple trees and tomato plants varied between 0.6-0.7 and 0.4-0.5, respectively (Figure 10). These values indicate that the examined apple trees and tomato plants were healthy plants without stress. Mir et al. [50] measured chlorophyll fluorescence from apple leaves with surface defects. For apple leaves with CO2 injury, healthy regions had Fv’/Fm’ of approximately 0.75 and decreased as low as 0.33 in the CO2 damaged region. Loukehaich et al. [51] found that healty regions of tomato leaves had Fv’/Fm’ of approximately 0.4-0.6.
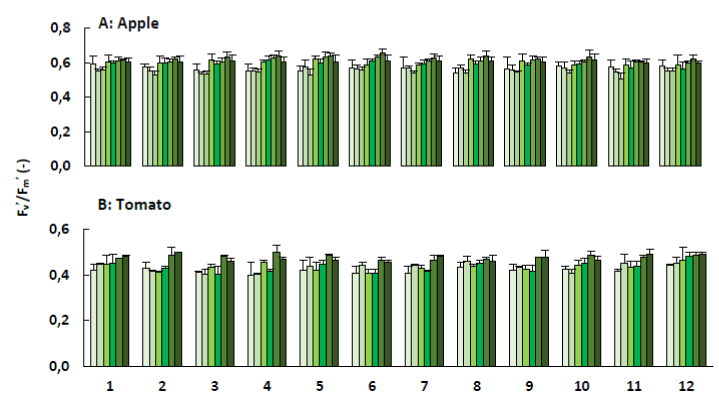
Figure 10. Chlorophyll a fluorescence (Fv'/Fm'; + SE) of apple trees (A) and tomato plants (B) treated with the plant coating materials (Table 1) as function of time. The different colours indicate the different measurements during 4 weeks (n=5).
Gas exchange water use efficiency: As mentioned in Section water use efficiency, gas exchange WUE includes WUEinstantaneous and WUEintrinsic. The results obtained for the apple trees and tomato plants are presented in Figure 11. From a methodological viewpoint, WUEinstantaneous and WUEintrinsic are similar, but WUEinstantaneous varies with atmospheric conditions (temperature and humidity) which affect vapour pressure deficit (VPD). Since this is not the case for WUEintrinsic, this parameter gives a better approach of WUE [10].
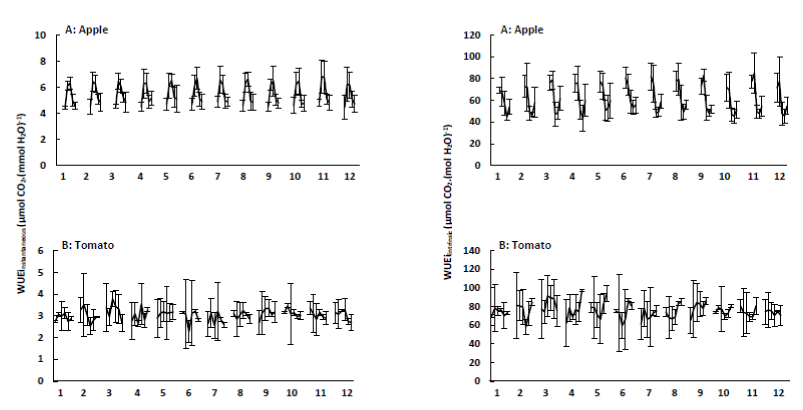
Figure 11. Instantaneous water use efficiency (WUEinstantaneous or An.E-1; + SE) and intrinsic water use efficiency (WUEintrinsic or An.gs-1; + SE) of apple trees (A) and tomato plants (B) treated with the plant coating materials (Table 1) as function of time. The different data points per treatment indicate the different measurements during 4 weeks (n=5).
As a result of the constant difference in water vapour concentration between the leaf and the air, transpiration and stomatal conductance are linear related [52]. An improved and higher WUE can be achieved either through lower stomatal conductance and transpiration, caused by stomatal closure, or higher photosynthetic capacity or a combination of both [32,53,54]. Therefore, the first three data points of the apple trees were not taken into account. In Figure 11, it can be seen that WUEintrinsic decreases when stomatal conductance and transpiration increases and vice versa. However, one can have a high stomatal conductance, but plant transpiration can still be low, because incoming solar radiation and water vapour deficit are for instance reduced.
Finally, WUE of treated leaves was usually similar to control leaves, suggesting that zeolites and kaolin did not increase water consumption without increasing CO2 fixation [55]. This effect was also observed by Maletsika and Nanos [46], when using kaolin on olive trees. Steiman and Bittenbender [56] also observed that photosynthesis in kaolin leaves was significantly greater but WUE was not.
In general, zeolites have some effects on plant and photosynthetic related characteristics. The measured chlorophyll a fluorescence indicated that all tested plants were healthy and free from stress. Plant-related characteristics including stem height and thickness were not significantly influenced by the zeolite/kaolin treatments. Dry weight of the apple trees and tomato plants tended to increase, but this was not significantly different from the control. However, the increase had a positive influence on the measured integrated water use efficiency, which significantly differs from the control. Zeolites do not increase the water consumption of the whole plant, but increase the water uptake of individual leaves. Photosynthetic parameters also improved in the zeolite treatments. Photosynthesis of apple trees increased significantly, which was not the case for the tomato plants. The limiting and ambient factors showed no striking effects.
All these effects were observed during four weeks. It is noteworthy that the overall results increased during the first two weeks followed by a decrease during the last two weeks. This indicates that multiple treatments of the plants are required. This will be necessary for obtaining a better photosynthetic effect of the treated apple trees and tomato plants compared to the control.
The authors gratefully acknowledge the funding of this work, associated with the ECO-ZEO project, by the European Commission under the 7th Framework Programme (Project Number: 282865, www.ecozeo.eu).
- Jifon JL, Syvertsen JP (2003) Kaolin particle film applications can increase photosynthesis and water use efficiency of 'ruby red' grapefruit leaves. J Am Soc Hortic Sci 128: 107-112.
- Glenn DM, Puterka GJ (2005) Particle films: a new technology for agriculture, In: Janick, J (Ed.) John Wiley & Sons Inc., Hoboken, New Jersey, pp. 1-44.
- Rosati A, Metcalf SG, Buchner RP, Fulton AE, Lampinen BD (2007) Effects of kaolin application on light absorption and distribution, radiation, use efficiency and photosynthesis of almond and walnut canopies. Ann Bot 99: 255-263. [Crossref]
- Reddy P (2012) Disguising the leaf surface, In: Reddy P (Ed.) Recent advances in crop protection. Springer, New York, USA, pp. 91-102.
- Kaszab Z (2008) Kaolin-based particle films for arthropod control, In: Capinera JL (Ed.) Encyclopedia of entomology. Springer, Heidelberg, Germany, pp. 2075-2080.
- Dieleman JA, Meinen E, Elings A, Uenk D, Uittien JJ, et al. (2003) Effecten van langdurig hoog CO2 op groei en fotosynthese bij paprika. In: Eindrapport van het project ‘Efficiënt gebruik van CO2’, Plant Research International, Wageningen, The Netherlands.
- Kimball BA (1986) Influence of elevated CO2 on crop yield, in: Enoch, H.Z. and Kimball, B.A. (Eds.), Carbon dioxide enrichment of greenhouse crops. CRC Press Inc., Boca Raton, Florida, pp. 105-115.
- Abbate PE, Dardanelli JL, Cantarero MG, Maturano M, Melchiori RJM, et al. (2004) Climatic and water availability effects on water-use efficiency in wheat. Crop Sci 44: 474-483.
- Flexas J, Galmés J, Gallé A, Gulías J, Pou A, et al. (2010) Improving water use efficiency in grapevines: potential physiological targets for biotechnological improvement. Aust J Grape Wine Res 161: 106-121.
- Medrano H, Tomas M, Martorell S, Flexas J, Hernandez E, et al. (2015) From leaf to whole-plant water use efficiency (WUE) in complex canopies: limitations of leaf WUE as a selection target. Crop J 3: 220-228.
- Schulze E-D, Beck E, Müller-Hohenstein K (2005) Plant Ecology, Springer, Berlin, Germany.
- Lakso AN (1994) Chapter 2: Apple, In: Schaffer B, Anderson PC (Eds.) Handbook of environmental physiology of fruit crops. CRC Press Inc., Boca Raton, Florida, pp. 3-42.
- Wünsche JN, Lakso AN, Robinson T, Lenz F, Denning SS (1996) The bases of productivity in apple production systems: the role of light interception by different shoot types. J Amer Soc Hort Sci 121: 886-893.
- Greer DH (2015) Photon flux density and temperature-dependent responses of photosynthesis and) photosystem II performance of apple leaves grown in field conditions. Funct Plant Biol 42: 782-791.
- Habermann G, Machado EC, Rodrigues JD, Medina CL (2003) CO2 assimilation, photosynthetic light response curves, and water relations of Pêra sweet orange plants infected with Xylela fastidiosa. Braz J Plant Physiol 15: 79-87.
- Vu JCV, Yelenosky G, Bausher MG (1986) CO2 exchange rate, stomatal conductance, and transpiration in attached leaves of ‘Valencia’ orange. Hort Science 21: 143-144.
- Machado EC, Quaggio JA, Lagôa AMMA, Ticelli M, Furlani PR (1994) Trocas gasosas e relações hídricas em laranjeiras com clorose variegada dos citros. Rev Bras Fisiol Veg 6: 53-57.
- Schroeder JI, Allen GJ, Hugouvieux V, Kwak JM, Waner D (2001) Guard cell signal transduction. Annu Rev Plant Physiol Plant Mol Biol 52: 627-658. [Crossref]
- Lombardozzi D, Levis S, Bonan G, Sparks JP (2012) Predicting photosynthesis and transpiration responses to ozone: decoupling modeled photosynthesis and stomatal conductance. Biogeosciences 9: 3113-3130.
- Tuzet A, Perrier A, Leaning R (2003) A coupled model of stomatal conductance, photosynthesis and transpiration. Plant Cell Environ 26: 1097-1116.
- Toole G, Toole S (2004) Part 2: Photosynthesis, in: Toole, G. and Toole, S. (Eds.), Essential A2 biology for OCR. Nelson Thornes, Cheltenham, UK, pp. 19-31.
- Sinha RK (2004) Photosynthesis, In: Sinha RK (Ed.) Modern plant physiology. Alpha Science International, Pangbourne, UK, pp. 176-255.
- Salvucci ME, Crafts-Brandner SJ (2004) Inhibition of photosynthesis by heat stress: the activation state of Rubisco as a limiting factor in photosynthesis. Physiol Plant 120: 179-186. [Crossref]
- Damour G, Simonneau T, Cochard H, Urban L (2010) An overview of models of stomatal conductance at the leaf level. Plant Cell Environ 33: 1419-1438. [Crossref]
- Lloyd J, Farquhar GD (2008) Effects of rising temperatures and [CO2] on the physiology of tropical forest trees. Philos Trans R Soc Lond B Biol Sci 363: 1811-1817. [Crossref]
- Bonan G (2002) Chapter 9: Leaves and plants, in: Bonan, G. (Ed.), Ecologial climatology. University Press, Cambridge, UK, pp. 1-49.
- Saenger P (2002). Mangrove ecology silviculture and conservation, Kluwer Academic Publishers, Dordrecht, the Netherlands.
- Schulze ED, Lange OL, Buschbom U, Kappen L, Evenari M (1972) Stomatal response to changes in humidity in plants growing in the desert. Planta 108: 259-270. [Crossref]
- Lu P, Muller WJ and Chacko EK (2000) Spatial variations in xylem sap flux density in the trunk of orchard-grown, mature mango trees under changing soil water conditions. Tree Physiol 20: 683-692.
- Yu Q, Zhang Y, Liu Y, Shi P (2004) Simulation of the stomatal conductance of winter wheat in response to light, temperature and CO2 changes. Ann Bot 93: 435-441. [Crossref]
- Medlyn BE, Barton CVM, Broadmeadow MSJ, Ceulemans R, De Angelis P, et al. (2001) Stomatal conductance of forest species after long-term exposure to elevated CO2 concentration: a synthesis. New Phytol 149: 247-264.
- Long SP, Ainsworth EA, Rogers A, Ort DR (2004) Rising atmospheric carbon dioxide: plants FACE the future. Annu Rev Plant Biol 55: 591-628. [Crossref]
- Ainsworth EA, Long SP (2005) What have we learned from 15 years of free-air CO2 enrichment (FACE)? A meta-analytic review of the responses of photosynthesis, canopy properties and plant production to rising CO2. New Phytol 165: 351-372. [Crossref]
- Ainsworth EA, Rogers A (2007) The response of photosynthesis and stomatal conductance to rising CO2: mechanisms and environmental interactions. Plant Cell Environ 30: 258-270. [Crossref]
- Nowak RS, Ellsworth DS, Smith SD (2004) Functional responses of plants to elevated atmospheric CO2 - do photosynthetic and productivity data from FACE experiments support early predictions? New Phytol 162: 253-280.
- Rogers A, Ainsworth EA, Kammann C (2006) Perspectives of the future of free air CO2 enrichment studies, in: Nösberger J, Long SP, Norby RJ, Stitt M, Hendrey GR, Blum H (Eds.) Managed ecosystems and CO2: case studies, processes and perspectives. Springer, Heidelberg, Germany, pp. 431-450.
- Ellsworth DS (1999) CO2 enrichment in a maturing pine forest: are CO2 exchange and water status in the canopy affected? Plant Cell Environ 22: 461-472.
- Gunderson CA, Sholtis JD, Wullshleger SD, Tissue DT, Hanson PJ, et al. (2002) Environmental and stomatal control of photosynthetic enhancement in the canopy of a sweetgum (Liquidambar styraciflua L.) plantation during 3 years of CO2 enrichment. Plant Cell Environ 25: 379-393.
- Wullschleger SD, Tschaplinski TJ, Norby RJ (2002) Plant water relations at elevated CO2 - implications for water-limited environments. Plant Cell Environ 25: 319-331. [Crossref]
- Naumburg E, Housman DC, Huxman TE, Charlet TN, Loik ME, et al. (2003) Photosynthetic responses of Mojave Desert shrubs to free air CO2 enrichment are greatest during wet years. Global Change Biol 9: 276-285.
- Bunce JA (2004) Carbon dioxide effects on stomatal responses to the environment and water use by crops under field conditions. Oecol 140: 1-10. [Crossref]
- Herrick JD, Maherali H, Thomas RB (2004) Reduced stomatal conductance in sweetgum (Liquidambar styraciflua) sustained over long-term CO2 enrichment. New Phytol 162: 387-396.
- Marchi S, Tognetti R, Vaccari FP, Lanini M, Kaligaric M, et al. (2004) Physiological and morphological responses of grassland species to elevated atmospheric CO2 concentrations in FACE-systems and natural CO2 springs. Funct Plant Biol 31: 181-194.
- Morgan JA, Pataki DE, Körner C, Clark H, Del Grosso SJ, et al. (2004) Water relations in grassland and desert ecosystems exposed to elevated atmospheric CO2. Oecol 140: 11-25. [Crossref]
- Leakey ADB, Bernacchi CJ, Ort DR, Long SP (2006) Longterm growth of soybean at elevated [CO2] does not cause acclimation of stomatal conductance under fully open-air conditions. Plant Cell Environ 29: 1794-1800.
- Maletsika PA, Nanos GD (2015) Leaf and fruit responses to kaolin particle film applied onto mature olive trees. J Biol Agric Healthc 5: 17-27.
- Khanizadeh S, DeEll J, Hakam N (2000) Use of chlorophyll fluorescence to evaluate chilling tolerance in strawberry plants. Acta Hortic 538: 453-456.
- Rennie TJ, Vigneault C, Raghavan GSV, DeEll JR (2001) Effects of pressure reduction rate on vacuum cooled lettuce quality during storage. Can Biosyst Eng 43: 339-343.
- Olvera-Gonzalez E, Alaniz-Lumbrerass D, Ivanov-Tsonchev R, Villa-Hernandez J, de la Rosa-Vargas I, et al. (2013) Chlorophyll fluorescence emission of tomato plants as a response to pulsed light based LEDs. Plant Growth Regul 69: 117-123.
- Mir NA, Wendorf M, Perez R, Beaudry RM (1998) Chlorophyll fluorescence as affected by some superficial defects in stored apples. J Hortic Sci Biotechnol 73: 846-850.
- Loukehaich R, Elyachioui M, Belhabib N, Douira A (2011) Identifying multiple physiological responses associated with salinity-tolerance for evaluating three tomato cultivars selected from Moroccan territory. J Anim Plant Sci 10: 1219-1231.
- Lambers H, Chapin S, Pons TL (2008) Photosynthesis, respiration and long-distance transport, in: Lambers H, Chapin S, Pons TL (Eds.) Plant physiological ecology. Springer, Berlin, Germany, pp. 11-162.
- Condon AG, Richards RA, Rebetzke GJ, Farquhar GD (2002) Improving intrinsic water-use efficiency and crop yield. Crop Sci 42: 122-131. [Crossref]
- Ashraf M, Bashir A (2003) Relationship of photosynthetic capacity at the vegetative stage and during grain yield of two hexaploid wheat (triticum aestivum l.) cultivars differing in yield. Eur J Agron 19: 277-287.
- Chaves MM, Osorio J, Pereira JS (2004) Water use efficiency and photosynthesis, in: Bacon M (Ed.) Water use efficiency in plant biology. CRC Press LLC, Boca Raton, Florida, pp. 42-74.
- Steiman SR, Bittenbender HC (2007) Analysis of kaolin particle film use and its application on coffee. Hort Science 42: 1605-1608.