Cancer is a group of diseases that involves abnormal cell growth, resulting from genetic perturbations in signaling mechanisms. High resolution RNAseq and microarray assays enable the evaluation of the transcriptional activity of high number of signaling molecules. Furthermore, many signaling pathways are described in publically available databases. Today’s challenge lies in the connection of signaling pathways and signaling data to produce predictive models which have the power to validate and identify targets in disease treatment. Curating networks manually can be exhaustive handiwork. We designed an ensemble approach of gene set enrichment on seven pathway databases. It generates a basic gene set mapping of the complex input data on comprehensive pathways. Using two publically available protein-protein interaction databases, the novel algorithm automatically reconstructs a comprehensive biological system representation from these mappings. The reconstruction was based on a newly shortest path algorithm. Using a microarray data set from hepatocellular cancer cells as input, a network with well-known cancer signaling mechanisms was derived. Furthermore, nodes accounting for hormone signaling were found as being modified in liver cancer that can be used as future research targets. Two recent publically available networks were adequately inferred when testing the method to reconstruct manually curated signaling networks. Finally, our method shows that integration of raw data and publically available knowledge expeditiously generates convenient and analyzable network views.
Up-to-date strategies in cancer treatment have to be aware of different alterations of cancerogenous systems in comparison to healthy cells. These alterations were collected in the hallmarks of cancer [1]. Targeted therapies are stratified to treat specific alterations and provide better treatment than shotgun chemotherapy [2]. Today, gene expression and protein profiles can be used to associate therapy outcome and treatment prediction for an individual patient [3]. Bioinformatics methods allow building a connection between molecular profiles and possible treatment targets [4]. Nevertheless, modeling of cancer treatment targets is mainly performed by knowledge-based approaches up to now. Manually setting up models by knowing signaling networks revealed many models that can predict therapy outcome [5-7]. Deriving models for a specific patient profile demands plenty of biological expertise and literature research. Finding these mechanistic descriptions of cancer disease is a valid procedure to find future treatment targets and already resulted in the successful discovery of new treatments [8,9].
The complexity in building such models has two components. First the signaling pathway encountered has to be understood. Second a mathematical or graphical representation has to be found that exhibits the functionality of the pathway. This approach can take several years. Nevertheless, Research society created large databases including signaling and pathway descriptions [10], protein-protein interactions [11] and mathematical models [12]. These are already used to put high-throughput and large scale data sets into a context that can be interpreted by the researcher in an adequate amount of time. Well known algorithms perform pathway or gene set enrichment [4] via web-based tools as provided e.g. by the GO consortium [13] or Babelomics [14]. On a desktop basis, the Cytoscape toolkits enabled the same [15,16].
These tools mostly function on a single database such as the Gene Ontology tree or the Reactome pathway database [17]. An up-to-date method for analyzing microarrays is gene set enrichment [4]. It has a higher consistency of prediction in contrast to other pathway methods such as Fishers exact test [18]. Using this method, the user has to decide for one database to search in for pathways. The results for one database have to be interpreted on its own and the same procedure has to be solved as many times as the number of databases the user wants to use. Including more databases can overcome missing pathways or wrong annotations in a certain database. In contrast to most tools, the web based tool DAVID can incorporate multiple databases [19]. This feature obliterates the aforementioned major drawback of most tools. Using the mentioned methods, researchers can get an idea of the pathways role in the system and differently annotate data. One of the major drawbacks of using DAVID for analysis of nowadays data is the outdated information stored in its database. Most of the signaling databases were downloaded in September 2009 and had several updates since then. This drawback can influence results dramtically [20].
These data mapping tools are mainly sufficient for a fast interpretation of large scale data sets. Systems biology is based on a more “systematic” approach. Systems are networks build on different compounds [20]. In biological networks knowledge about these compounds can mostly be generated from investigating their connections. These connections can change over time, due to external stimuli or genetic alterations. Though the networks are not rigid and have to be constructed for the right purpose and conditions.
This can be done by manually constructing networks from literature or using algorithms for automated network reconstruction. Two ways exist to automatically reconstruct those biological networks from data. The first consists in searching networks that were already constructed in pathway databases. This approach is close to pathway enrichment or gene set enrichment. Several easy to use well-performing algorithms have been published to build and investigate systems biological networks [21-23]. Further on, we will call these methods ‘knowledge-based approaches’. The other way is by generating novel networks from correlations in the data [24-26]. These will be called ‘data-driven approaches’. Several data-driven approaches were integrated into the STRING database [27], which derives information from protein-protein interaction databases [11]. STRING is a meta-database that consists in a mixture between knowledge-based and data-driven methods, which can be described as an ensemble approach. This ensemble approach shows a high performance on finding signaling networks in poorly annotated organisms [28].
The novel integration of data-driven, pathway-related and knowledge-based methods in the presented work generates a systematic understanding of poorly interpretable large-scale data. The developed multi-database gene set enrichment is able to find the most abundant pathways in a data set. It can use generic data formats and background databases can easily be updated to up-to pathway information. Combined with a network reconstruction method on protein-protein interaction databases, it reconstructs a comprehensive representation of a biological system. Testing the method with data sets constructed from manually curated networks shows that the integrative approach can mainly reconstruct these networks. There are two key drivers for the performance of this approach. Using ensemble databases and a generic input format enables keeping background knowledge up-to-date. Avoiding manual curation by integrating database knowledge to the network reconstruction generates a huge speed up. The tool can be easily integrated into R [29] environments and the exported networks can be used as SBML [30] models or represented in Cytoscape [16].
Storing data sets
A data set R list object was constructed to store data sets for easy handling of data with multiple identifiers or mappings. The structure can be seen in Figure 1.
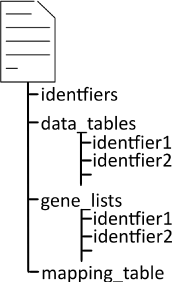
Figure 1. Data structure for storing microarray datasets. To store microarray datasets with multiple identifiers for the genes the structure contains a list of all available identifiers. The data_tables list contains the expression data. The first column included the ID of each gene. The name of the table refers to the specific identifier. An unlimited number of tables can be listed under data_tables. Gene_lists contain the first columns of the data_tables. The mapping table contains a table with all identifiers that are encountered in the gene_lists. Each line contains an identifier and in the corresponding columns the equivalents in other identifier formats can be found. It is used to convert annotations in all stages of the process. These were manually curated by using the Uniprot web interface29 for small data sets (< 25 genes).
Input data sets
This section describes the three input data sets that were used within analysis of this study. One set represents real microarray data while the two other sets represent artificial test data used to validate the function of the algorithm.
Differentially expressed genes in liver cancer: The Gene Expression Omnibus (GEO) [31,32] accession data sets for three cell lines were taken from GEO accession GSE35818 [33]. The following mentioned analysis was performed by Richard S Finn and colleagues. Microarrays were performed to show differences in gene expression between cancer and healthy liver tissue. Cancer cell lines were tested as samples against a liver cell mixture (LiverCLRefMixB1). The whole RNA was extracted and reverse transcribed by Finn et al. (not published). Each of the microarrays was performed by Agilent-014850 Whole Human Genome Microarray 4 × 44K with coloring Cy5 for cell lines and Cy3 for LiverCLRefMixB1. We selected three cell lines out of the 20 cell lines of the data set to keep the amount of data manageable by manual work. The cell lines included were three liver cancer cell lines Hep3B (GSM875690), Huh7 (GSM875693) and HepG2 (GSM875691). Raw microarray data including 14,000 was stored.
Test set of a small signaling network reconstruction by Klinger et al. [34]: The publication of Klinger et al. [34] showed that it is possible to predict cancer co-treatment therapies by small interaction networks. Their signaling network consisted of 14 nodes and 17 edges. These 14 nodes represent a well-known EGFR pathway for interleukin signaling in cancer [34]. Of the nodes 2 were ligands. 12 nodes represented intracellular genes. 8 nodes were measured after perturbing 4 representing receptors by inhibitors in biological experiments. We constructed a data set including all 14 nodes and additional 48 randomly selected genes being 4 times the number of intracellular genes to simulate noise in the data. All of these were translated from Symbols to Entrez Gene IDs and Uniprot identifiers. Data sets were built in triplicates to simulate standard measurement conditions. The 14 genes were differentially expressed and had in the relative expression values between 24 and 26 in reference sets. In the perturbed (diseased simulating) data set their values ranged between 5 and 6 with some noise added. The values of the 48 non-differentially expressed genes were set between 12 and 14 in both the reference and the diseased data set. The data set was stored in the R package data as described in 6.1.
Test set of a Small signaling network reconstruction by Morris et al. [35]: The publication of Morris et al. [35] showed that a mathematical model can be used to predict protein activity and cytokine release phenotypic response. The network consisted of 30 nodes and 45 edges if taking the network as a 1:1 interaction graph instead of the published hyper-edges. The data set to test the reconstruction of this graph included 28 of the 30 nodes. “Ras” and “mTOR” were left out to check if they will be found by the algorithm because these are oncogenes that should be found. Data sets were built in quadruples to simulate standard measurement conditions (triplicates) and having one more data point as noise. Data points were produced with a relative expression of 9.5 ± noises for reference sets and 12.5 ± noises for disease data sets. Noise was set as random values in the range ± 30% of the measured value. The values of the 48 non-differentially expressed genes were set between 12 and 14 in both the reference and the diseased data set just randomly. The data set was stored in the R package data.
Microarray processing
The task of microarray processing is represented in Figure 2A. The microarray data sets were processed using the limma R-package [36]. Normally the limma package shall automatically find red and green dots in microarray datasets and calculate the differential expression. For this analysis the data has to be read as single measurement arrays (two read-ins per array) instead of the standard differential expression method. Afterwards, the data was background corrected using the “normexp” method and normalized using “quantile” normalization [36]. After constructing a linear model between diseased and wild type reference, only data sets with a fold change of 100% (slope < -2 or slope > 2) and a Bonferroni-Hochberg corrected p-value of 5 10-5 were taken for further analysis. Using the hgug4112a library [37] AgilentIDs were annotated to GeneSymbols, UniprotAccessions (ACs) and ENTREZIDs. Finally fold-change and p-values were stored for gene set enrichment (MultiEnrichment) in a data list.
Pathway databases
To perform gene set enrichment, gene data sets from 7 databases shown in Table 1 were considered. All were databases included human genes and associations with either pathways, diseases or functionality annotations. All databases had to be converted to Gene Matrix Transposed (GMT) format [4]. BioPAX format had to be converted using “paxtoolsr” [38] in combination with a parser for the combination of created “.gmt” files in R. NDEX [39] format was parsed to GMT using a python parser out of the NDEX cravat_nci pathway collection object. Disease sets from DiseaseConnect [40] were also converted to gene sets in GMT format by an R parser. All other databases were directly available in GMT format.
Multiple gene set enrichment (MultiEnrichment)
This method is represented in Figure 2B. Gene set enrichment was performed using the GAGE tool, using the relabeled data sets for each database shown in Table 1. Gene sets were selected by a corrected p-value of 0.2 and significant up- or down regulation. Input data sets were compared pair-wise. The pairwise set size was chosen (0.1*number of input genes, number of input genes) until the number of inputs was higher 500, then it was chosen (10, 500) as the default value of the gage tool. For each gene set, the genes belonging to it were measured in the initial microarray and added as additional columns using the dplyr package [41]. All results identifiers were relabeled to ENTREZ IDs if not already provided in this format by using the hgug4112a library [37] or manually added mappingtables (Storing data sets).
All gene set enrichment results were concatenated in one table in R. The occurrence of a gene in a gene set was encoded in a binary format using sample sequences [52]. Afterwards genes were clustered by their members using the Hamming Distance and “ward.D2” clustering. Clusters were cut with the “cuttree” method where the number_of_clusters was chosen to be 10% of the original number of gene sets found by gene set enrichment. For each cluster, a cluster score was evaluated by Eqn (1)
 (1)
(1)
and all the genes belonging to the cluster were added as ENTREZ IDs. ENTREZ IDs (genes) could be converted to Uniprot Accession numbers (proteins) for further analysis. Since genes can encode for multiple proteins the conversion can increase the number of identifiers. This increase was accepted.
Table 1. Databases included for gene set enrichment.
Database Name |
Access dateURL |
Format |
Labeling |
Citation |
Wikipathways |
(2016-03-14) [42] |
GMT |
ENTREZ ID |
[43] |
Reactome |
(2016-03-14) [44] |
GMT |
UNIPROT |
[45] |
KEGG |
(2016-03-21) [46] |
GMT |
ENTREZ ID |
[4] |
Gene Ontology |
(2016-03-21) [47] |
GMT |
ENTREZ ID |
[4] |
PANTHER |
(2015-03-02) [48] |
BIOPAX |
ENTREZ ID |
[49] |
BioCarta (NDEX) |
(2016-03-14) [50] |
E_SET |
GENESYMBOL |
[39] |
Disease Sets |
(2015-09-25) [51] |
Disease-Gene relations |
GENESYMBOL |
[40] |
Network reconstruction from pathway members using protein-protein interaction databases
This method is represented in Figure 2C. Reactome protein-protein protein interaction and STRING databases were downloaded as indicated in Table 2. Both databases were uploaded to MySQL servers and converted into protein-protein interaction lists by MySQL database operations. The protein-protein interaction lists were remapped from internal database identifiers to Uniprot identifiers by the provided mapping tables of the two databases. The converted lists were transferred into undirected “igraph” [53] objects in R. STRING interactions were modeled as edges if the interaction score was higher than 800 (maximum scale 1000). All interactions described in Reactome were taken as they are all manually curated and though have a higher trustworthiness than STRING interactions.
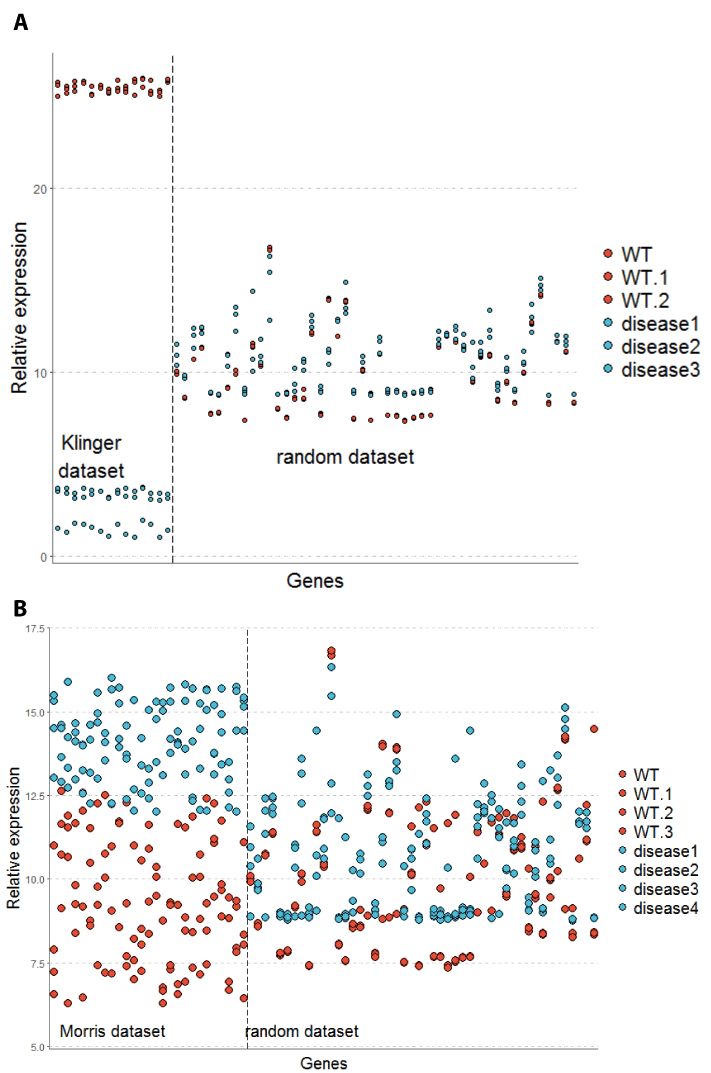
Figure 2. Overview of test data sets for MultiEnrichment tool. To demonstrate the function of the MultiEnrichment and network reconstruction tool these two data sets were constructed. (A) The first data set clearly shows differentially expressed genes in the Klinger et al set with a high difference in relative expression for WT and disease sets. (B) The second data set shows a high noise in the differentially expressed genes and overlaps of measurement points even in differentially expressed genes (Morris data set). The random sets were chosen equally in both tests.
The pathways resulting from the gene set enrichment (MultiEnrichment) with cluster scores greater than 3.0 were taken for further analysis. For each member of a pathway, the shortest path to all other members was searched on the igraph objects as described in Figure 3. Members were therefore taken as seed nodes.
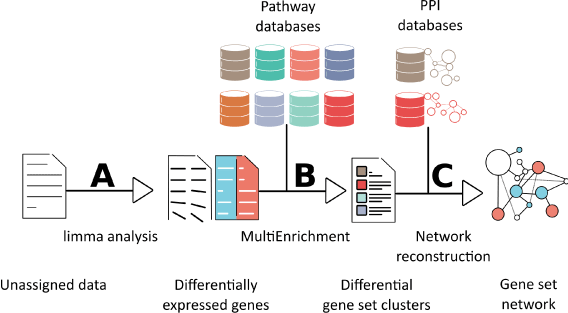
Figure 3. Workflow for generating a genes set network. Generating a pathway network from microarray or RNAseq data involves three steps. (A) Unassigned raw data is normalized and categorized using a linear model by the limma package. Non-differentially expressed genes are taken out of the data set. (B) Differentially expressed genes or proteins from these assigned data sets are taken into a MultiEnrichment analysis. The MultiEnrichment analysis takes seven pathway databases and the differentially expressed genes as inputs. It returns the necessary clusters of pathways that explain the difference between the differentially expressed genes. (C) From these clusters a network is constructed. The construction runs on two protein-protein interaction (PPI) databases. The reconstructed network is composed by differentially expressed genes and connectors. It represents an enriched pathway in the raw data set.
Each node of the Reactome or STRING graph lying on a shortest path between the seed nodes is added to a new pathway graph. This method was chosen by Kirouac et al. [23] and successful lie reconstructed a pathway from multiple databases [23]. A simple example is shown in Figure 3. For each edge the number of occurrences was counted in a list of all edges of all graphs. The minimum number of occurrences of an edge present in the intersection graph was set as parameter “edge_repetition” and chosen as described in the results. Finally, all the graphs for each Reactome and STRING were intersected to one graph by taking only the edges appearing in minimum “edge_repetition” graphs. This method produces a single graph for each Reactome and STRING database. The size of the graph depends therefore on the edge_repetition parameter. A standard example of the algorithm can be seen in Figure 5.
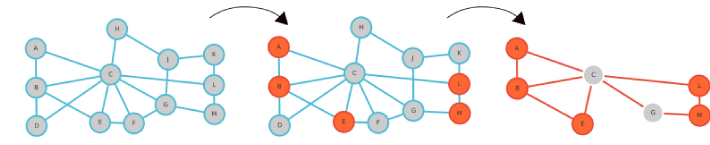
Figure 4. Shortest Path Evaluation for an example network. For the (A) example network with 13 nodes, 5 seed nodes are selected (B) and the shortest path network reduction is performed (C) by searching the shortest paths between all of these 5 nodes and taking all edges on these paths.
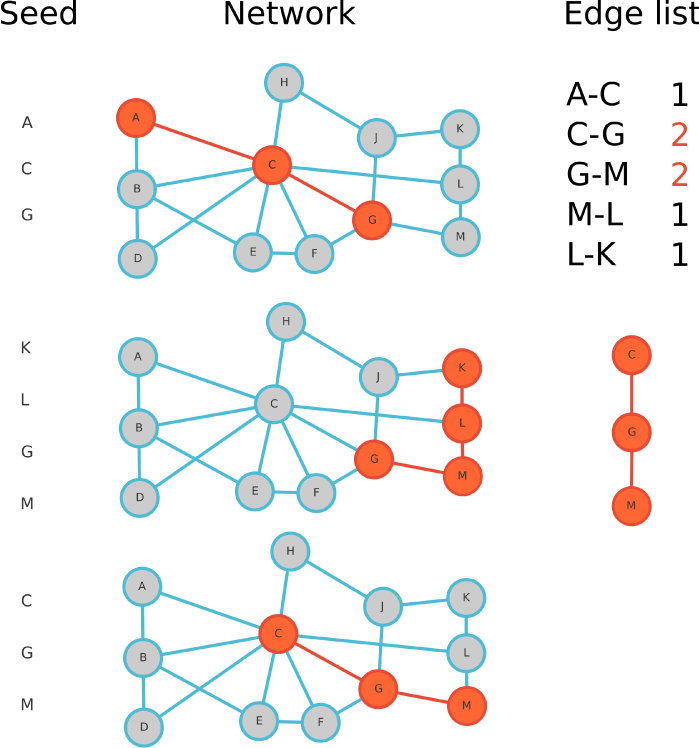
Figure 5. Network reconstruction for 3 different seed lists and an edge_repetition of 2. Three seeds shown on the left are used as the input (A,C,G / G,K,L,M / C,G,M). Three times the shortest path is calculated on the network. The number of occurrences of each edge of those shortest paths is counted in the edge list. The graph reconstructed if the edge_repetition is chosen to be 2 is shown underneath the edge list.
The subgraph of the Reactome and STRING databases were intersected after considering all edges from Reactome that also appeared in STRING. Thereby, the graphs were represented as undirected igraph objects to ignore the order of edges in both databases. The final graph could be exported as an SBML [30] file by the reconstruction tool or as a Cytoscape [16] readable SIL file by the CellNOptR toolbox [55].
Software distribution
The whole toolbox is provided within two R packages. The package IBNetwork includes the aforementioned methods and the package IBData includes the data sets and applies the methods onto the data sets considered in this study.
To analyze the three input sets this section will go set by set. First the smallest set [34], afterwards the more noise test set of Morris et al. [35]and later on a real data set will be analysed.
Deriving a network for a well-known and well described EGF pathway
To generally test the method an already described EGF signaling pathway was used to construct a differentially expressed dataset. The pathway’s network shall be rebuilt with MultiEnrichment and network reconstruction by using the genes of this pathway as an input set.
Running MultiEnrichment finds gene sets associated with the EGF pathway: Using a pathway described by Klinger et al. [34], a data set with 14 strongly differentially expressed genes was created. To check the performance of the MultiEnrichment tool the data set was enclosed with 48 randomly selected genes that showed exactly the same expression in the reference and the disease data set including noise. Processing the coerced data set with the MultiEnrichment Tool revealed 120 pathways that were enriched with a Gene Set Enrichment p-value lower than 0.2, a set size between 6 and 60 and one-by-one paired comparison of the samples. The set size has to be changed due to the smaller number of genes in the input data set. The pathways were clustered into 12 enriched gene set clusters with cluster scores between 5.83 and 20.06 (Supplementary table 2).
Table 2. Protein-protein interaction databases used for network reconstruction.
Database Name |
Download Location
( Access date) |
Format |
Labeling |
Citation |
Reactome Simple |
http://www.reactome.org/pages/download-data/
(2015-12-15) |
SQL |
Reactome ID |
[54] |
STRING |
http://string.embl.de/newstring_cgi/show_download_page.pl
(2015-12-15) |
TXT |
STRING ID |
[27] |
None of the cluster sets included pathways from just one of the 7 input pathway databases (Table 1) rather each cluster was formed by multiple databases. The best scoring cluster gene set included 39 Uniprot Accessions including 13 of the 14 genes in the data set.
None of the gene sets included the 14th gene TGFalpha. The best scoring cluster truly revealed interleukin signaling gene sets as “9606: Interleukin signaling pathway”, “9606: Fc epsilon receptor (FCERI) signaling”, “BDNF signaling pathway WikiPathways_20160311 WP2380 Homo sapiens” and “9606: Downstream signaling events of B Cell Receptor (BCR)” were part of it. The second best set included the pathway “IGF signaling pathway”, being a major component of the EGF network presented by Klinger et al. [34].
Using MultiEnrichment gene sets revealed a comprehensive network accounting for most of the input network functionalities: The members of the 12 gene set clusters were used for the network reconstruction algorithm since all showed a cluster score greater than threshold value 3.0. The number of edges and nodes for the 24 reconstructed networks (12x for STRING; 12x for Reactome) is shown in Figure 6. The graphs of the Reactome network and the STRING network were intersected. This allows to check if a protein-protein interaction is represented in both databases. The number of nodes of the intersected graph (total) and the number of nodes that appear in both the original graph by Klinger et al. [34] and the reconstructed graph are shown (intersected) in relation to the edge_repetition in Figure 7A. Additionally Figure 7A shows the same representation for the edges. The total number of nodes decreases with an increasing parameter edge_repetition. The number of nodes also found in the graph of Klinger et al. [34] stays constant at 14 (100% recovery) until the edge_repetition parameter became greater 3. This is ¼ of the maximal value of the edge_repetition parameter.
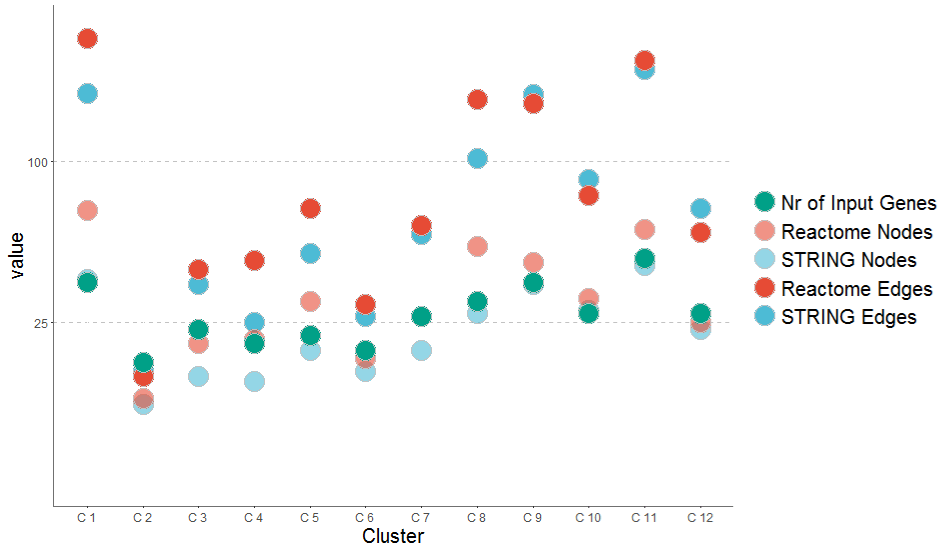
Figure 6. Network reconstruction for gene sets reveals differences in STRING and Reactome database. Deriving network graphs for the cluster gene sets revealed for each cluster one graph for the Reactome and one graph for the STRING database. Network graphs reconstructed from the Reactome database show in general a higher number of nodes and a higher number of edges. One node has in general around 4 incoming and outgoing edges. The number of nodes in the graph correlates linearly with the number of Input Genes for the algorithm. Just one of the Clusters (C1) includes all input nodes.
The minimum number of edges can be seen for an edge_repetition of 12. At this stage just one edge is present, which is also represented in the input graph. In summary, choosing the edge_repetition parameter is difficult and can be optimized by reconstructing more networks in comparison with well-known signaling networks as the one presented here. But it should stay a user decision if a large scale signaling network or a small core network is preferred.
For further investigations a core network was chosen with an edge_repetition of 4. This is due to the fact that just one node is lost from the original network. Additionally, the number of edges is under the limit of 50, enabling to manually check edges.
Looking at the reconstructed network in Figure 7B enrolls that the only missed node was the growth factor node TGFa which is an input node in the network of Klinger et al. [34]. This could be due to the fact that growth factors or other extracellular molecules are not as often connected in PPI databases as intracellular factors [11] and will be further discussed in the Discussion section. The main structure of the original network could be reconstructed. The reconstructed network is mainly missing nodes for the transcription factors GSK3, p70S6 and IRS1. AKT1 acting on GSK3 and p70S6 could be reconstructed. AKT1´s action on IRS1 is modeled through the CALM1 (Calmodulin1) as reported [56]. In addition the reconstructed network shows that PI3K can be activated by a synergistic action of EGFR and SHC1 [57]. The same synergistic effect was found for SHC1 and IGF1R [58]. In addition the direct activation of RAF by EGFR could be found neither in STRING nor in Reactome in multiple graphs. But the interaction of RAF with HRAS was reconstructed although skipped in the original network. The algorithm mainly shows two properties: (i) It nicely finds the interaction of phosphorylating and proteolytic signaling molecules, (ii) however it struggles to find interactions between signaling molecules and transcription factors. While the action of AKT on transcription factors is well described [59], the action of ERK on transcription factors could not be reconstructed as in the network of Klinger et al. [34].
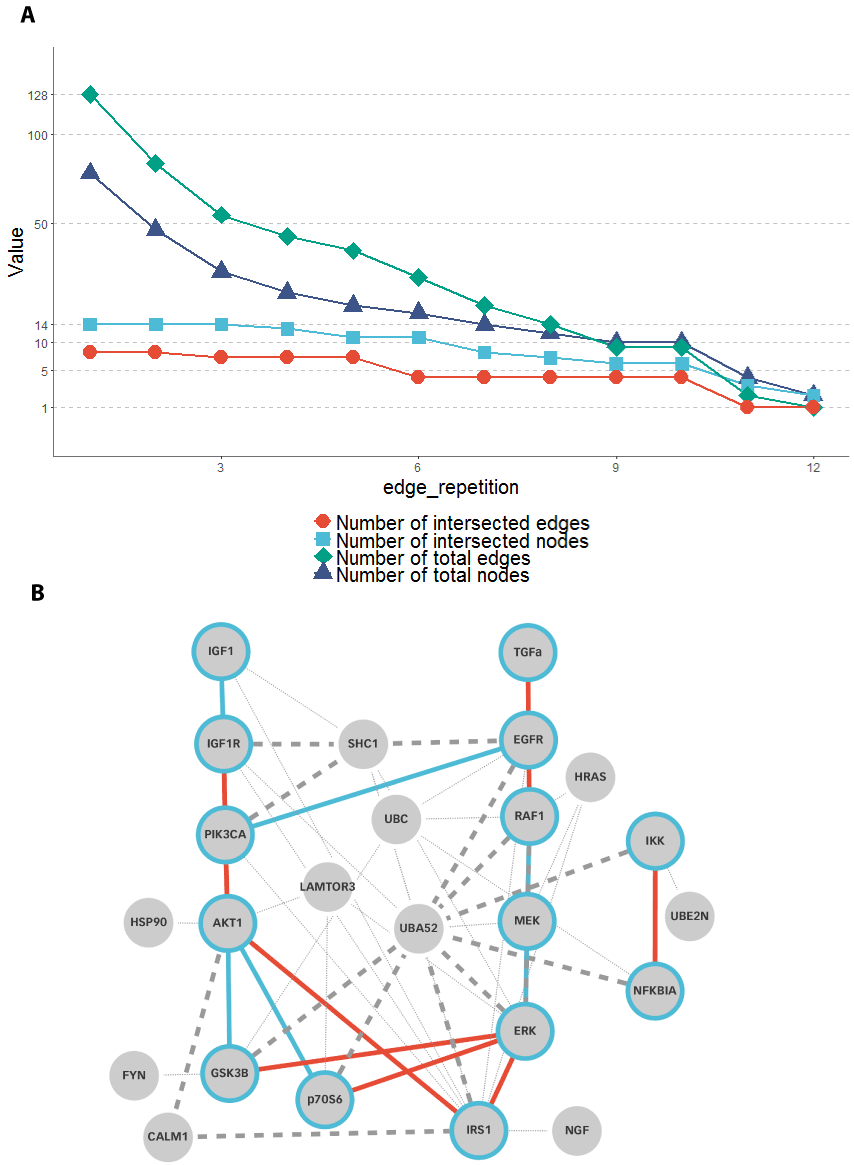
Figure 7. The minimum edge repetition exponentially decreases the number of nodes and edges in the network. (A) From a MultiEnrichment result, network graphs were reconstructed with different parameters for the edge_repetition. This graph represents the number of edges and nodes in the reconstructed graph. The graph was intersected with the graph of Klinger et al. Until an edge_repetition of 3 all nodes were reconstructed from the original network graph. The number of reconstructed edges stayed at around half of the number of reconstructed nodes and did not strongly decrease by increasing the edge_repetition. Although increasing the edge_repetition strongly decreased the number of total edges in the reconstructed graph. While an edge_repetition of 1 revealed 128 edges, an edge repetition of 4 revealed only 44 edges. The number of intersected nodes decreases from 8 to 7 in the same range of the edge_repetition parameter. Increasing the edge_repetition over 10, moves the number of edges and nodes below 10. (B) The network graph at edge_repetition 4 shows a structure that is close to the input graph from Klinger et al. Edges occurring in the reconstructed and the original graph are colored blue. Edges occurring only in the original graph are colored red. Edges appearing only in the reconstructed graph are dashed while those accounting for original edges have a higher width. The figure shows that TGFa was not reconstructed. Furthermore, most of the signaling down to transcription factors could not be reconstructed as a direct edge. However, all signals except TGFa – EGFR and PI3K – AKT1 could be reconstructed via indirect interactions. Mainly the SHC1 adapter protein for receptors and Ubiquitin (UBA52) for signaling molecules link from upstream to downstream signals.
Finally, this automated method generates a comprehensive graph that could be used as a basis for modeling EGF signaling. Furthermore, the tool has computational time of about only 5 minutes to reconstruct this network from scratch. In this case computational reconstruction is even faster than manually copying (drawing) from a published image.
Pathway reconstruction can be used for a general reconstruction of logical models
MultiEnrichment revealed correct pathways from noisy and missing value data: Morris et al. [35] presented different ways to implement logic modeling in biological signaling [6,35,55]. To test if the algorithm can reconstruct larger signaling networks we used the transcription factor signaling network of their 2011’s publication Figure 5 [35]. Compared to Deriving a network for a well-known and well described EGF pathway we increased the noise and introduced missing nodes (Test set of a Small signaling network reconstruction by Morris) to have a more challenging data set. In this case 12 clusters of pathways were found by the MultiEnrichment tool Supplementary table 3. The most abundant cluster showed Toll-like-receptor signaling and TRAF6 activated MAPK signaling. These two pathways were the ones mainly represented in the network of Morris et al. [35]. The 5th cluster also revealed receptor signaling as IL1, IL6 and IGF signaling. These were also modeled by the logic model.
Large networks were derived using gene sets derived from noisy data: For each of the clusters of the MultiEnrichment tool a network was reconstructed on the basis of the STRING or Reactome databases. Networks for The Reactome database had a higher number of nodes even if the number of edges was comparable to the number of edges in the STRING networks (Figure 8A) except the first cluster. As the first cluster mostly directly fits to pathways, due to the higher cluster score, multiple Reactome pathways might have been enriched, here. The average network size was about two times higher than for the Klinger data set. The number of nodes in the Morris data sets was also twice as big as for the Klinger data set (Materials and Methods 6.2). The cluster gene sets were used for network reconstruction. Networks were too large for manual interpretation until a minimum edge_repetition of 6 (Figure 8B). Increasing the parameter over this value abolishes a comprehensive network and shows only a minimum intersection network. For a representative network a minimum edge_repetition of 7 was chosen. This value is 1.75 times the value for the Klinger network. This enables keeping all nodes and having less than 50 nodes in total. The network is represented in Figure 9.
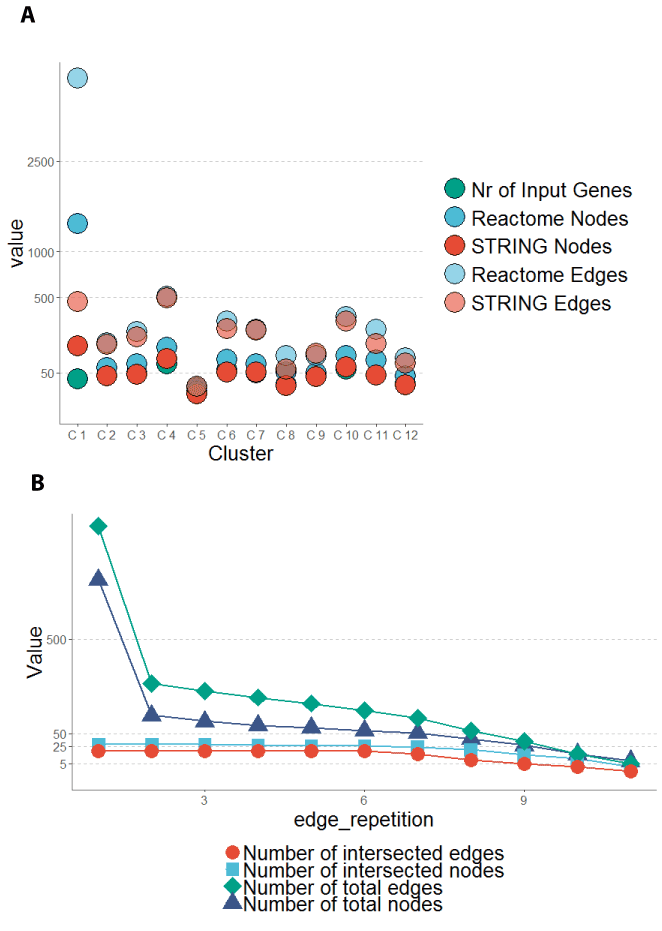
Figure 8. Networks reconstructed from 12 pathway clusters generate recover input nodes in a large test data set. (A) 12 Pathway gene sets were used to reconstruct networks from STRING or Reactome database. STRING database networks were smaller than Reactome networks in general. All input genes of the gene sets were recovered in the output networks. (B) Using these networks to build an intersected network shows that the reconstructed networks contain more edges and nodes until the edge_repetition parameter is chosen greater 9. The edge_repetition parameter defines in how many networks an edge has to occur (see section 6.6). The number of recovered (intersected) edges stays around 30 % of the total number of edges in the recovered network until the edge_repetition parameter is greater 9.
Figure 9. Reconstructed network of Morris et al. [35] Using a minimum of seven edge repetitions a network was reconstructed by MultiEnrichment and Reactome plus STRING database network intersection. Nodes found in the input network and the reconstructed networks are highlighted in blue, nodes present in the input network but not in the reconstructed network are shown in red. Edges found in both networks are highlighted in blue, edges found just in the input network are highlighted red. Edges showing detour to the input network, appearing in the reconstructed network are highlighted with thick grey lines. All transcription factors except HistH3 were reconstructed. Via detours all connections between transcription factors and receptors were reconstructed. Mainly TGF and MEK 1/2 signaling were not reconstructed. MAP Kinase, AKT and IκB signaling are strongly conserved in the signaling network. Important signaling molecules of TRAF6 and Interleukin and IGF signaling, such as RAC, MyD88, IRAK2 and SHC1 were reconstructed, although not present in the input model.
The final reconstructed network (Figure 9) included one of the two missing input nodes. Respectively, Ras was reconstructed while mTOR and its connections were not found as necessary nodes. The mTOR signaling was reconstructed by a direct connection of IGF and IRS1 and by a MAPK8 – LAMTOR – p70S6 detour. This way the functionality was reconstructed, but not the exact signaling. Similarly, the signaling for four MEK ½ (also called MAPK2K1) was not reconstructed.
IL6 was directly connected to AKT instead of choosing a detour over PI3K. On the other hand, PI3K JNK signaling was not modeled via MAP3K1 as proposed by Morris et al. [35] but via SHC1 and Rac. This interconnection can be due to the high rate of publications on this signaling pathway [60] describing SHC1 – Rac connections.
Some of the pathways found were modeled differently than in the model of Morris et al. [35]. Hsp27 was not modeled as a downstream target rather as a regulator of MKK4, which is in accordance with literature [61]. The tumor antigen p53 was connected to p38 which was neglected in the Morris et al. [35] network. Also FYN STAT3 Signaling was included in the signaling network, which is an important downstream target of IL6 signaling [62]. In these two signaling motifs the algorithm found interactions that were not considered by manual curators.
MultiEnrichment of cancer cell lines microarrays generates a graph of well-known and novel cancer treatment targets
Differential expression analysis does not unlock target genes from three microarray data sets: Using the limma package as described in 6.3 revealed 12758 differentially expressed genes in the data set. A list of 11 genes that were highly up (>25 %) or down (>25%) regulated could be found. These are shown in Table 3. The genes include some of the proteins known for cancerogenous action such as ANXA1 (annexin 1), CD44 or MMP1. Annexin 1 is known for interacting with the ERK MAPkinase in cancer signaling [63]. CD44 is known as a tumor marker and plays a role in cell proliferation, cell differentiation and cell migration [64]. MMP1 is an important protease for cancer spreading [65]. The pure statistical analysis also revealed genes as LDHB (Lactate dehydrogenase) FSTL1 which plays a role in arthiris [66] and ICAM4 which regulates cell-cell adhesion of red blood cells [67]. As Finding a connection between e.g. a cell-adhesion molecule and a sugar degrading enzyme is not effortless. Creating a comprehensive network from this list of genes is nearly impossible. A pure statistical approach does not gain sufficient results if looking for interactions inside cells [68].
Table 3. Differentially expressed genes in 3 liver cancer lines against a control sample.
Differentially expressed genes |
Up-regulated genes |
Down-regulated genes |
ANXA1 |
LDHB |
GNG11 |
MMP1 |
BM928667 |
SULT2A1 |
CD44 |
FSTL1 |
SPANXA1 |
CRH |
ICAM4 |
|
Today’s research aims at finding the cause of the behavior of cancer cells. Cascades, pathways and networks are able to predict difficult interactions and even side effects of the treatments.
MultiEnrichment finds 463 enriched pathways and collapses them to 47 clusters: With this approach, we were able to derive 463 pathways within the 7 databases, using the 12758 differentially expressed genes. While ENTREZ Gene ID or UNIPROT identifiers performed well in the identifying 413 gene sets, mapping by Gene Symbols translated via the hgug4112a [37] mapping database was rather difficult and just revealed 50 gene sets. The clustering of the gene sets revealed 47 clusters of different size. All genes belonging to a cluster were added as Uniprot identifiers. The table with these clusters can be found in Supplementary table 1. The cluster scores were lower than the values of the MultiEnrichment for the Klinger et al. [34] data set.
A network graph generated from pathway clusters shows well-known cancer pathways: The result of the MultiEnrich Tool was fed into a network reconstruction algorithm. Initial networks were reconstructed on the basis of the Reactome and STRING databases. A shortest path search on these databases with genes from each cluster was performed. The size of the reconstructed graphs for clusters with a cluster score > 3.5 is shown in Figure 4 and Figure 10. It can be seen that sometimes not all input genes could be found in the protein-protein interaction databases. Anyhow, the graphs of Reactome and STRING differ mainly in the number of edges. The connectivity of STRING graphs is higher (Network reconstruction from pathway members using protein-protein interaction databases) than the connectivity of Reactome graphs. In Figure 10 it can be seen that the distance between number of nodes and number of edges stays approximately constant. Since the y-axis is logarithmic, we can state that the number of edges increases exponentially with the number of nodes.
Figure 10. Sizes of constructed graphs for clusters. The first eight clusters (Supplementary table 1) from a MultiEnrichment result on Reactome and STRING database shows that the cluster with the lowest number of input gens can produce the highest number of output edges (C5). STRING shows a higher connectivity and larger graphs than Reactome in most cases. Only one case (C8) reveals a larger graph in Reactome.
Figure 11. Reconstructed network graph for a cancer microarray data set. By using MultiEnrichment and a network reconstruction algorithm a network with 92 nodes and 152 edges was generated. The network contains some of the most important signaling molecules in cancer such as EGFR, AKT, SRC and HRAS. The graphic points out two important signaling pathways for proliferation found by the present algorithm and one novel signaling pathway. One is the proliferation pathway that can be modulated by Toll-like receptors (TLR4), Wnt signaling (WNT1) or Integrin signaling (ITGB3). This affects downstream transcription factors such as Nf-kB/RelA and MYC. The other found pathway is the TRAF6 that influences proliferation via the MAP kinase cascade. The cascade can be influenced not only by the TRAF6 but also by the oncogene HRAS. Other components of this network are responsible for cancer-stroma signaling such as SSP1 (Angiogenesis), CD4 (Immune system regulation) or CTNNB (cell-cell-adhesion).
Considering a cluster score >3.5, 25 graphs were constructed. From these 25 graphs a combined graph was reconstructed. We chose an edge_repetition parameter of 6 to reconstruct one. Again this is due to the practical and comprehensive graphical representation of the graph. This resulted in a combined graph with 92 nodes and 152 edges. The network graph can be exported as a SBML file or SIF file, for further analysis in Cytoscape [16]. This process is partly represented in Figure 5 and Supplementary Figure 1. The reconstructed network contains important cancer pathways. The main examples shown are the AKT, Nf-kB signaling and the TRAF6 signaling. The pro-proliferative signals provided by the AKT signaling pathway [69,70] and the changing inflammatory signaling of Nf-kB [71] are known to be two of the major players in cancer signaling. Both were found automatically by the proposed algorithm. Additionally, we found TRAF6 signaling which can change TGFbeta signaling in cancer [72]. In this model it was mainly connected to its role in proliferation as changing the MAP kinase cascade [73], mostly in immune-signaling. Finding those pathways in the reconstructed network shows that by using cancer cells genomic data as input with the MultiEnrichment and the network reconstruction method it is possible to reveal cancerogenous pathways.
To emphasis that this method is able to describe more than well-known pathways, we highlighted another part of this network. THRA, ESR and PGR are all hormone receptors. THRA is a thyroid hormone receptor. Thyroid hormones can act directly on transcription [74] and THRA was also shown to bind DNA and enhance transcription [75]. This brought up studies to use THRA as a biomarker for breast cancer prognosis [76]. We found in this network a connection with the PIK3 kinase family. The same context of Hormone receptors brought up estrogen receptor ESR and progesterone receptor as nodes of the network. All together the three receptors seem to be differentially expressed and change a network perturbing the proliferation and growth of the cancer cells. This effect could be observed all over the liver cancer cell mix. Related studies in breast cancer were already [77] evaluated, nevertheless finding this network suggests that intracellular hormone receptors function is also present in liver cancer.
Using genetic expression profiles to reconstruct signaling models demands plenty of biological expertise and literature knowledge. The presented tool proposes a comprehensive way to construct signaling models based on differential data. By using raw data, manually curated databases and an automated reconstruction, it was possible to produce network models describing biological phenomena. Interpreting an initial data set by using gene set enrichment tools is a common way to gain knowledge and first insights to the experimental output. Most researchers choose a single tool for that and rely on the manual curation of this single tool. Here, the MultiEnrichment made it possible to integrate at least seven databases (Table 1). Using these databases for gene set enrichment and combining them with a clustering approach revealed reasonable pathway clusters. The method generated data set 47 pathway clusters for a microarray data set with 14,000 measurements and 12 pathway clusters for differentially expressed genes from test data sets. These numbers are easy to handle. Mainly using up-to-date datasets and having the possibility to update them is a clear benefit for researchers who have been using DAVID before [20]. Using more than one database let’s this method outperform other gene set enrichment methods.
Nevertheless, from the large number of input gene sets and pathways just 463 could be mapped to the microarray data set (MultiEnrichment finds 463 enriched pathways and collapses them to 47 clusters). Increasing this number would be possible by implementing a thesaurus based mapping algorithm [78] and deriving better annotations of the pathway genes rather than using the annotations provided by the “.gmt”-file provider. Nevertheless, a good mapping was reached for databases annotated by Entrez GeneID or Uniprot Accessions. Therefore, we propose to always use curated identifiers as the two mentioned instead of gene symbols.
In order to increase the information stored in pathway enrichments we proposed a network reconstruction algorithm. Networks provide a view that can easily be interpreted by biologists and engineers at the same time and enhance systematic understanding of biology [79]. Reconstructing a network from liver cancer data revealed an unknown pathway that was already described by others in different disease contexts [Table 5]. The input genes are set into a context. Moving from a microarray data table to a network view revealed further insights to the data helping to pose new hypothesis. Here we described that in liver cancer context an investigation in hormone receptor responses might be important for the cancer phenotype.
Table 4. Number of enriched gene sets per database.
Database |
gene sets |
Identifier |
Wikipathways |
59 |
ENTREZ |
Reactome |
200 |
UNIPROT |
KEGG |
44 |
ENTREZ |
GO |
80 |
ENTREZ |
PANTHER |
30 |
UNIPROT |
BioCarta+NDEX |
12 |
SYMBOL |
GWAS / OMIM |
38 |
SYMBOL |
Table 5. Enrichment of input datasets by the approach.
|
Klinger et al. [34] |
Morris et al. [35] |
Microarray |
Input set size |
62 |
76 |
14,000 |
Found pathways |
120 |
162 |
413 |
Found pathway clusters |
12 |
12 |
47 |
Found nodes |
24 |
56 |
92 |
Found edges |
54 |
122 |
263 |
When challenging this algorithm with two recently published models it performs well in the reconstruction of small models. Reconstruction of a larger signaling model showed that the algorithm reconstructed parts of the network in the same manner as a manual curator. In detail the shortest path algorithm was responsible for getting detours and shortages of known pathways. Mainly this can be seen if comparing the reconstructed network for Morris et al. [35] with a Reactome network such as R-HSA-2428933 [80] where multiple phosphorylation steps lead to PI3K activation after IGF activation instead of just a one-step reaction described here. This shortcoming could be overcome by implementing different algorithms as shown recently [81,82]. Direct interactions between Receptors and Transcription factors were brought up. This is not possible due to intracellular locations. But it makes sense in case of lack of data for intracellular processes to sometimes model these parts with shortages.
On the other hand all protein digestion processes were modeled in detail including Ubiquitin and Ubiquitin Ligases. These are mostly reduced in signaling models by introducing negative edges [35]. Here we saw that the algorithm shows a bias towards signaling hubs including these in the final network. For example Figure 7B showed that AKT1 was using the adapter proteins CALM1 to influence the downstream signals IRS1. This is due to the used transcription factors, which shown to also mainly interact with AKT and similar networks missing ERK effects were painted [59,83,84] and was previously shown in literature [56,85]. Something similar was also shown for the ERK action on IRS1 [86]. This behavior is difficult to avoid because of the hub-like structures of most protein-protein interaction databases available [11]. Skipping certain hubs by shortest path search already avoided connecting all negative effects based on protein digestion with Ubiquitin in the shown networks. The algorithm was able to reconstruct the major functionalities of the network and additionally derive nodes like the HRAS inhibitor of the RAF, MEK, ERK pathway, that were not mentioned in the original network by Klinger et al. [34] but are highly relevant.
The second network based on test data lacked interactions on TGFalpha and MEK 1/2. Kirouac et al. [23] already showed that Reactome and STRING database do not contain all interactions in MAP Kinase related signaling systems. As TGFalpha did not appear in many of the found by MultiEnrichment it could not be found by intersecting networks in Reactome and STRING databases. This could be due to the fact that it is an input gene and not directly part of signaling networks. TGFalpha is mainly acting on the EGF receptor [87]. As this receptor is missing in the input network no connection to the rest of the network could be reconstructed. To overcome this shortcoming in more databases should be integrated into the network reconstruction process which would allow indirect interactions. Increasing the number of databases would on one hand allow reaching other areas of the interactome and on the other hand it would decrease the uncertainty of a protein-protein interaction. Finally, the amount of manual curated data in each network would increase and allow the algorithm to have equal or maybe better performance than manual curation.
The minimum edge_repetition parameter is used to check, how many signaling cluster networks shall overlap. This means that it checks the consistency of signaling pathways or short motifs to be stably enclosed into these large networks. As all of these networks were generated from seeds build by the MultiEnrichment tool. Though using this workflow will generate signaling networks that overlap between different pathway annotations. Increasing this value leads to highly conserved motifs, using a low value includes all motifs, that could generate the differential expression of the input data. Finding the right minimum edge_repetition parameter depends on the purpose of the researcher. A low parameter guarantees a high coverage of the data with low specificity. Choosing a high value generates networks with high specificity but really low coverage. The coverage decreases exponentially with this parameter as shown in Figure 7A and Figure 8B. We recommend choosing the parameter at the point of these figures where the number of intersected nodes strongly decreases. Researchers can also reconstruct all networks within really short time frames and look at all possible reconstructed networks.
Systematic approaches and mathematical models can be used to generate treatment hypothesis in cancer [7]. The automatic reconstruction of networks was able to generate hypothetical networks. Hypothesis generation form these networks is one of the key drivers of cancer research [88]. Training these networks with comprehensive data with novel algorithms [55,89] will allow to predict treatment outcomes and increase the speed in cancer treatment research. The algorithm presented generates better pathway lists by using an ensemble of databases and having updatable background information. The possibility to automatically generate networks from this pathway information supports constructing mathematical models in cancer signaling research. The algorithm overcomes time consuming manual curation and enables a faster hypothesis generation, supporting a lot of new findings in cancer research.
View supplementary data
- Hanahan D, Weinberg RA (2011) Hallmarks of cancer: the next generation. Cell 144: 646-674. [Crossref]
- Stegmeier F, Warmuth M, Sellers WR, Dorsch M (2010) Targeted cancer therapies in the twenty-first century: lessons from imatinib. Clin Pharmacol Ther 87: 543-552. [Crossref]
- Rykunov D, Beckmann ND, Li H, Uzilov A, Schadt EE, et al. (2016) A new molecular signature method for prediction of driver cancer pathways from transcriptional data. Nucleic Acids Res 44: e110. [Crossref]
- Subramanian A, Tamayo P, Mootha VK, Mukherjee S, Ebert BL, et al. (2005) Gene set enrichment analysis: a knowledge-based approach for interpreting genome-wide expression profiles. Proc Natl Acad Sci U S A 102: 15545-15550. [Crossref]
- Iorio F, Shrestha RL, Levin N, Boilot V, Garnett MJ, et al. (2015) A Semi-Supervised Approach for Refining Transcriptional Signatures of Drug Response and Repositioning Predictions. PLoS One 10: e0139446. [Crossref]
- Morris MK, Melas I, Saez-Rodriguez J (2013) Construction of cell type-specific logic models of signaling networks using CellNOpt. Methods Mol Biol 930: 179-214. [Crossref]
- Abbott LH, Michor F (2006) Mathematical models of targeted cancer therapy. Br J Cancer 95: 1136-1141. [Crossref]
- Iwamoto N, D’Alessandro LA, Depner S, Hahn B, Kramer BA, et al. (2016) Context-specific flow through the MEK/ERK module produces cell- and ligand-specific patterns of ERK single and double phosphorylation. Sci Signal 9: ra13.
- Blüthgen N, Legewie S, Kielbasa SM, Schramme A, Tchernitsa O, et al. (2009) A systems biological approach suggests that transcriptional feedback regulation by dual-specificity phosphatase 6 shapes extracellular signal-related kinase activity in RAS-transformed fibroblasts. FEBS J 276: 1024-1035.
- Comparison of human cell signaling pathway databases—evolution, drawbacks and challenges.
- Klingström T, Plewczynski D (2010) Protein–protein interaction and pathway databases, a graphical review. Brief Bioinform 12: 702-713.
- Juty N, Ali R, Glont M, Keating S, Rodriguez N, et al. (2015) BioModels: Content, Features, Functionality, and Use. CPT Pharmacometrics Syst Pharmacol 4: e3. [Crossref]
2021 Copyright OAT. All rights reserv
- Carbon S, Ireland A, Mungall CJ, Shu S, Marshall B, et al. (2009) AmiGO: online access to ontology and annotation data. Bioinformatics 25: 288-289. [Crossref]
- Al-Shahrour F, Arbiza L, Dopazo H, Huerta-Cepas J, Mínguez P, et al. (2007) From genes to functional classes in the study of biological systems. BMC Bioinformatics 8: 114. [Crossref]
- Maere S, Heymans K, Kuiper M (2005) BiNGO: a Cytoscape plugin to assess overrepresentation of gene ontology categories in biological networks. Bioinformatics 21: 3448-3449. [Crossref]
- Shannon P, Markiel A, Ozier O, Baliga NS, Wang JT, et al. (2003) Cytoscape: a software environment for integrated models of biomolecular interaction networks. Genome Res 13: 2498-2504.
- Maciejewski H (2013) Gene set analysis methods: statistical models and methodological differences. Brief Bioinform.
- Abatangelo L, Maglietta R, Distaso A, D'Addabbo A, Creanza TM, et al. (2009) Comparative study of gene set enrichment methods. BMC Bioinformatics 10: 275. [Crossref]
- Huang da W, Sherman BT, Lempicki RA (2009) Systematic and integrative analysis of large gene lists using DAVID bioinformatics resources. Nat Protoc 4: 44-57. [Crossref]
- Wadi L, Meyer M, Weiser J, Stein LD, Reimand J, et al. (2016) Impact of outdated gene annotations on pathway enrichment analysis. Nat Methods 13: 705-706. [Crossref]
- Henry George Liddell, Robert Scott, A Greek-English Lexicon.
- Warde-Farley D, Donaldson SL, Comes O, Zuberi K, Badrawi R, et al. (2010) The GeneMANIA prediction server: biological network integration for gene prioritization and predicting gene function. Nucleic Acids Res 38: W214-W220.
- Kirouac DC, Saez-Rodriguez J, Swantek J, Burke JM, Lauffenburger DA, et al. [2012] Creating and analyzing pathway and protein interaction compendia for modelling signal transduction networks. BMC Syst Biol 6: 29.
- Salavert F, Hidago MR, Amadoz A, Çubuk C, Medina I, et al. (2016) Actionable pathways: interactive discovery of therapeutic targets using signaling pathway models. Nucleic Acids Res 44: W212-W216.
- Bansal M, Belcastro V, Ambesi-Impiombato A, di Bernardo D (2007) How to infer gene networks from expression profiles. Mol Syst Biol 3: 78. [Crossref]
- Krumsiek J, Suhre K, Illig T, Adamski J, Theis FJ (2011) Gaussian graphical modeling reconstructs pathway reactions from high-throughput metabolomics data. BMC Syst Biol 5: 21.
- Franceschini A, Szklarczyk D, Frankild S, Kuhn M, Simonovic M, et al. (2013) STRING v9.1: protein-protein interaction networks, with increased coverage and integration. Nucleic Acids Res 41: D808-815. [Crossref]
- Szklarczyk D, Franceschini A, Wyder S, Forslund K, Heller D, et al. (2015) STRING v10: protein-protein interaction networks, integrated over the tree of life. Nucleic Acids Res 43: D447-452. [Crossref]
- Dean CB, Nielsen JD (2007) Generalized linear mixed models: a review and some extensions. Lifetime Data Anal 13: 497-512. [Crossref]
- Hucka M, Finney A, Sauro HM, Bolouri H, Doyle JC, et al. (2003) The systems biology markup language (SBML): a medium for representation and exchange of biochemical network models. Bioinformatics 19: 524-531. [Crossref]
- UniProt Consortium (2015) UniProt: a hub for protein information. Nucleic Acids Res 43: D204-212. [Crossref]
- Edgar R, Domrachev M, Lash AE (2002) Gene Expression Omnibus: NCBI gene expression and hybridization array data repository. Nucleic Acids Res 30: 207-210. [Crossref]
- Semashko TA, Arzamasov AA, Fisunov GY, Govorun VM (2016) Transcription profiling data set of different states of Mycoplasma gallisepticum. Genom Data 11: 49-54. [Crossref]
- Klinger B, Sieber A, Fritsche-Guenther R, Witzel F, Berry L, et al. (2013) Network quantification of EGFR signaling unveils potential for targeted combination therapy. Mol Syst Biol 9: 673. [Crossref]
- Morris MK, Saez-Rodriguez J, Clarke DC, Sorger PK, Lauffenburger DA (2011) Training signaling pathway maps to biochemical data with constrained fuzzy logic: quantitative analysis of liver cell responses to inflammatory stimuli. PLoS Comput Biol 7: e1001099.
- Ritchie ME, Phipson B, Wu D, Hu Y, Law CW, et al. (2015) limma powers differential expression analyses for RNA-sequencing and microarray studies. Nucleic Acids Res 43: e47.
- Carlson M, Falcon S. hgug4112a.db: Agilent ‘Human Genome, Whole’ annotation data (chip hgug4112a). R package version 3.2.2.
- Luna A, Babur Ö, Aksoy BA, Demir E, Sander C (2015) PaxtoolsR: pathway analysis in R using Pathway Commons. Bioinforma Oxf Engl.
- Pratt D, Chen J, Welker D, Rivas R, Pillich R, et al. (2015) NDEx, the Network Data Exchange. Cell Syst 1: 302-305. [Crossref]
- Liu CC, Tseng YT, Li W, Wu CY, Mayzus I, et al. (2014) DiseaseConnect: a comprehensive web server for mechanism-based disease-disease connections. Nucleic Acids Res 42: W137-146. [Crossref]
- Wickham H, Francois R (2015) dplyr: A Grammar of Data Manipulation.
- Wikipathways Download. (2016) http://www.wikipathways.org//wpi/batchDownload.php?species=Homo%20sapiens&fileType=gpml&tag=Curation:AnalysisCollection.
- Kutmon M, Riutta A, Nunes N, Hanspers K, Willighagen EL, et al. (2016) WikiPathways: capturing the full diversity of pathway knowledge. Nucleic Acids Res 44: D488-494. [Crossref]
- Reactome Download. http://www.pathwaycommons.org/pc2/downloads/Pathway%20Commons.7.Reactome.GSEA.uniprot.gmt.gz. (2016).
- Cerami EG, Gross BE, Demir E, Rodchenkov I, Babur O, et al. (2011) Pathway Commons, a web resource for biological pathway data. Nucleic Acids Res 39: D685-690. [Crossref]
- Kegg 2016. http://software.broadinstitute.org/gsea/msigdb/download_file.jsp?filePath=/resources/msigdb/5.1/c2.cp.kegg.v5.1.entrez.gmt.
- GO 2016. http://software.broadinstitute.org/gsea/msigdb/download_file.jsp?filePath=/resources/msigdb/5.1/c5.all.v5.1.entrez.gmt.
- Panther download. ftp://ftp.pantherdb.org/biopax/panther.tar.gz.
- Thomas PD, Campbell MJ, Kejariwal A, Mi H, Karlak B, et al. (2003) PANTHER: a library of protein families and subfamilies indexed by function. Genome Res 13: 2129-2141. [Crossref]
- NDEX download. http://public.ndexbio.org.
- Disease Connect download. http://disease-connect.org/download/Disease-Gene_v1.csv.gz.
- Gabadinho A, Ritschard G, Müller N, Studer M (2011) Analyzing and Visualizing State Sequences in R with TraMineR. J Stat Softw 40: 1-37.
- Csardi G, Nepusz T (2006) The igraph software package for complex network research. Inter J Complex Syst 1695: 1-9.
- Fabregat A, Sidiropoulos K, Garapati P, Gillespie M, Hausmann K, et al. (2016) The Reactome pathway Knowledgebase. Nucleic Acids Res 44: D481-D487. [Crossref]
- Terfve C, Cokelaer T, Henriques D, MacNamara A, Goncalves E, et al. (2012) CellNOptR: a flexible toolkit to train protein signaling networks to data using multiple logic formalisms. BMC Syst Biol 6: 133. [Crossref]
- Munshi HG, Burks DJ, Joyal JL, White MF, Sacks DB (1996) Ca2+ regulates calmodulin binding to IQ motifs in IRS-1. Biochemistry 35: 15883-15889. [Crossref]
- Lee DY, Li YS, Chang SF, Zhou J, Ho HM, et al. (2010) Oscillatory Flow-induced Proliferation of Osteoblast-like Cells Is Mediated by avß3 and ß1 Integrins through Synergistic Interactions of Focal Adhesion Kinase and Shc with Phosphatidylinositol 3-Kinase and the Akt/mTOR/p70S6K Pathway. J Biol Chem 285: 30-42.
- Craparo A, O'Neill TJ, Gustafson TA (1995) Non-SH2 domains within insulin receptor substrate-1 and SHC mediate their phosphotyrosine-dependent interaction with the NPEY motif of the insulin-like growth factor I receptor. J Biol Chem 270: 15639-15643.
- Cheaib B, Auguste A, Leary A (2015) The PI3K/Akt/mTOR pathway in ovarian cancer: therapeutic opportunities and challenges. Chin J Cancer 34: 4-16. [Crossref]
- Murga C, Zohar M, Teramoto H, Gutkind JS (2002) Rac1 and RhoG promote cell survival by the activation of PI3K and Akt, independently of their ability to stimulate JNK and NF-kappaB. Oncogene 21: 207-216. [Crossref]
- Stetler RA, Cao G, Gao Y, Zhang F, Wang S, et al. (2008) Hsp27 protects against ischemic brain injury via attenuation of a novel stress-response cascade upstream of mitochondrial cell death signaling. J Soc Neurosci 28: 13038-13055.
- Qin B, Zhou Z, He J, Yan C, Ding S (2015) IL-6 Inhibits Starvation-induced Autophagy via the STAT3/Bcl-2 Signaling Pathway. Sci Rep 5: 15701. [Crossref]
- Zhang X, Li X, Zheng L, Lei L (2015) ANXA1 silencing increases the sensitivity of cancer cells to low-concentration arsenic trioxide treatment by inhibiting ERK MAPK activation. Tumori 101: 360-367.
- Tin AS, Park AH, Sundar SN, Firestone GL (2014) Essential role of the cancer stem/progenitor cell marker nucleostemin for indole-3-carbinol anti-proliferative responsiveness in human breast cancer cells. BMC Biol 12: 72.
- Farooqui M, Bohrer LR, Brady NJ, Chuntova P, Kemp SE, et al. Epiregulin contributes to breast tumorigenesis through regulating matrix metalloproteinase 1 and promoting cell survival. Mol Cancer 14: 138.
- Wang Y, Li D, Xu N, Tao W, Zhu R, et al. (2011) Follistatin-like protein 1: a serum biochemical marker reflecting the severity of joint damage in patients with osteoarthritis. Arthritis Res Ther 13: R193. [Crossref]
- Ihanus E, Uotila LM, Toivanen A, Varis M, Gahmberg CG (2007) Red-cell ICAM-4 is a ligand for the monocyte/macrophage integrin CD11c/CD18: characterization of the binding sites on ICAM-4. Blood 109: 802-810.
- Tsuji MI (2013) ResearchGate on discussion microarrays.
- Altomare DA, Testa JR (2005) Perturbations of the AKT signaling pathway in human cancer. Oncogene 24: 7455-7464. [Crossref]
- Mahajan K, Mahajan NP (2012) PI3K-independent AKT activation in cancers: a treasure trove for novel therapeutics. J Cell Physiol 227: 3178-3184. [Crossref]
- Karin M (2009) NF-kappaB as a critical link between inflammation and cancer. Cold Spring Harb Perspect Biol 1: a000141. [Crossref]
- Mu Y, Sundar R, Thakur N, Ekman M, Gudey SK, et al. (2011) TRAF6 ubiquitinates TGFβ type I receptor to promote its cleavage and nuclear translocation in cancer. Nat Commun 2: 330. [Crossref]
- Arthur JS, Ley SC (2013) Mitogen-activated protein kinases in innate immunity. Nat Rev Immunol 13: 679-692. [Crossref]
- Wu Y, Koenig RJ (2000) Gene regulation by thyroid hormone. Trends Endocrinol Metab 11: 207-211. [Crossref]
- Wulf A, Wetzel MG, Kebenko M, Kröger M, Harneit A, et al. (2008) The role of thyroid hormone receptor DNA binding in negative thyroid hormone-mediated gene transcription. J Mol Endocrinol 41: 25-34. [Crossref]
- Heublein S, Mayr D, Meindl A, Angele M, Gallwas J, et al. (2015) Thyroid Hormone Receptors Predict Prognosis in BRCA1 Associated Breast Cancer in Opposing Ways. PLoS One 10: e0127072. [Crossref]
- Trošt N, Hevir N, Rižner TL, Debeljak N (2013) Correlation between erythropoietin receptor (s) and estrogen and progesterone receptor expression in different breast cancer cell lines. Int J Mol Med 31: 717-725.
- Schijvenaars BJ, Mons B, Weeber M, Schuemie MJ, van Mulligen EM, et al. (2005) Thesaurus-based disambiguation of gene symbols. BMC Bioinformatics 6: 149. [Crossref]
- Pavlopoulos GA, Secrier M, Moschopoulos CN, Soldatos TG, Kossida S, et al. (2011) Using graph theory to analyze biological networks. BioData Min 4: 1-27.
- Holzenberger M (2011) Igf-I signaling and effects on longevity. Nestle Nutr Workshop Ser Pediatr Program 68: 237-245. [Crossref]
- Ritz A, Poirel CL, Tegge AN, Sharp N, Simmons K, et al. (2016) Pathways on demand: automated reconstruction of human signaling networks. Npj Syst Biol Appl 2: 16002.
- Calderone A, Formenti M, Aprea F, Papa M, Alberghina L, et al. (2016) Comparing Alzheimer's and Parkinson's diseases networks using graph communities structure. BMC Syst Biol 10: 25. [Crossref]
- Beauchamp EM, Platanias LC (2013) The evolution of the TOR pathway and its role in cancer. Oncogene 32: 3923-3932. [Crossref]
- McGonnell IM, Grigoriadis AE, Lam EW, Price JS, Sunters A (2012) A specific role for phosphoinositide 3-kinase and AKT in osteoblasts? Front Endocrinol (Lausanne) 3: 88. [Crossref]
- Shen X, Valencia CA, Szostak JW, Dong B, Liu R (2005) Scanning the human proteome for calmodulin-binding proteins. Proc Natl Acad Sci U S A 102: 5969-5974. [Crossref]
- Hartmann T, Xu X, Kronast M, Muehlich S, Meyer K, et al. (2014) Inhibition of Cullin-RING E3 ubiquitin ligase 7 by simian virus 40 large T antigen. Proc Natl Acad Sci U S A 111: 3371-3376. [Crossref]
- Ferrer I, Alcántara S, Ballabriga J, Olivé M, Blanco R, et al. (1996) Transforming growth factor-alpha (TGF-alpha) and epidermal growth factor-receptor (EGF-R) immunoreactivity in normal and pathologic brain. Prog Neurobiol 49: 99-123. [Crossref]
- Cancer Target Discovery and Development Network (2016) Transforming Big Data into Cancer-Relevant Insight: An Initial, Multi-Tier Approach to Assess Reproducibility and Relevance. Mol Cancer Res 14: 675-682. [Crossref]
- Vinayagam A, Zirin J, Roesel C, Hu Y, Yilmazel B, et al. (2014) Integrating protein-protein interaction networks with phenotypes reveals signs of interactions. Nat Methods 11: 94-99.