Blood platelets are highly sensitive circulating subcellular sensors that respond to a multitude of stimuli with a change of their resting discoid shape into more rounded structures processing blebs and pseudopodia. The platelet outline can be automatically segmented from digital images and shows a fractal behaviour. Due to the sensitivity of platelet shape change to preanalytical influencing factors, a highly standardized examination procedure is necessary
in order to obtain reliable and reproducible results. In the current work, a completely standardized analytical procedure comprised of standardized sample preparation, robotic image acquisition and algorithmic image analysis is described and validated using calibration objects of different size. The system allows for the user independent
examination of fractal and Euclidean geometrical properties from unfixed and unstained samples of soluble objects.
The results presented demonstrate the large intra and inter slide reproducibility and the ability of the system to clearly identify and separate smaller and larger particles as well as aggregates and objects out of focus. As the system is ideally suited for the examination of slides at higher throughput, it will enable and expedite the examination of the platelet shape features of larger cohorts of patients. Hence, it might provide an ideal basis for the
examination of possible preanalytical constraints and therefore help to improve our knowledge about the physiological and pathophysiological meaning of platelet shape change.
shape change, geometry, fractal analysis, quantification, robotic microscopy, morphometry; standardization
Blood platelets are sensitive circulating subcellular sensors that respond to a multitude of stimuli with a change of their resting discoid shape into more rounded structures processing blebs and pseudopodia. These morphological changes of platelet structure are generally referred to as the platelet shape change (PSC) reaction. PSC is regarded highly sensitive to preanalytical factors as for example temperature [1], anticoagulant [2], calcium-concentration [3, 4], glucose concentration [5], vibration [6], fixation [7] and contact to glass [8-11].
PSC can be quantitatively described by applying different geometrical descriptors to the platelet outline (PO) [12]. It has been found that the PO of platelets imaged by high-resolution darkfield microscopy [12] and electron microscopy [13-16] shows fractal behaviour and therefore can be described using the language of fractal geometry. Fractal geometry has gained increasing interest in life sciences as it enables a simple numerical description of complex and irregular forms [18-25].
In order to acquire unbiased information on PSC, a highly standardized analytical procedure is needed. The analysis of the acquired image data has already been standardized by our group (the Grünwald Remagen Opensource Unified Platelet Identification Tracker: GROUP-IT) [26]. This toolkit comprises the automated detection of blood platelet like structures on digital darkfield microscopic images and the analysis of its fractal and Euclidean geometric properties.
As it is our aim to establish a completely standardized analytical procedure for the examination of platelet shape and its change, a standardized preparation procedure as well as a simple and robust microscope robot were developed that allow for a reproducible microscopic examination and image acquisition. The current study describes the evaluation of the full system comprised of sample preparation, image acquisition and image analysis using calibration beads.
Sample preparation
Polystyrene latex beads (Sigma Aldrich, Germany) with different diameters (0.1 μm, 0.3 μm, 1.1 μm and 3.0 μm) were diluted 1:100 in aqua dest. (Ampuwa®, Fresenius Kabi, Germany). Stock solutions of the different sized beads were formed by re-diluting aliquots of 100 μl from each dilution 1:100. Additionally aliquots of 25 μl from each dilution were added to a part of 1000 μl of aqua dest. to get a stock solution of mixed beads.
A point mark was drawn with a waterproof pen (Staedtler permanent Lumocolor, blue, Staedtler Mars GmbH & Co Kg, Nuernberg, Germany) onto high precision coverslips (precision cover glass No. 1.5 H, 22x22 mm, 170 ± 5 μm thickness, Paul Marienfeld GmbH & Co. Kg, Lauda-Königshofen, Germany) and a drop of 10 μl from each stock solution (0.1 μm-, 0.3 μm-, 1.1 μm-, 3.0 μm- and mixed beads-solution) was pipetted onto each coverslip. Pre-cleaned microscope slides (soda lime glass of 3. hydrolytic class, 76 x 26 mm, approximately 1 mm thickness, Paul Marienfeld GmbH & Co. Kg, Lauda-Königshofen, Germany) were lowered to the coverslip at a constant speed and pressure using a self-made 45°-wedge attached to a standard 20 x 3 mm tension spring. Slides were flipped over after the solution has completely effused on the entire coverslip and were immediately sealed.
A total of 13 slides were prepared, one slide for each stock solution and four additional slides from the 3.0 μm and the mixed beads solution respectively.
The stage of a standard laboratory microscope (Leitz Laborlux, darkfield illumination,objective 100, 1.32-0.6 oil) was equipped with 3 stepper motors connected to a stack of 3 single-board programmable microcontrollers (Adafruit, Flitko GmbH, Germany).
Furthermore the release of a digital camera (Canon Eos 600 D) adapted to the c-mount, and an external TTL-flash (Canon 430EX2) adapted to the microscope through a mirror box (Stahlschmidt, Hagen) were connected to the microcontroller stack and thereby synchronized with the movement of the microscope stage. Thus, a simple microscope robot was realized. After setting the focus to the mark on the coverslip, the system was switched on. A total of 30 images from 10 different locations of the slide were acquired without any further user interaction. Each view field has a dimension of 97.5 x 63.1 μm². The entire measuring process takes 3 minutes per slide.
The dimensions of the first 20 sharply focussed beads from the image series of 1.1 μm and 3.0 μm beads respectively were measured using computer assisted manual measurement as previously described [8]. Briefly, the respective stack of images was loaded into ImageJ (NIH ImageJ, version 1.47v) and the diameters of the inner and outer borders of beads were determined using a self-developed ImageJ macro [8].
Platelet - beads segmentation and characterisation
The segmentation of images containing calibration beads was based on the algorithm described previously for the automated segmentation of real platelet images [12]. In contrast to the previous approach, an additional step for the deconvolution of the blurred images was implemented in order to increase the image quality. The updated algorithm forms the basis for all investigations performed on real platelets and calibration beads in our group and was implemented as an open-source toolkit termed GROUP-IT [26]. A complete description of the algorithm, apart from the deconvolution of blurred images, can be found in [16]. For the sake of completeness however, all steps of the algorithm are described in the following.
The RGB images acquired for the calibration beads were first transformed to grey scale images by averaging their red and green channels. The image background component, which is caused by an inhomogeneous illumination during the acquisition process, was then removed by estimating the low-frequency fraction of the grey scale distribution. The corresponding background-corrected images were then sharpened using a blind deconvolution approach as described in the following.
Here, for each image acquired in the stack consisting of 30 images acquired at 10 different locations, the point-spread-function (PSF) was determined using a combined maximum-likelihood estimation of the unblurred image and the PSF1. However, the unblurred images obtained were disregarded as the images still showed a significant portion of blur, so only the PSF information was kept. The maximum-likelihood estimation was based on image pixels with grey value larger than the median of all grey values in the image. This resulted in a significant increase in the stability of the algorithm as the cut suppresses background pixels for which a PSF estimation is meaningless. For each image in the stack, the width of the PSF along the x- and y-direction were then determined and averaged. Using the spatially averaged width, the mean PSF was subsequently determined from the 50% of images in the stack with smallest PSF width. As the image blur is most likely caused by optical diffraction or a none-perfect microscope focus, it is expected to be similar for all images in the stack. Therefore, the different stack-specific point-spread-functions have to be comparable. However, depending on the specific image, the maximum-likelihood optimisation approach might result in a local rather than a global minimum of the likelihood-function, resulting in a biased estimation of the PSF. In order to identify such spurious cases, the two-dimensional Pearson correlation coefficient, r, between each individual PSF and the average PSF was calculated. The image-specific point-spread-function was replaced by the average PSF for r<0.9. Finally, each image in the stack was deblurred using a Lucy-Richardson method [27] with the background-corrected image and the corresponding PSF as input. Figure 1 (a) shows a sample image acquired for calibration beads along with the estimated points-spread-function (b) and the correspondingly deblurred image (c). The increase in image sharpness is clearly visible.
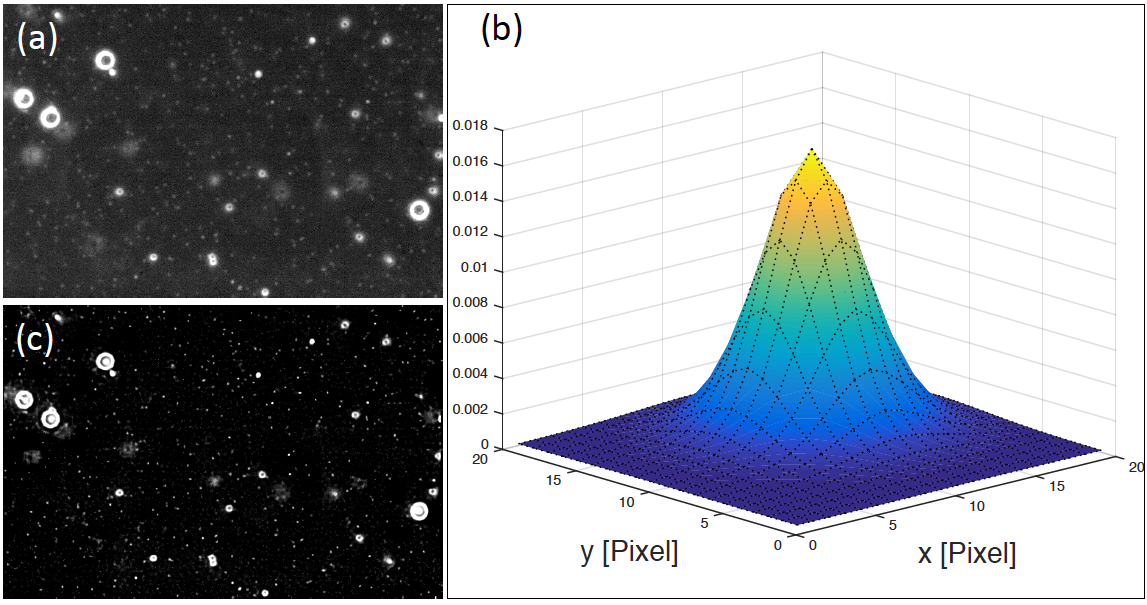
Figure 1.a) Original grayscale image from a solution of beads with diameters of 1.1μm and3μm, respectively. The corresponding maximum-likelihood estimated pointspreadfunction (PSF) is shown in (b). The x- and y-axis are shown in units of pixels where one pixels corresponds to 0.135μm. The deblurred and background-field corrected image is shown in (c). A significant increase in the image quality is visible.
The deblurred images were then segmented using the approach described in [12]. In short, a combination of grey-value threshold and binary labelling was employed to define the individual segments. Putative segments representing erythrocytes or leucocytes in real blood images were removed by employing the spherical geometry and their typical size, which is much larger than the size of platelets.
Finally, the outline of all segments was finally calculated using a Laplace of Gaussian edge detection filter.
For each segment, the following twelve parameters were determined: (1) the segment area; (2) the segment perimeter; (3) the fractal dimension of the segment border; (4) the circularity; (5) the average grey value and the (6) corresponding standard deviation; (7) the eccentricity of an ellipse which has the same second moments as the segment; (8) the diameter of a circle with the same area as the segment; (9) the ratio between the area of the region and the area of its bounding box; (10) the major and (11) minor axis length of the equivalent eclipse and (12) the solidity. The solidity defines the ratio between the segment area and the area of the corresponding convex hull.
Furthermore, the number of pseudopods, which are spear-like objects that are attached to the platelet body, was predicted using a supervised machine learning model which is based on the twelve parameters defined above as described in [17]. Finally, the same 12-parameter vector was used to predict a measure termed activation score using a linear regression model with bilinear interaction terms [17]. The activation score ranged between 0-100 and represents the overall degree of platelet activation. Using an expert classification of the platelet shape and morphology, the corresponding regression model was trained in order to predict the activation score on unknown samples. The complete description of the whole approach including its validation was already presented [17].
The whole analysis process was implemented using Matlab R2015a (MathWorks Inc., Natwick, USA).
Even though the current study was based on the examination of spherical calibration beads without any surface structure, the aim was the evaluation of the exact preparation and examination chain that is also employed for the analysis of real platelets. As one of the important steps in the analysis of platelets is the counting of the number of pseudopods for each platelet, the corresponding detection step is briefly described below.
The proper identification of pseudopods relies on the precise definition of the platelet body. As the thickness of the pseudopods is typically much smaller than the width of the body, all pixels that are located less than three pixels away from the segment border were temporarily removed, thereby significantly suppressing the pseudopod contribution from the segment image. Assuming that the majority of platelet bodies show a discoid shape, the parameters (location, orientation, major and minor axis length) of an ellipse with the same second-moments as the temporarily processed segment image were determined next. However, the corresponding ellipse is typically only an approximation to the correct body shape. In order to account for the specific body outline of each segment, the estimated ellipse was masked with the identified full segment. The resulting mask represents the estimated platelet body. Pseudopods were then identified by labelling the subtraction image of the full platelet mask and the body mask. Finally, spurious pseudopod segments with area <0.15 μm² or with significant overlap with pseudopod body (>35% of overlapping pixels) were removed from the resulting pseudopod mask. The remaining number of segments in the pseudopod mask defines the number of pseudopods for each platelet.
All slides were mounted on the microscope at identical x (= 40 mm)- and y (=110 mm)- positions of the table. The focus was set to the point mark on the coverslip. Each slide was examined once and one slide from the 3.0 and the mixed-bead solution respectively were examined five times. Therefore a total of 630 images were taken in 21 examination cycles. A total of 5347 outlines of different objects were segmented automatically from these images and the geometrical and fractal parameters described above were determined for each segment. The examinations of the slides from the 0.1 μm and 0.3 μm stock solutions did not yield any usable results and hence were discarded from the further analysis as discussed below. Therefore the presented results were based on the analysis of 5246 segments from 570 images from 19 examination cycles of 11 slides from three different stock solutions (1.1 μm, 3.0 μm and mixed beads).
First, all variables were tested for normal distribution using the Kolmogorov-Smirnov test. All tested variables exhibited a non-normal distribution (p<0.05). Thus, a non-parametric test for non-normally distributed samples was used. For two independent samples, we used the Mann-Whitney U-test, and for three or more groups, we used the Kruskal-Wallis test. For all tests, differences were considered significant when p-values were less than 0.05 (p<0.05), and highly significant when p-values were less than 0.001 (p<0.001). The continuous variables were presented as means and medians, while standard deviations and quartiles were chosen as a measure of dispersion. Statistical analysis was performed using SPSS Statistics 20.0 (IBM Corp., Armonk, NY).
Repeated measurements of the same slide showed the high reliability and reproducibility of the established measurement system (Figure 2). There were no significant differences (p<0.001) in the number of segmented beads as well as in all measured parameters such as area, perimeter, circularity and fractal dimension. Furthermore repeated measurements of different slides from the same solution showed only a slightly but still not significantly increased (p=0.014) variability of measurement results.
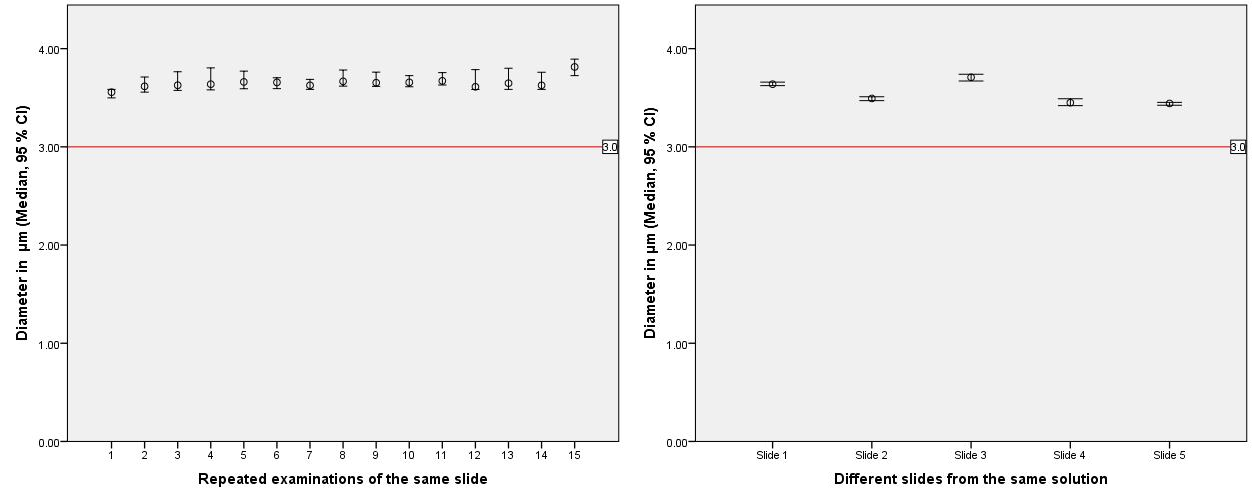
Figure 2.Left: Repeated examinations of the same slide showed no significant differences (in-slide-reproducibility, p<0.001), as well as the repeated examinations of different slides (right) from the same solution (inter-slidereproducibility, p=0.014).
Red Line: True diameter of examined beads.
Different sized beads could be clearly distinguished on slides from different stock solutions (Table 1) as well as on slides from the mixed beads solution by use of the diameter-circularity scatter diagram (Figure 3). Sharply focussed beads appear in dark field microscopy as a white ring with a dark center on a black background (Figure 4). The outer and the inner diameters of the first twenty 1.1 and 3.0 beads, respectively, which were considered by an expert to be sharply focused, were measured manually. The mean outer diameter was 1.68 ± 0.15 μm for 1.1 μm beads and 4.15 ± 0.14 μm for 3.0 μm beads. The width of the circular line was 1.18 ± 0.21 μm for 1.1 μm beads and 1.71 ± 0.07 μm for 3.0 μm beads. As the algorithmic analysis segments the outer border of objects, automatically segmented beads were considered to be sharply focussed, if the diameter calculated from the measurement data for area and perimeter by the use of the circle equations was equal or smaller than the mean manually measured outer diameter plus standard deviation (=1.83 μm for 1.1 μm beads and 4,29 μm for 3.0 μm beads). Hence, 37.8% (445) of the 1.1 μm beads and 92.7 % (1086) of the 3.0 μm beads were categorized as sharply focussed.
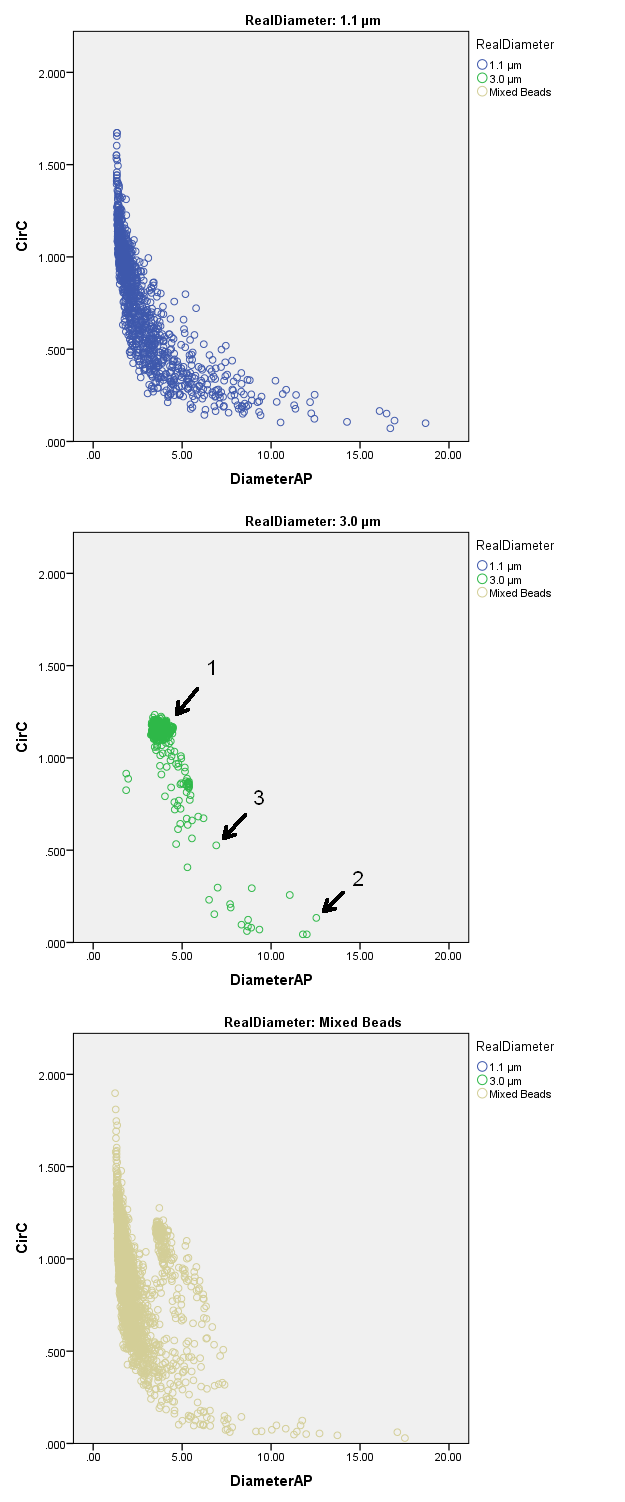
Figure 3.DiameterAP-circularity scatter diagrams for the different sized beads. 1.1 μmbeads (above) showed a higher scattering in circularity and diameter as compared to 3.0 μmbeads (middle) due to decreased sharpness and loss of focus. Nevertheless 1.1 μm beads and 3.0 μm beads could be clearly distinguished from each other in the case of the examination of the mixed bead solution (below). The arrows 1, 2 and 3 show the data points corresponding to the images of beads in figure 4.
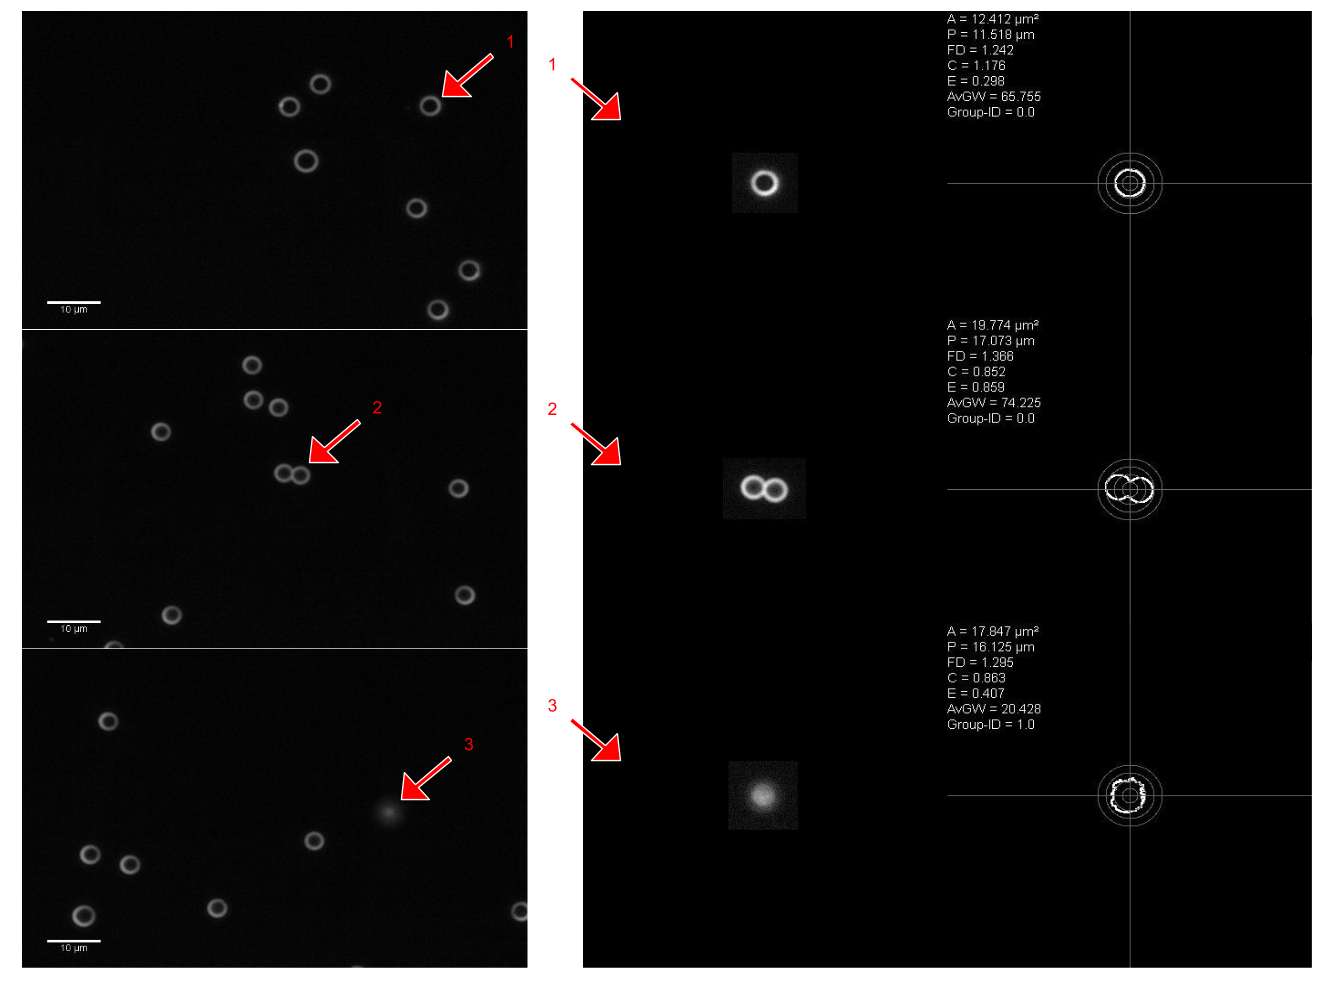
Figure 4.In darkfield microscopy 3 μm beads appear as a white ring with a dark center on a black background. By use of the diameterAP-circularity scatter diagram (Figure 3) different type of segments can be easily detected (arrows: 1: sharply focussed bead, 2: small aggregate, 3: bead out of focus). The right part of the figure shows the results of the automated algorithmic analysis. Contrast is enhanced and the outer circular line of the original bead(left) is detected. Different shape descriptors are automatically calculated.
Real Diameter |
1.1 µm |
3.0 µm |
Number of beads |
1177 |
1171 |
Area [µm²] |
3.05 (1.63-19.98) |
10.98 (9.68-16.01) |
Perimeter [µm] |
6.91 (4.2-29.54) |
10.98 (10.3-15.18) |
FD |
0.94 (0.77-1.12) |
0.90 (0.86-1.08) |
CirC |
0.83 (0.25-1.23) |
1.16 (0.91-1.19) |
AvGW |
18.86 (7.53-37.02) |
58.42 (35.85-74.93) |
StdGW |
6.76 (2.23-14.01) |
12.71 (7.37-22.87) |
Eccent |
0.65 (0.31-0.92) |
0.2 (0.1-0.38) |
EquivDia |
16.08 (12-39.62) |
29.27 (27.55-35.29) |
Extent |
0.62 (0.41-0.8) |
0.78 (0.72-0.8) |
MajorAxisL |
21.38 (12.77-60.51) |
29.61 (27.82-36.55) |
MinorAxis |
13.83 (10.42-37.2) |
29.01 (27.23-33.34) |
Solidity |
0.87 (0.62-0.98) |
0.98 (0.92-0.99) |
PredNPseudoPods |
0 (0-2.76) |
0 (0-0) |
PredActivationScore |
31.62 (17.94-78.22) |
25.95 (24-35.29) |
D(P) = Perimeter/π [µm] |
2.2 (1.34-9.4) |
3.49 (3.28-4.83) |
D(A) = 2 sqr(Area/π) [µm] |
1.97 (1.44-5.04) |
3.74 (3.51-4.51) |
Di(AP) = (D(A)+ D(P))/2 [µm] |
2.08 (1.4-7.21) |
3.61 (3.39-4.66) |
Table 1. Median (5.-95. percentile) values of geometric descriptors of 1.1 and 3.0 μm beads.
The upper part of the table shows the parameters directly measured from the segmented outlines of beads. The lower part shows parameters calculated from the measured values.
The smallest segmentable beads had a diameter of 1.1 μm. The analysis of slides from the 0.1 μm- and 0.3 μm- stock solutions did not yield any usable result as the images showed only background. Furthermore the evaluation of slides prepared from the mixed beads solution did not show beads smaller than 1.1 μm. The median predicted activation score was 31.62 for 1.1 μm beads and 25.95 for 3.0 μm beads. The median predicted activation score of the mixed beads solution was 26.46. The median fractal dimension of 1.1 μm beads was 0.94, of 3.0 μm beads was 0.90, of the mixed beads solution was 0.92 and the overall median fractal dimension was 0.91. The median circularity was 0.83 for 1.1, 1.16 for 3.0 and 0.97 for the mixed beads solution respectively. The median circularity of all beads was 1.01.
In 83.7% (84.9%) of all 3 μm (1.1 μm) beads, no pseudopod was detected. In contrast, a single pseudopod was measured in 7.6% and 13.0% of 3 μm and 1.1 μm beads, respectively. The remaining segments showed more than 1 pseudopod. The false detection rate was slightly higher when employing the multivariate model to predict the corresponding numbers. Here, 77.9 % of 3 μm beads were predicted to be free of pseudopods which is comparable to the result obtained for the 1.1 μm dataset (76.2 %). Still, in for both bead sizes, approx. 90% of all segments were predicted to have a maximum a single pseudopod. As shown above, a significant portion of segments was out of focus, which is reflected by the long tail in the circularity distribution (Figure 3). Therefore, if only segments with a circularity >0.8 were evaluated, both the direct measurement (98.0% of segments without detected pseudopods) and the multivariate prediction model (96.3% of segments without predicted pseudopods) performed much better.
The current study describes the validation of an automated and standardized procedure for the investigation of the morphometry of platelets. This new approach will significantly support future research on the physiological and pathophysiological meaning of PSC as it allows for the first time the almost fully automated and highly user independent evaluation of platelet shape. This is of particular interest, as platelets are regarded highly sensitive to preanalytical influencing factors. Hence, it is of peculiar importance to apply a robust and standardized examination system to suppress any bias introduced by the preparation and examination process. Furthermore, the system does not require specific user knowledge for its safe operation. This is a significant progress in the evaluation of platelet shape, as the imaging of platelet shape is currently still consuming, sophisticated and therefore cost-intensive and prone to systematic errors.
The presented results demonstrate that the established system has a high intra- and inter-slide reproducibility as well as a large detection rate of the particles solved freely in the examined solution. Up to 92.7% of the 3.0 μm beads were sharply focussed. For smaller particles the rate of focussed objects was significantly reduced. The system is able to clearly identify and separate smaller from larger particles. Furthermore doublets and small and large aggregates of particles can be identified as well as particles out of focus. This increases the informative value and validity of the examinations. We have previously shown [8], that with accurate focussing and exposure to light a higher resolution (approximately 0.2 μm) can be reached in darkfield microscopy. The impaired resolution in this study is based on the fixed focus and luminous intensity of the system. However, as the diameter of platelets is expected to be around 3 μm or larger, the established system should be appropriate for the automated analysis of platelet shape.
The median fractal dimension of perfect circles would be expected to be 1.0. The system underestimates this value for all three beads-lines by approximately 0.09. This is due to the immanent inaccuracy based on the finite pixel size of the used digital images in combination with the small size of the imaged objects. However, as this is an immanent error, this should not affect the comparison of relative values from structures segmented from the same pixel-size images. Hence, this issue should be further elaborated to find the best possible image dimensions according to accuracy and comparability on the one side and practicability on the other side.
We have observed circularity values C>1, especially for small segments. Even though C is theoretically constrained by a maximum of value of unity, the finite image resolution results in an increased perimeter/area ratio when platelets are small. In principle, it would have been possible to set all measurements exceeding 1 to C=1. However, this would bias all correlation measurements as points would cluster exactly at C=1. Therefore, we also allowed results with C>1, where one has to keep in mind that those values are simply due to the finite image resolution.
As only perfectly spherical objects without any surface structure were investigated in the current study, it provides an ideal test case to evaluate the performance of two different approaches to determine the number of pseudopods per segment. First, a multivariate model was trained using the geometrical parameters defined above to predict the corresponding number [12,17] whereas the second approach directly determines pseudopods from the images acquired for each segment. We have observed in the current study that both approaches work almost equally well with a slight advantage for the direct detection method. More than 90% of all segments were classified to have at most a single pseudopod with approx. 85% of all segments where free of pseudopods when employing the direct detection approach. Most importantly, however, it was demonstrated that the falsely classified segments had a significantly lower circularity than the correctly classified segments. As low circularity segments largely present out-of-focus objects as described above, the false detection rate is therefore dominated by imperfections of the image acquisition approach and to a much smaller extent by imperfections of both detection and prediction algorithm. Indeed, 98% (96.3%) of all high circularity objects were correctly measured (predicted) to be free of pseudopods, showing the high efficiency of both approaches to correctly determine the number of pseudopods in pseudopod-free objects. It should be noted, however, that this does not necessarily apply equally well to objects with real pseudopods and requires an extra validation study for such segments, which is outside the scope of the current article.
It has previously been demonstrated that shape changed platelets can be quantitatively described and categorized using darkfield microscopic images [12]. We have shown that parameters characterising the platelet shape allow for the sensitive characterisation of different activation states of platelets. This research is supported by the findings of Bianciardi and coworkers who have shown that platelets activated with thrombin [15] as well as platelets from diabetic patients [14] and from patients with primary hypercholesterolemia [13] showed significant differences in the fractal dimension of their outlines on electron microscopic images. Furthermore Canault et al. [28] found on fluorescence microscopic images that platelets from RASGRP2 knockout mice show a significantly reduced formation of filopodia during spreading on fibrinogen as compared to healthy subjects. However, darkfield microscopy offers some inherent advantages as compared to other microscopic techniques. As a low cost procedure which does not require staining or fixation of the samples, it is well suited to visualize living, unstained and unfixed platelets.
In summary, the current study described the evaluation of a highly automated and standardized darkfield microscopic measurement system that allows for the quantitative, reliable and reproducible examination of platelet shape. The system might be especially useful for the examination and quantification of possible preanalytical constraints in the imaging of shape changed platelets. Furthermore, as the system can be operated by a laboratory assistant without specific knowledge and it is suitable for the examination of slides at a higher throughput, it will enable and expedite the examination of PSC-features in larger cohorts of patients. Hence, this will improve our knowledge about the physiological and pathophysiological relevance of PSC.
2021 Copyright OAT. All rights reserv
- Maurer-Spurej E, Pfeiler G, Maurer N, Lindner H, Glatter O, et al. (2001) Room temperature activates human blood platelets. Lab Invest 81: 581-592. [Crossref]
- Michelson AD (2004) Platelet Function Testing in Cardiovascular Diseases. Circulation 110: e489-93. [Crossref]
- Paul BZ, Daniel JL, Kunapuli SP (1999) Platelet shape change is mediated by both calcium-dependent and -independent signaling pathways. Role of p160 Rho-associated coiled-coil-containing protein kinase in platelet shape change. J BiolChem 274: 28293-300. [Crossref]
- Jen, C.J., et al., (1996) Changes in cytosolic calcium concentrations and cell morphology in single platelets adhered to fibrinogen-coated surface under flow. Blood 87: 3775-82. [Crossref]
- Sudic D, Razmara M, Forslund M, Ji Q, Hjemdahl P, et al. (2006) High glucose levels enhance platelet activation: involvement of multiple mechanisms. Br J Haematol 133: 315-322. [Crossref]
- Gear ARL, Polanowska-Grabowska RK (2002) The platelet shape change, in Platelets in thrombotic and non-thrombotic disorders: pathophysiology, pharmacology and therapeutics, C.P.P. Paolo Gresele, Jos Vermylen, Editor. 2002, Cambridge University Press. p. 319-322.
- Schmidt V, Hilberg T, Franke G, Gläser D, Gabriel HH (2003) Paraformaldehyde fixation induces a systematic activation of platelets. Platelets 14: 287-294. [Crossref]
- Kraus MJ, Strasser EF, Eckstein R (2010) A New Method for Measuring the Dynamic Shape Change of Platelets. Transfus Med Hemother 37: 306-310. [Crossref]
- Zobel CR, Woods A (1983) Effect of calcium on the morphology of human platelets spread on glass substrates. Eur J Cell Biol 30: 83-92. [Crossref]
- White GC 2nd, Scarborough DE, Brinkhous KM (1983) Morphological study of early phases of platelet adhesion to foreign surfaces: effect of calcium. Ann N Y Acad Sci 416: 351-362. [Crossref]
- Rosenstein R, Zacharski LR, Allen RD (1981) Quantitation of human platelet transformation on siliconized glass: comparison of "normal' and "abnormal' platelets. Thromb Haemost 46: 521-524. [Crossref]
- Kraus MJ, Neeb H, Strasser EF (2014) Fractal and Euclidean descriptors of platelet shape. Platelets 25: 488-498. [Crossref]
- Bianciardi G, Aglianò M2, Volpi N2, Stefanutti C3 (2015) Geometric complexity identifies platelet activation in familial hypercholesterolemic patients. Microsc Res Tech 78: 519-522. [Crossref]
- Bianciardi G (2015) Platelet entropy is increased in type 2 diabetic patients. Int Angiol. [Crossref]
- Bianciardi G (2015) Geometric complexity is increased in in vitro activated platelets. Microsc Res Tech 78: 485-488. [Crossref]
- Bianciardi G, Tanganelli I (2014) Fractal analysis of circulating platelets in type 2 diabetic patients. Clin Hemorheol Microcirc. [Crossref]
- Neeb, H., et al. (2014) Active or Not-Machine-learning based Prediction of Platelet Activation. In: Proceedings of the World Congress on Engineering and Computer Science.
- Wang X, Becker FF, Gascoyne PR (2010) The fractal dimension of cell membrane correlates with its capacitance: a new fractal single-shell model. Chaos 20: 043133. [Crossref]
- Losa GA (2009) The fractal geometry of life. Riv Biol 102: 29-59. [Crossref]
- Mashiah A, Wolach O, Sandbank J, Uziel O, Raanani P, et al. (2008) Lymphoma and leukemia cells possess fractal dimensions that correlate with their biological features. Acta Haematol 119: 142-150. [Crossref]
- Bianciardi G, Tanganelli I, Totagiancaspro D, Brogi M, Carducci A, et al. (2006) Fractal analysis of monocytes in diabetes.Clin Hemorheol Microcirc 35: 269-272. [Crossref]
- Bianciardi G, Miracco C, De Santi MM, Luzi P (2003) Differential diagnosis between mycosis fungoides and chronic dermatitis by fractal analysis. J Dermatol Sci 33: 184-186. [Crossref]
- Losa GA (2002) Fractal morphometry of cell complexity. Riv Biol 95: 239-258. [Crossref]
- Luzi P, Bianciardi G, Miracco C, De Santi MM, Del Vecchio MT, et al. (1999) Fractal analysis in human pathology. Ann N Y Acad Sci 879: 255-257. [Crossref]
- Havlin S, Buldyrev SV, Goldberger AL, Mantegna RN, Ossadnik SM, et al. (1995) Fractals in biology and medicine. Chaos Solitons Fractals 6: 171-201. [Crossref]
- Neeb, H, Kraus MJ (2013) Grünwald Remagen Opensource Unified Platelet-Identification Tracker (GROUP-IT). [ZIP File containg six matlab scripts]. Available from: http://platelets.praxis-geiselgasteig.de/group_it.zip.
- Richardson, WH (1972) Bayesian-Based Iterative Method of Image Restoration. Journal of the Optical Society of America 62: 55-59.
- Canault M, Ghalloussi D, Grosdidier C, Guinier M, Perret C, et al. (2014) Human CalDAG-GEFI gene (RASGRP2) mutation affects platelet function and causes severe bleeding. J Exp Med 211: 1349-1362. [Crossref]