Abstract
Aim: We aimed to develop a simple and rapid method to detect anaplastic lymphoma kinase (ALK) fusion genes in lung cancer tissue, which is important in the treatment decision of lung cancer.
Materials and methods: A convenient PCR-based system was developed to detect the ALK fusion gene in RNA extracted from fixed lung tissue. This method detects rearranged gene transcripts in the RT-PCR product, using fluorescence-tagged DNA probes named "Quenching Probe" (Q-Probe) that undergo fluorescence quenching upon hybridization.
Results and conclusions: Of 17 ALK(+) and 18 ALK(-) surgical samples that were assayed, the results of 15 ALK(+) and 15 ALK(-) samples in which an internal control was detected were the same as those of fluorescence in situ hybridization (FISH), immunohistochemistry (IHC) and/or RT-PCR. Therefore, this system rapidly (within 2 hours) and sensitively detects ALK fusion. This rapid testing system may contribute to personalized medicine of lung cancer.
Key words
genetic diagnosis, ALK rearrangement gene, Non-small cell Lung cancer, Quenching Probe method, i-densy
Introduction
Lung cancer is the most common cause of death from cancer worldwide. Histologically, 85% of lung cancer is classified into non-small cell lung cancer (NSCLC). To date, major driver mutations that have been reported in lung adenocarcinoma include epidermal growth factor receptor (EGFR) mutation (~23%), KRAS mutation (~25%), anaplastic lymphoma kinase (ALK) rearrangement (~6%) and BRAF mutation (~3%) and these mutations are mutually exclusive.
The echinoderm microtubule-associated protein-like 4 (EML4) and ALK rearrangement gene (EML4-ALK) was reported first in 2007 [1]. Molecularly targeted drug such as crizotinib were shown to be very effective in ALK-rearrangement-positive lung cancer treatment [2].
To date, more than 10 patterns of fusion points for EML4-ALK [3-9] and other rearrangements have been reported [10-12] (Figure 1A). Several methods have been used to diagnose the presence of ALK rearrangement to select patients that would benefit from ALK inhibitors in a clinical context. Of these tests, fluorescence in situ hybridization (FISH)-based clinical tests and immunohistochemistry (IHC), RT-PCR have been widely adopted.
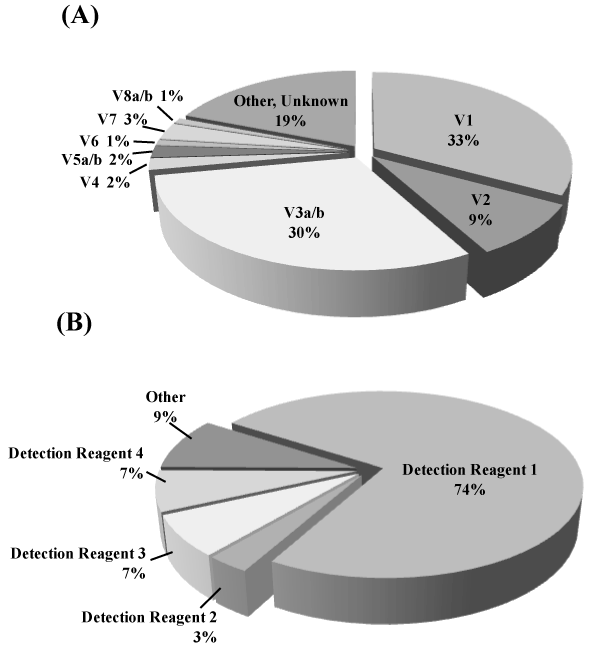
Figure 1.Frequency of NSCLC driver mutations and ALK Variants in NSCLC
(A) Distribution of ALK rearrangement variants. Of these variants, V1, V2 and V3a/b are the major variants.
(B) Percentage of ALK variants detectable with the detection mixtures that we developed. It is possible to detect close to 80% of the ALKrearrangement genes using Detection mixture 1. This system is designed so that a number of detection mixtures can be used together, resulting in the detection of more than 90% of ALKrearrangement gene variants.Since ALKrearrangement gene variants have been discovered in rapid succession, there are some variants that are impossible to detect with the current system. Such variants are depicted as "Other" in the pie chart.
There have been several reports that indicated lack of concordance between FISH, IHC, and RT-PCR in detecting ALK fusion genes [13-16]. FISH and IHC have the advantage of detecting unknown rearrangement, and the disadvantage that the results of the diagnosis may vary due to analyst bias. RT-PCR has high sensitivity and specificity, is free from analyst bias. However it cannot detect unknown rearrangements and requires complicated multiplex PCR or multiple times of PCR reaction.
Here, we have developed a system that can easily measure more than 15 ALK variants in about 2 hours using purified RNA without complicated preparation. This system automatically dispenses reagents, performs the reverse transcription and PCR reactions, and detects target using fluorescence. All the operator needs to do is set the machine and add the reagents and samples.
Materials and methods
Collection of patient samples and sample treatment
A total of 35 surgical specimen-derived formalin-fixed paraffin-embedded (FFPE) tissue samples; 17 ALK rearrangement gene positive samples (labeled Positive-1 to Positive-17) and 18 negative samples (labeled Negative-1 to Negative-18) were provided by the National Cancer Center Hospital (Tokyo, Japan) as part of a joint research project (CH25028). Written informed consent was obtained from all participants for the use of their samples. The specimens had been clinically diagnosed before their provision to us and were stored in the National Cancer Center biobank. A piece of 10 µm thick FFPE tissue was prepared for extraction of total RNA. Total RNA samples were obtained using the RNeasy FFPE Kit (Qiagen Inc., Hilden, Germany) according to the instructions. Total RNA was extracted using 30 µL of RNase-free Water. Specimens were stored at -80°C until measurement.
Detection and analysis of ALK fusion genes using i-densy and the Q-Probe
Easy genetic analysis using i-densy (Arkray, Inc., Kyoto, Japan), a fully automated genetic analysis system, and the fluorescently-labeled Quenching Probe (Q-Probe, Nippon Steel Kankyo Engineering Co., Ltd., Tokyo, Japan) has already been reported [17]. Each channel of the i-densy system can detect 3 different wavelengths. The fluorescent pigments used to label the Q-Probe were PACIFIC BLUE, BODIPY FL, and TAMRA. A mixture of the ALK fusion gene specific Q-Probe, the primer for amplification of each specific sequence and reverse transcriptase (SuperScriptIII; Invitrogen, Carlsbad, CA, USA) was placed in the well of an i-densy Pack UNIVERSAL (Arkray, Inc.) that contained DNA polymerase, nucleotides, and other reagents necessary for the polymerase chain reaction. The purified RNA sample was added to the reaction tube, using more than 2 ng RNA/test. The reverse transcription was performed at 55°C for 15 minutes. Cycling conditions were as follows, reaction was incubated at 95°C for 2 minutes followed by 50 cycles of 1 second at 95°C and 30 seconds at 58°C. After PCR, the melting curves of the products were acquired as follows; 1 second at 95°C, 1 minutes at 40°C and 1°C steps with a hold of 3 seconds at each step from 40°C to 75°C. The i-densy Pack UNIVERSAL and the reaction tube were set into the i-densy machine for measurement, about 2 hours later, the presence or absence of an ALK fusion gene could be determined. Seventeen types of ALK fusion genes as well as the internal control, the TATA-binding protein (TBP), can be specifically detected in this system by using four types of detection mixtures. The detection mixture 1 was set to enable the measurement of all high frequency mutations (e.g. V1, V2, V3a/b). Table 1 shows the variants of the ALK fusion gene that are detectable using each detection mixture (Table 1). Detection mixture 1 contains 8 primers and 3 Q-Probes, mixture 2 contains 6 primers and 2 Q-Probes, mixture 3 contains 5 primers and 2 Q-Probes and mixture 4 contains 6 primers and 1 Q-Probe. Reverse primers were used for both reverse transcription and target amplification. Sequence information of the primers and probes are supplied in Table S1.
Table 1.Variants of ALK fusion genes detectable using each detection mixture and fluorescent pigment-labeled probe. The use of 4 different detection mixtures makes it possible to detect more than 15 variants of ALK gene fusion.
Detection
Mixture-1 |
BODIPY FL : EML4-ALK V1(E13; A20), V2(E20; A20), V3a/b(E6a/b; A20) |
|
TAMRA : EML4-ALK V6(E13; ins69 A20) |
|
Pacific Blue : Internal Control (TATA-Binding Protein, TBP) |
|
Detection
Mixture-2 |
BODIPY FL : EML4-ALK V4(E15; A20) |
|
TAMRA : EML4-ALK V8a(E17; ins 30 A20), V8b(E17; ins 95 A20) |
|
Detection
Mixture-3 |
BODIPY FL :
EML4-ALK V5a(E2; A20), V5b(E2; ins 17 A20), V7(E14; del 12 A20), V5'(E18; A20) |
|
| |
Detection
Mixture-4 |
BODIPY FL : |
|
KIF5B-ALK (K15; A20), (K17; A20), (K15; A20), |
|
TFG-ALK (T3; A20), KLC1-ALK (K9; A20) |
|
The measurement results were analyzed using the area analysis software, MEQNET iDia (Arkray, Inc.), which set the area value thresholds for the internal control and for ALK rearrangement gene measurements for each detection reagent (Table 2, top of row). For internal standard measurements, the area threshold was used to determine whether the reaction was working correctly. For ALK rearrangement gene measurements, the area value threshold was used to judge the presence (positive value; calculated ALK rearrangement gene peak area greater than the area value threshold) or absence (negative value; peak area less than the area value threshold) of the gene.
Table 2. Summary of area value analysisdetection mixture and fluorescent pigment-labeled probe
|
Detection mixture 1 |
Detection mixture 2 |
Detection mixture 3 |
Detection mixture 4 |
|
Pacific Blue |
BODIPY FL |
TAMRA |
BODIPY FL |
TAMRA |
BODIPY FL |
BODIPY FL |
|
Internal Control |
V1, V2 or V3 a/b |
V6 |
V4 |
V8 a/b |
V5a/b, V5' or V7 |
KIF5B, TFG or KLC1-ALK |
Area Threshold |
16.5 |
14.4 |
13.8 |
42.0 |
10.5 |
36.7 |
19.4 |
Negative-1 |
10.4 |
3.4 |
9.3 |
7.0 |
4.2 |
0.1 |
4.9 |
Negative-2 |
21.7 |
8.2 |
3.0 |
4.7 |
5.0 |
1.4 |
2.5 |
Negative-3 |
22.0 |
11.0 |
7.3 |
17.4 |
0.3 |
0.0 |
15.1 |
Negative-4 |
3.6 |
2.0 |
2.7 |
3.6 |
0.0 |
1.5 |
10.3 |
Negative-5 |
45.0 |
1.8 |
4.6 |
26.8 |
2.3 |
0.0 |
14.3 |
Negative-6 |
8.4 |
0.0 |
6.0 |
7.0 |
3.9 |
1.2 |
1.8 |
Negative-7 |
70.2 |
2.4 |
11.4 |
9.8 |
0.0 |
1.0 |
0.5 |
Negative-8 |
51.0 |
0.0 |
2.0 |
23.3 |
0.8 |
5.0 |
1.0 |
Negative-9 |
23.0 |
0.0 |
2.0 |
2.6 |
8.6 |
6.8 |
3.2 |
Negative-10 |
55.0 |
0.0 |
2.0 |
11.7 |
5.5 |
2.2 |
11.5 |
Negative-11 |
46.0 |
0.8 |
1.5 |
11.5 |
1.3 |
1.0 |
3.0 |
Negative-12 |
22.0 |
3.2 |
2.9 |
24.5 |
1.0 |
9.0 |
9.2 |
Negative-13 |
43.5 |
0.3 |
1.3 |
5.3 |
2.4 |
2.2 |
1.7 |
Negative-14 |
34.0 |
0.6 |
1.0 |
15.7 |
1.1 |
0.4 |
5.6 |
Negative-15 |
72.0 |
0.1 |
2.4 |
10.8 |
2.6 |
0.0 |
1.8 |
Negative-16 |
57.0 |
1.2 |
5.4 |
0.3 |
2.9 |
13.9 |
9.1 |
Negative-17 |
53.5 |
5.0 |
10.8 |
0.8 |
1.8 |
1.4 |
8.4 |
Negative-18 |
61.0 |
12.1 |
2.2 |
0.7 |
2.4 |
4.3 |
1.9 |
Positive-1 |
31.0 |
276.2 |
0.8 |
8.9 |
0.4 |
0.0 |
0.0 |
Positive-2 |
28.0 |
177.0 |
1.8 |
15.2 |
4.6 |
0.4 |
1.1 |
Positive-3 |
20.5 |
78.2 |
5.0 |
3.4 |
2.6 |
0.0 |
4.6 |
Positive-4 |
18.5 |
255.2 |
7.2 |
7.3 |
0.4 |
1.2 |
0.0 |
Positive-5 |
20.5 |
133.5 |
5.2 |
8.9 |
2.2 |
2.7 |
0.0 |
Positive-6 |
39.0 |
171.0 |
6.4 |
14.6 |
0.0 |
0.0 |
1.9 |
Positive-7 |
3.0 |
2.5 |
0.0 |
7.9 |
3.3 |
5.6 |
7.0 |
Positive-8 |
40.5 |
311.0 |
4.4 |
8.9 |
1.1 |
0.2 |
1.7 |
Positive-9 |
45.0 |
0.0 |
11.2 |
14.0 |
0.4 |
659.6 |
2.3 |
Positive-10 |
22.0 |
455.0 |
3.0 |
5.4 |
1.0 |
1.3 |
2.6 |
Positive-11 |
23.0 |
45.5 |
1.0 |
6.2 |
4.2 |
3.4 |
9.0 |
Positive-12 |
15.0 |
33.2 |
6.0 |
37.3 |
3.5 |
2.0 |
5.0 |
Positive-13 |
38.0 |
12.8 |
0.6 |
3.8 |
4.5 |
0.9 |
3.7 |
Positive-14 |
60.0 |
375.0 |
6.7 |
11.8 |
3.9 |
4.3 |
6.7 |
Positive-15 |
49.0 |
424.0 |
0.2 |
15.8 |
1.1 |
1.4 |
0.3 |
Positive-16 |
26.5 |
2.2 |
7.6 |
5.2 |
2.0 |
328.8 |
0.0 |
Positive-17 |
81.5 |
76.5 |
5.5 |
0.3 |
0.0 |
0.0 |
0.7 |
- The measurement data obtained was analyzed using the MEQNET iDia software to give separate area values for each reagent.
- The value written in the uppermost row was set as the threshold value. Area values greater than this value were considered as positive and are indicated in bold text.
- Reactions were regarded as "not evaluable" if the internal control area value was less than the threshold value.
nCounter analyses
For nCounter analysis, RNA was extracted from FFPE tissue sections (5 µm thick) using the RNeasy FFPE kit (Qiagen). RNA was quantified using the Nanodrop 8000 (Thermo Scientific, Wilmington, DE, USA). The nCounter system, a multiplex fluorescence-based platform for the counting of specific mRNA molecules without PCR amplification [18], was used to detect ALK rearrangement of the sample with the sample ID, Positive-13. Capture and reporter probes that hybridize with the ALK-rearrangement mRNA sequence as well as those for quantification of the 5’ and 3’ portions of wild-type ALK mRNA were custom-designed as shown in Table S2 and were synthesized by NanoString Technologies (Seattle, WA, USA). nCounter assays were performed according to the manufacturer’s protocol. In brief, 100 ng of total RNA was hybridized to nCounter probe sets for 16 hours at 67°C. Samples, consisting of sample ID. Positive-13 and 11 other lung cancer RNA samples were processed using an automated nCounter Sample Prep Station (NanoString Technologies, Inc.). Cartridges containing immobilized and aligned reporter complexes were subsequently imaged on an nCounter Digital Analyzer (NanoString Technologies, Inc.) set at 555 fields of view. Reporter counts were collected and normalized using NanoString’s nSolver analysis software version 2.0.
The data were normalized by two steps. First, six positive internal controls were used to remove potential systemic differences between individual hybridization experiments. The sum of the intensity (Si) of the six positive control probes was calculated for sample i and was then scaled by the normalization factor Smean/Si. Second, the scaled intensity of sample i was further normalized using four housekeeping genes to remove any effect that might be attributed to differences in, for example, the amount of input RNA. If Hi is the gene for sample i, the second normalization factor was then defined as Hmean/Hi.. The presence of ALK fusion was judged based on the ALK 5’/3’ molecule ratios and fusion-mRNA detection. A fusion was judged to be positive if the 5’/3’ expression ratio was less than 0.1 or if the counts of at least one fusion probe were more than 100.
Results
Detection of ALK rearrangement by the Q-Probe method
ALK rearrangement gene variants of 35 samples from which total RNA was extracted from FFPE surgically resected specimens were measured with the i-densy system using detection mixtures 1 to 4 (Table 1). Since the reagents that we developed are RT-PCR based, our system can detect high frequency variants such as EML4-ALK variant1, variant2, and variant3a/b using only detection mixture-1 (Figure 1B).
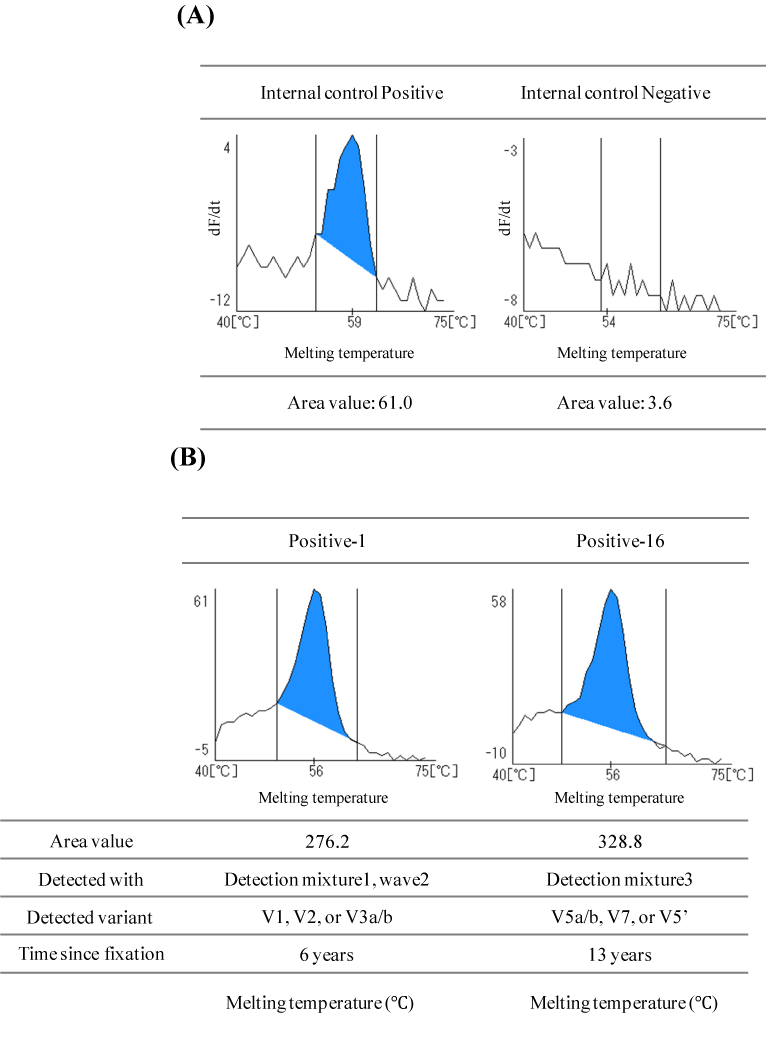
Figure 2. Example of detection of the TATA-binding protein used as an Internal Controlfor RNA quality and ALK rearrangement
(A) The TATA-binding protein (TBP) was detected as an internal control using detection mixture 1. The depicted results are shown at wavelength 1 (Pacific Blue).
Left: Example of positive detection of the internal TBP control in the measurement of ALK Negative-18. The top of the peak is seen between 59-61°C. The graph shows the top of the peak at 59°C. The calculated area value was 61.0, which exceeds the threshold value of 16.5.
Right: Example of negative detection of the internal TBP control in the measurement if ALK Negative-4. No clear peak was observedand the calculated area value was 3.6, which is below the threshold value of 16.5.
(B) Analysis of samples Positive-1 (left) and Positive-16 (right). ALKrearrangement positive peaks were obtained for both samples. The measurement results of all samples are shown in supplemental Figure 1.
In general, RNA extracted from FFPE tissue is fragmented due to formalin fixation [19], in order to check the degradation level of the extracted RNA, a primer and a probe for the detection of TBP were added to detection mixture 1 as an internal control. When an ALK rearrangement gene is not detected, detection of TBP can be used as an indicator of whether the ALK rearrangement gene status of the specimen was truly negative or whether it was simply impossible to detect mutations due to the poor quality of the RNA. Examples of positive and negative TBP detection are shown in Figure 2A. To determine whether the sample was negative or positive for the internal control and ALK rearrangement, we used the area value threshold, which was set based on negative control measurements. For the internal control, the area threshold was set at 16.5. The graph on the left in Figure 2A shows an area value of 61.0 for the internal control, which was therefore judged as "Positive" (meaning that the measurement system is working). If the area value of the internal control was less than the threshold value, it was regarded as "not evaluable" as on the right side of Figure 2A, the graph shows an area value of 3.6, which indicates that the sample is "not evaluable". A summary of the results of measurement of the area value of each sample is shown in Table 2. None of the 18 negative samples showed peaks of ALK rearrangement genes when assayed by the i-densy (graphs of the measurement results of samples Negative-1 to Negative-18 using i-densy are indicated in Figure S1A), which means that there was no false positive result (Table 2). However, TBP that was used as an internal control was negative in 3 of these 18 samples, suggesting that the RNA of these 3 samples was probably highly degraded.
When the i-densy was used to measure samples that were ALK rearrangement gene positive, 15 out of the 17 samples were positive for the internal control and 14 out of these 15 samples were ALK rearrangement positive. These results were the same as those obtained using the reference method. Table 2 summarizes the area value calculated using detection mixtures 1, 2, 3 and 4, which was used to judge whether the sample was negative or positive for ALK rearrangement (graphs of the measurement results of samples Positive-1 to Positive-17 using i-densy are shown in Figure S1B).
The i-densy results of two ALK rearrangement gene positive samples are shown in Figure 2 (B). When measuring the Positive-1 sample on the left, the peak of the Q-probe labeled with BODIPY FL was detected at 56°C using detection mixture 1 and the area value was 276.2. This result proves that the Positive-1 sample has a V1, V2, or V3 a/b ALK rearrangement. This sample was also found to have a V1 ALK fusion gene by using the reference FISH and RT-PCR analysis (data not shown), the Q-Probe method and the reference method are perfectly consistent with each other. As another example, for sample Positive-16 on the right in Figure 2B, the peak of the Q-probe labeled with BODIPY FL was detected at 56°C when using detection mixture 3 and the area value was 328.8, which proves that the Positive-16 sample has an ALK rearrangement variant 5 a/b, variant 7, or variant 5’. Surprisingly, the Positive-16 sample was formalin-fixed and paraffin-embedded about 13 years ago, indicating that our system could detect an ALK rearrangement gene from such an old sample. Table 3 shows the overall concordance of the i-densy results with the reference results (Table 3A) as well as the individual results of all of the ALK rearrangement-negative and positive samples (Table 3B and 3C), respectively in terms of detection of the internal control, the ALK-rearrangement status concordance with the reference analysis, and the time since fixation.
Table 3.Results of measurements of ALK rearrangement status using the Q-Probe method.ALK rearrangement negative and positive samples were determined based on previous FISH and/or RT-PCR analysis. The results indicated as "Not evaluable" in (B) and (C) are results of samples in which the internal control was not detected.
|
Internal control detected |
Concordance with reference
of Internal control (+) |
ALK Negative |
15/ 18 |
15 / 15 |
(n=18) |
(83.3% detectable) |
(100% concordance) |
ALK Positive |
15 / 17 |
14 / 15 |
(n=17) |
(88.2% detectable) |
(93.3% concordance) |
Total |
30 / 35
(85.7% detectable) |
29 / 30
(96.6% concordance) |
(A) Concordance rate of ALK (-/+) samples analyzed using the Q-Probe method with the results of the reference method. Fifteen Negative samples in which an internal control could be detected did not show peaks of an ALK rearrangement gene, which means that there was no false positive result. When ALK rearrangement gene positive samples were measured, 15 out of 17 were positive for the internal control and 14 out of these 15 showed the same ALK rearrangement results as those obtained using the reference method.
(B) Results ofi-densy analysis of ALK rearrangement negative samples.
Samples |
Internal
Control |
ALK fusion gene |
Time since fixation
(years) |
Negative-1 |
- |
not evaluable |
8 |
Negative-2 |
+ |
Negative |
7 |
Negative-3 |
+ |
not evaluable |
8 |
Negative-4 |
- |
not evaluable |
8 |
Negative-5 |
+ |
Negative |
12 |
Negative-6 |
- |
not evaluable |
8 |
Negative-7 |
+ |
Negative |
6 |
Negative-8 |
+ |
Negative |
12 |
Negative-9 |
+ |
Negative |
15 |
Negative-10 |
+ |
Negative |
7 |
Negative-11 |
+ |
Negative |
6 |
Negative-12 |
+ |
Negative |
12 |
Negative-13 |
+ |
Negative |
7 |
Negative-14 |
+ |
Negative |
8 |
Negative-15 |
+ |
Negative |
8 |
Negative-16 |
+ |
Negative |
6 |
Negative-17 |
+ |
Negative |
10 |
Negative-18 |
+ |
Negative |
7 |
(C) Results of i-densy analysis of ALK rearrangement positive samples. ALK rearrangement was not detected in sample Positive-13 even though the internal control was detected and the measurement system was working.
Samples |
Internal
Control |
ALK fusion gene |
Time since fixation
(years) |
Positive-1 |
+ |
Positive |
6 |
Positive-2 |
+ |
Positive |
7 |
Positive-3 |
+ |
Positive |
12 |
Positive-4 |
+ |
Positive |
11 |
Positive-5 |
+ |
Positive |
10 |
Positive-6 |
+ |
Positive |
8 |
Positive-7 |
- |
not evaluable |
8 |
Positive-8 |
+ |
Positive |
11 |
Positive-9 |
+ |
Positive |
8 |
Positive-10 |
+ |
Positive |
10 |
Positive-11 |
+ |
Positive |
12 |
Positive-12 |
- |
not evaluable |
11 |
Positive-13 |
+ |
Negative |
6 |
Positive-14 |
+ |
Positive |
5 |
Positive-15 |
+ |
Positive |
2 |
Positive-16 |
+ |
Positive |
13 |
2021 Copyright OAT. All rights reserv
Positive-17 |
+ |
Positive |
11 |
Two of the 17 ALK rearrangement positive samples were determined as "not evaluable", while 14 of the other 15 samples showed the same results as those obtained using the Q-Probe and reference methods.
To summarize the results of the measurements, out of the total 35 samples assayed, the measurement system was shown to work for 30 samples. Among the samples measurement worked, the concordance rate with the reference analysis was 96.6%. Sensitivity and Specificity was 93.3% and 100.0%, respectively (Table 3A). Only in the case of sample No. “Positive-13” was it impossible to detect ALK rearrangement using the Q-Probe method.
Re-Measurement of the mismatch sample using the nCounter system
We therefore tried to analyze sample No. “Positive-13” using the nCounter system. For examination of the presence of ALK rearrangements in this sample using nCounter, ALK rearrangements were detected by counting known EML4-ALK, KIF5B-ALK, and TFG-ALK rearrangement variant mRNAs and by determination of the imbalance of 5 and 3’ ALK mRNA molecules. The 5’/3’ expression ratio of ALK mRNA was 0.01, while significant levels of known ALK-rearrangement variant mRNAs were not detected. Therefore, this sample was considered to have ALK rearrangement, where the ALK rearrangement partners are not the EML4, KIF5B, or TFG genes.
The Q-Probe method predicts ALK gene rearrangements that have already been reported, based on the presence or absence of fluorescent peaks. Even if the amount of TBP RNA is not enough or if the RNA is highly degraded, as long as there is a sufficient amount of ALK rearrangement gene RNA present, it can be detected with this method.
Discussion
This ALK rearrangement gene measurement system using the Q-Probe method yields highly consistent results that are highly concordant with the reference method used and that do not show false positives. This system offers an easy and rapid system for the detection of ALK rearrangement genes that requires a minimal number of technical experiments and small amount of sample. If ALK rearrangement genes can be detected easily and rapidly together with EGFR mutations (e.g. L858R, Exon19 deletion mutations), these findings could contribute significantly to the quick determination of treatment regimens.
ALK rearrangement was not detected in the case No. “Positive-13” even though the internal control was detected by the Q-probe method. Although ALK rearrangement was detected in this sample by nCounter analysis, such analysis could not identify a partner of ALK. The inability to detect an ALK partner is probably because the ALK variant was a variant that could not be detected by any of the 4 detection mixtures of the Q-Probe method or by the nCounter method. To date, EML4, KIF5B, TFG, KLC1, protein tyrosine phosphatase nonreceptor Type 3 (PTPN3) [20], and huntingtin interacting protein 1 (HIP1) [21] have been reported as ALK rearrangement partners. It is not possible to detect ALK-PTPN3 or HIP1-ALK using the current design of the detection mixtures 1 to 4 or the nCounter reagent. It is also not possible to detect other unknown ALK rearrangement partners and points by using the Q-Probe method.
Recently, high-throughput sequencing using next generation sequencer technology is commonly being used in research settings for analysis of variant gene sequences. However, as the latter procedure requires a large amount of time and effort, this method is still not appropriate for use in clinical settings.
In contrast, the i-densy method is easy to operate, and is a rapid and simple analytical method. Our system might be used to confirm diagnosis rather than as a screening test for detection of ALK rearrangement in a clinical setting. Furthermore, if the sequence of a novel ALK rearrangement is known, it is possible to detect this rearrangement by adding specific primers and probes to the i-densy system for its detection.
Variants of ALK rearrangement genes have been discovered in rapid succession, and therefore test technology must be improved to treat each patient appropriately. It is known that ALK rearrangement gene positive patients respond well to crizotinib treatment. However, secondary ALK mutations that cause resistance to crizotinib, such as ALK L1196M [22], V1180T, and I1171T [23], have been reported in recent years. These mutations have been found in NSCLC patients who received crizotinib therapy. New ALK inhibitors such as ceritinib [24] and alectinib [25,26] have been developed for patients with crizotinib resistant mutations. Since the methods for treating lung cancer attributed to ALK rearrangement genes are advancing rapidly, it is therefore necessary for diagnostic systems to detect mutations more reliably. The Q-Probe method that can specifically detect mutations can also detect point mutations as stated above [17]. These are the reasons why we believe that the system using the Q-Probe method that we have just presented can contribute to the rapid advancement of personalized medicine.
Acknowledgements
We thank Moeko Ohishi for technical advice.
Financial & competing interests disclosure
Marifu Yamagishi and Mitsuharu Hirai are employees of ARKRAY, Inc. The authors have no other relevant affiliations or financial interest in or financial conflict with the subject matter or materials discussed in the manuscript apart from those disclosed.
References
- Soda M, Choi YL, Enomoto M, Takada S, Yamashita Y, et al. (2007) Identification of the transforming EML4-ALK fusion gene in non-small-cell lung cancer. Nature 448: 561-566. [Crossref]
- Kwak EL, Bang YJ, Camidge DR, Shaw AT, Solomon B, et al. (2010) Anaplastic lymphoma kinase inhibition in non-small-cell lung cancer. N Engl J Med 363: 1693-1703. [Crossref]
- Choi YL, Takeuchi K, Soda M, Inamura K, Togashi Y, et al. (2008) Identification of novel isoforms of the EML4-ALK transforming gene in non-small cell lung cancer. Cancer Res 68: 4971-4976. [Crossref]
- Takeuchi K, Choi YL, Soda M, Inamura K, Togashi Y, et al. (2008) Multiplex reverse transcription-PCR screening for EML4-ALK fusion transcripts. Clin Cancer Res 14: 6618-6624. [Crossref]
- Koivunen JP, Mermel C, Zejnullahu K, Murphy C, Lifshits E, et al. (2008) EML4-ALK fusion gene and efficacy of an ALK kinase inhibitor in lung cancer. Clin Cancer Res 14: 4275-4283. [Crossref]
- Wong DW, Leung EL, So KK, Tam IY, Sihoe AD, et al. (2009) The EML4-ALK fusion gene is involved in various histologic types of lung cancers from nonsmokers with wild-type EGFR and KRAS. Cancer 115: 1723-1733. [Crossref]
- Takeuchi K, Choi YL, Togashi Y, Soda M, Hatano S, et al. (2009) KIF5B-ALK, a novel fusion oncokinase identified by an immunohistochemistry-based diagnostic system for ALK-positive lung cancer. Clin Cancer Res 15: 3143-3149. [Crossref]
- Takahashi T, Sonobe M, Kobayashi M, Yoshizawa A, Menju T, et al. (2010) Clinicopathologic features of non-small-cell lung cancer with EML4-ALK fusion gene. Ann Surg Oncol 17: 889-897. [Crossref]
- Sanders HR, Li HR, Bruey JM, Scheerle JA, Meloni-Ehrig AM, et al. (2011) Exon scanning by reverse transcriptase-polymerase chain reaction for detection of known and novel EML4-ALK fusion variants in non-small cell lung cancer. Cancer Genet 204: 45-52. [Crossref]
- Wong DW, Leung EL, Wong SK, Tin VP, Sihoe AD, et al. (2011) A novel KIF5B-ALK variant in nonsmall cell lung cancer. Cancer 117: 2709-2718. [Crossref]
- Hernández L, Beà S, Bellosillo B, Pinyol M, Falini B, et al. (2002) Diversity of genomic breakpoints in TFG-ALK translocations in anaplastic large cell lymphomas: identification of a new TFG-ALK(XL) chimeric gene with transforming activity. Am J Pathol 160: 1487-1494. [Crossref]
- Togashi Y, Soda M, Sakata S, Sugawara E, Hatano S, et al. (2012) KLC1-ALK: a novel fusion in lung cancer identified using a formalin-fixed paraffin-embedded tissue only. PLoS One 7: e31323. [Crossref]
- Cabillic F, Gros A, Dugay F, Begueret H, Mesturoux L, et al. (2014) Parallel FISH and immunohistochemical studies of ALK status in 3244 non-small-cell lung cancers reveal major discordances. J Thorac Oncol 9: 295-306. [Crossref]
- Teixidó C, Karachaliou N, Peg V, Gimenez-Capitan A, Rosell R (2014) Concordance of IHC, FISH and RT-PCR for EML4-ALK rearrangements. Transl Lung Cancer Res 3: 70-74. [Crossref]
- von Laffert M, Stenzinger A, Hummel M, Weichert W, Lenze D, et al. (2015) ALK-FISH borderline cases in non-small cell lung cancer: Implications for diagnostics and clinical decision making. Lung Cancer 90: 465-471. [Crossref]
- Wallander ML, Geiersbach KB, Tripp SR, Layfield LJ (2012) Comparison of reverse transcription-polymerase chain reaction, immunohistochemistry, and fluorescence in situ hybridization methodologies for detection of echinoderm microtubule-associated protein-like 4-anaplastic lymphoma kinase fusion-positive non-small cell lung cancer. Arch Pathol Lab Med 136: 796-803. [Crossref]
- Suzuki S, Komori M, Hirai M, Ureshino N, Kimura S (2012) Development of a novel, fully-automated genotyping system: principle and applications. Sensors (Basel) 12: 16614-16627. [Crossref]
- Lira ME, Kim TM, Huang D, Deng S, Koh Y, et al. (2013) Multiplexed gene expression and fusion transcript analysis to detect ALK fusions in lung cancer. J Mol Diagn 15: 51-61. [Crossref]
- Liu H, Huang X, Zhang Y, Ye H, El Hamidi A, et al. (2002) Archival fixed histologic and cytologic specimens including stained and unstained materials are amenable to RT-PCR. Diagn Mol Pathol 11: 222-227. [Crossref]
- Jung Y, Kim P, Jung Y, Keum J, Kim SN, et al. (2012) Discovery of ALK-PTPN3 gene fusion from human non-small cell lung carcinoma cell line using next generation RNA sequencing. Genes Chromosomes Cancer 51: 590-597. [Crossref]
- Fang DD, Zhang B, Gu Q, Lira M, Xu Q, et al. (2014) HIP1-ALK, a novel ALK fusion variant that responds to crizotinib. J Thorac Oncol 9: 285-294. [Crossref]
- Choi YL, Soda M, Yamashita Y, Ueno T, Takashima J, et al. (2010) EML4-ALK mutations in lung cancer that confer resistance to ALK inhibitors. N Engl J Med 363: 1734-1739. [Crossref]
- Katayama R, Friboulet L, Koike S, Lockerman EL, Khan TM, et al. (2014) Two novel ALK mutations mediate acquired resistance to the next-generation ALK inhibitor alectinib. Clin Cancer Res 20: 5686-5696. [Crossref]
- Shaw AT, Kim DW, Mehra R, Tan DS, Felip E, et al. (2014) Ceritinib in ALK-rearranged non-small-cell lung cancer. N Engl J Med 370: 1189-1197. [Crossref]
- Sakamoto H, Tsukaguchi T, Hiroshima S, Kodama T, Kobayashi T, et al. (2011) CH5424802, a selective ALK inhibitor capable of blocking the resistant gatekeeper mutant. Cancer Cell 19: 679-690. [Crossref]
- Seto T, Kiura K, Nishio M, Nakagawa K, Maemondo M, et al. (2013) CH5424802 (RO5424802) for patients with ALK-rearranged advanced non-small-cell lung cancer (AF-001JP study): a single-arm, open-label, phase 1-2 study. Lancet Oncol 14: 590-598. [Crossref]