Abstract
The increased prevalence of Type I Diabetes (T1D) has also ledto an increase in the number of macro- and microvascularcomplications of diabetes such as coronary heart disease,stroke, visual impairment, diabetic nephropathy (DN),and end stage renal disease (ESRD). Additionally, diabetesremains the most common reason for progressing to endstagerenaldisease.
The aim of the study was to investigate the level of hypoxic disorders, condition of apoptosis controlling system and Vitamin D3 levels in children with diabetic nephropathy.
The study involved 36 children with T1D and diabetic nephropathy (aged 6 to 17 years). The levels of the marker of cellular hypoxia HIF-1alfa, levels of the apoptotic factor caspase-3studied by Western Blotting, Vitamin D3 levels were analyzed using ELISA assay.
Stage-dependent manner of the cellular hypoxia and apoptotic effector caspase-3 levels increase documented. Both markers detected at significantly higher rate in DN patients as compared to T1D.Vitamin D3 deficiency documented in patients with DN.
Thus, the development of DN in children is associated withthe formation of cellular hypoxia and activation of apoptosis, as one of the basic mechanisms of kidney damage in DN. All mentioned above disorders accompanied by Vitamin D3 deficiency.
Keywords
diabetes mellitus, diabetic nephropathy, cellular hypoxia, apoptosis, Vitamin D3
Introduction
Type I Diabetes (T1D) is a worldwide epidemic that has led to a rise in diabetic nephropathy (DN). Over the past two decades, there hasbeen significant clarification of the various pathways implicated in the pathogenesis of DN. Nonetheless, very little has changedin the way clinicians manage patients with this disorder. Nowadays, treatment of DN primarily focused on controlling hyperglycemia andhypertension and inhibiting the renin-angiotensin system. The main biochemical disorder in diabetes and DN is hyperglycemia, causing a toxic effect of activating a chain of different intracellular enzymatic reactions, inflammation, oxidative stress[1,3].
Adequate control of blood glucose in patients with diabetesis a critical aspect of therapy. Glucose present in the blood in excessive concentrations can enzymatically bind to proteins such as hemoglobin and causes glycosylation. The level of glycosylated hemoglobin formation depends on the concentration of glucose in the environment. People with high blood glucose levels will have higher levels of glycated hemoglobin. Non-enzymatic glycation that occurs as a result of spontaneous interaction between glucose and amino groups of proteins, leading to the formation of products of advanced glycation (AGA)[3,4].
Tubulointerstitial fibrosis and tubular atrophy appear to be better predictors of renal disease progression than glomerular pathology. Nephrons from proteinuric diabetic patients show that 71% of glomeruli display glomerulotubular junction abnormalities and 8–17% of glomeruli are atubular glomeruli[5].
The mechanisms underlying tubular atrophy in diabetic patients are incompletely understood. In vitro and in vivo studies have shown that high glucose (HG) concentrations are associated with increased reactive oxygen species (ROS) production, inflammation which inhibits proximal tubular function and induces apoptosis. Apoptosis has been detected in renal proximal tubular cells (RPTCs) of diabetic mice and rats[5,6]. Moreover, in vitro data show the role of Vitamin D3 in rescuing kidney cells from apoptosis induced by glucose and albumin. These processes in pediatric patients with T1D and DN are not fully studied.
Material and methods
A survey of 36 children with T1D (aged 6 to 17 years) hospitalized in the Endocrinology unit on Children’s Clinical Hospital№6 (Kyiv, Ukraine) was done. Complex examination including conventional methods (inspection, monitoring blood pressure, blood tests, study of urinary sediment, renal ultrasound, etc.) were done to all patients. Other than conventional methods i.e.plasma levels of HIF-1alfa, caspase-3,Vitamin D3 were done. The control group included 16 healthy children.
Levels of the marker of cellular hypoxia HIF-1alfa and proapoptotic factor caspase-3 studied by immunoblotting. Briefly, proteins solubilized in Laemmli sample buffer were resolved in polyacrylamide gels by SDS-PAGE and transferred to a polyvinylidene difluoride membrane. Membranes were then blocked in 5% non-fat milk in Tris-Buffered Saline and Tween 20 (TBS-T - 136 mM NaCl, 10 mM Tris, 0.05% Tween 20) and immunoblotted using the caspase-3 and HIF-1α Ab (Cell Signaling Technology, Danvers, MA USA) and actin mouse mAb (BD, Lexington KY, USA) for 1 hour at room temperature. The actin mouse mAb was used as a loading control. The protein bands were visualized by chemiluminescent substrate ECL. Quantification of the protein content done by densitometric analysis.Vitamin D3 levels studied using ELISA assay and commercially available kit (Vitamin D3 (human) ELISA kit (BioVision, USA).
Material processed using the methods of variation statistics (STATISTICA 6.0) and nonparametric statistical approaches (Mann-Whitney test). Spearman correlation coefficients were used to express associations between parameters.Results are presented as Mean ± SEM, was considered statistically significant level of P<0.05.
Results
Depending on the general clinical data, all patients were divided into groups (Table 1).
Parameter |
T1D, firstly diagnosed |
DN |
Control |
Age |
13 ± 5 (11–16) |
12 ± 4 (12–16) |
12 ± 5 (11–17) |
Boys/girls |
10/12 |
6/8 |
8/8 |
Body weight, kg |
55 ± 2 (49–60) |
52 ± 4 (28–61) |
61 ± 4 (35–71) |
Hight, cm |
161 ± 6 (157–171) |
163 ± 4 (155–174) |
163 ± 5 (159-171) |
Serum creatinine, mcmol/mL |
41 ± 4 (36–49) |
59 ± 5 (45–73) |
40 ± 4 (34–45) |
Proteinuria, mg/day |
Absent |
250 ± 70 (170–330) |
Absent |
Glycosylated hemoglobin, % |
Absent |
11 ± 7 (9–14) |
Absent |
Systolic blood pressure, mmHg |
110 ± 4 (100–120) |
122 ± 20 (115–140) |
112 ± 7 (100–118) |
Diastolic blood pressure, mmHg |
88 ± 3(68–89) |
100 ± 12 (92–116) |
88 ± 3 (68–87) |
Table 1. Clinical characteristics of patients
Wehavedetectedanincreasedlevelofmarkerofcellularhypoxia (HIF-1 α) inbloodserumof all patients with T1D and DN as compared to control group. The levels of HIF-1α in group with T1D exceeded control group by 18.5± 1.76% (p<0.01 compared to control group) and by 30.03± 3.75% (р<0.01 compared to control group) in patients with DN (Figure1).
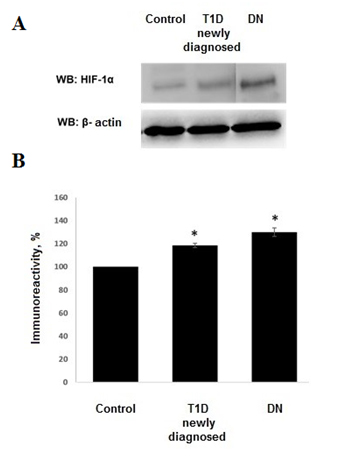
Figure 1. A) Western Blot showing expression of HIF-1α in children with T1D and DN. B) Densitometric quantification of HIF-1α. The density of the band from control group was set to 100%. Histograms show the mean ± SEM. *р<0.05.
Westudiedthelevelsofapoptoticeffector caspase-3. Increased levels of caspase-3 have been documented in all patients. In patients with DN expression of caspase-3 exceeded level of control group by 34.19±4.36% (р<0.001). ThismarkerinT1Dgroupwas documented at level exceeded control group by 14.82±2.35% (р<0.01). Control group marker assumed as 100% (Figure2).
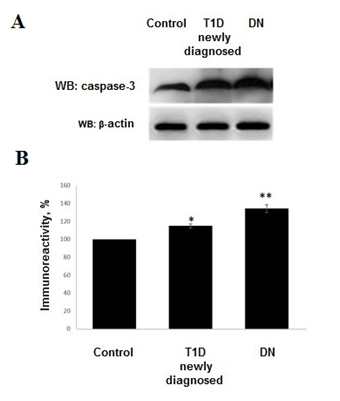
Figure 2. A) Western Blot showing expression of caspase-3 in childen with T1D and DN. B) Densitometric quantification of caspase-3. The density of the band from control group was set to 100%. Histograms show the mean ± SEM. *р<0.01, **р<0.001.
Normal level, insufficiency and deficiency of the Vitamin D3 were defined as - ≥30 ng/mL, 21-29 ng/mL and ≤20 ng/mL, respectively. Endogenous levels of the Vitamin D3 are season-dependent. All patients recruited to the study during the September-February.
We show that the most prominent Vitamin D3 deficiency detected in the group of patients with diabetic nephropathy. In control group Vitamin D3 was detected at level 35.68±1.56 ng/mL, in patients with T1D– 32.37±5.1 ng/mL, in patients with diabetic nephropathy – 19.39±1.76 ng/mL (р<0.01 as compared to control group) (Figure 3A). Analysis of theVitaminD3 levelsandduration of the disease foundnegative correlation between them(R=-0.79, р<0.001) (Figure 3B).
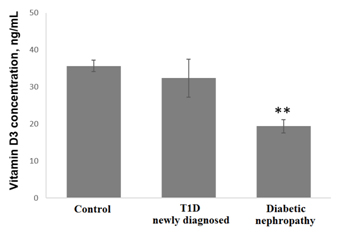
Figure 3. A) Histograms showing plasma levels of Vitamin D3 levels in patients with T1D and DN. Results presented as mean ± SEM. **р<0.01. B) Correlation between levels of Vitamin D3 and duration of diabetic nephropathy (R=-0.79, р<0.001).
Analysis of the Vitamin D3 levels in relation to albuminuria levels in patients with diabetic nephropathy shows negative correlation (R=-0.59, р<0.001) (Figure 4).
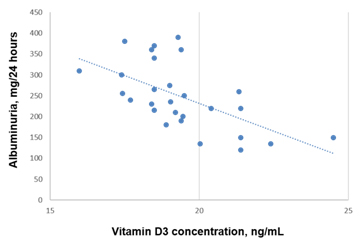
Figure 4. Correlation between Vitamin D3 levels and albuminuria in patients with diabetic nephropathy (R=-0.59, р<0.001).
Discussion
Diabetic nephropathy is characterized by proteinuria and progressive loss of renal function, leading to end-stage renal disease requiring renal replacement therapy. The pathological substrate of diabetic nephropathy is a progressive loss of parenchymal renal cells and extracellular matrix accumulation. Recently, it has become clear that inflammation also contributes to diabetic nephropathy[7].
Unbalanced apoptotic cell death leads to renal cell loss and has been observed in podocytes, tubular cells, and endothelial cells in experimental diabetic nephropathy[8]. Diabetic nephropathy is the most frequent cause of end-stage renal disease in developed countries. Only a comprehensive understanding of the molecular basis for renal injury initiation and progression will allow the rational design of novel, successful therapeutic strategies.
Chronic hypoxia of the tubulointerstitium has been recognized as a mechanism of progression that is common to many renal diseases. The hypoxic milieu in early stage diabetic nephropathy is aggravated by manifestations of chronic hyperglycemia - abnormalities of red blood cells, oxidative stress, sympathetic denervation of the kidney due to autonomic neuropathy, and diabetes-mellitus-induced tubular apoptosis; as such, tubulointerstitial hypoxia in diabetes mellitus might be an important early event[7-9].
Here we show that patients with newly diagnosed T1D have incresed levels of cellular hypoxia and its dramatic increase in patients with DN. At the same time chronic hypoxia is a potent inducer of apoptotic factors activation and cell death through apoptosis especially in tubular segment of nephrons [10]. We speculate that there is a link between these two conditions – cellular hypoxia and apoptosis whereas the high levels of apoptotic effector caspase-3 activation both in T1D patients and DN patients was documented.
The kidney plays a central role in vitamin D3 metabolism and regulation of its circulating levels. Beyond its role in calcium and phosphate homeostasis, vitamin D is an important modulator of cellular proliferation, inflammation, differentiation, and immunity [11]. Vitamin D3 attenuates kidney injury by suppressing fibrosis, inflammation, and apoptosis, by inhibiting multiple pathways known to play a role in kidney injury, including the renin-angiotensin-aldosterone system (RAAS), the nuclear factor-κB (NF-κB) [11,12], the transforming growth factor-β (TGF-β)/Smad [12-15].
It has also been reported that an increased Bax/Bcl-2 ratio and the cleaved form of caspase-3, which are apoptotic markers, are reversed by paricalcitol treatment in gentamicin-induced kidney injury [16]. Here we show that patients with diabetic nephropathy have increased activity of caspase-3. In addition, D3 prevents puromycin aminonucleoside-induced apoptosis of glomerular podocytes by activating the phosphatidylinositol 3-kinase/Akt-signaling pathway [17]. Moreover, recent clinical studies show that vitamin D3 deficiency is independently associated with increased DN in female patients with T2DM[18]. In contast treatment with vitamin D in combination with angiotensin II type 1 receptor blockers provides a synergistic effect on the treatment of DN in rats, not only by inhibiting renin but also by reducing oxidative stress and increasing the renal antioxidant capacity[19]. Taken together, these data evaluate the specific importance of the vitamin D3 in kidney damage observed in DN.
In this study we show that children with diabetic nephropathy have Vitamin D3 deficiency, activation of the apoptotic effector caspase-3, high level of cellular hypoxia. We speculate that negative correlation between Vitamin D3 levels and albuminuria might be an evidence that adequate levels of Vitamin D3 provides protective effects on the glomerular barrier in children with diabetic nephropathy possibly due to its possible anti-apoptotic and anti-inflammatory activity. Further studies of the possible nephroprotective role of the vitamin D3 and its mechanism in children with DN may assist with prevention and treatment of DN.
References
- American Diabetes Association (2015) Standarts Of Medical Care In Diabetes. Diabetes Care 38: 1. [Crossref]
- Atkins RC, Zimmet P; World Kidney Day Steering Committee (2010) Diabetic kidney disease: act now or pay later. J Am Soc Hypertens 4: 3-6. [Crossref]
- Forbes JM (2003) The breakdown of pre-existing advanced glycation end products is associated with reduced renal fibrosis in experimental diabetes. The FASEB J 17:1762-1764. [Crossref]
- Goldin A1, Beckman 2021 Copyright OAT. All rights reservanced glycation end products: sparking the development of diabetic vascular injury. Circulation 114: 597-605. [Crossref]
- Heilig CW1, Deb DK, Abdul A, Riaz H, James LR, et al. (2013) GLUT1 regulation of the pro-sclerotic mediators of diabetic nephropathy. Am J Nephrol 38: 39-49. [Crossref]
- Franko B, Brault J, Jouve T, Beaumel S, Benhamou PY, et al. (2014) Diferential impact of glucose levels and advanced glycation end-products on tubular cell viability and pro-inflammatory/profibrotic functions. Biochem Biophys Res Commun 451: 627-631. [Crossref]
- Reidy K, Kang HM, Hostetter T, Susztak K (2014) Molecular mechanisms of diabetic kidney disease. J Clin Invest 124: 2333–2340. [Crossref]
- Sun LN, Liu XC, Chen XJ, Guan GJ, Liu G (2016) Curcumin attenuates high glucose-induced podocyte apoptosis by regulating functional connections between caveolin-1 phosphorylation and ROS. Acta Pharmacol Sin [Crossref]
- Reidy K, Kang HM, Hostetter T, Susztak K (2014) Molecular mechanisms of diabetic kidney disease. J Clin Invest 124: 2333-2340. [Crossref]
- Song H, Han IY, Kim Y, Kim YH, Choi IW, et al. (2015) The NADPH oxidase inhibitor DPI can abolish hypoxia-induced apoptosis of human kidney proximal tubularepithelial cells through Bcl2 up-regulation via ERK activation without ROS reduction. Life Sci 126: 69-75. [Crossref]
- Tan X, Li Y, Liu Y (2007) Therapeutic role and potential mechanisms of active vitamin D in renal interstitial fibrosis. J Steroid Biochem Mol Biol 103: 491–496. [Crossref]
- Park JW, Bae EH, Kim IJ, Ma SK, Choi C, et al. (2010) Renoprotective effects of paricalcitol on gentamicin-induced kidney injury in rats. Am J Physiol Renal Physiol 298: F301-313. [Crossref]
- Park JW, Bae EH, Kim IJ, Ma SK, Choi C, et al. (2010) Paricalcitol attenuates cyclosporine-induced kidney injury in rats. Kidney Int 77: 1076-1085. [Crossref]
- Segerer S, Nelson PJ, Schlondorff D (2000) Chemokines, chemokine receptors, and renal disease: from basic science to pathophysiologic and therapeutic studies. J Am Soc Nephrol 11: 152–176. [Crossref]
- Guijarro C1, Egido J (2001) Transcription factor-kappa B (NF-kappa B) and renal disease. Kidney Int 59: 415-424. [Crossref]
- Suh SH1, Lee KE, Park JW, Kim IJ, Kim O, et al. (2013) Antiapoptotic Effect of Paricalcitol in Gentamicin-induced Kidney Injury. Korean J Physiol Pharmacol 17: 435-440. [Crossref]
- Xiao H, Shi W, Liu S, Wang W, Zhang B, et al. (2009) 1,25-Dihydroxyvitamin D(3) prevents puromycin aminonucleoside-induced apoptosis of glomerular podocytes by activating the phosphatidylinositol 3-kinase/Akt-signaling pathway. Am J Nephrol - 30: 34–43. [Crossref]
- Jung CH, Kim KJ, Kim BY, Kim CH, Kang SK, et al. (2016) Relationship between vitamin D status and vascular complications in patients with type 2 diabetes mellitus. Nutr Res 36: 117-124. [Epub ahead of print]. [Crossref]
- Deng X, Cheng J, Shen M (2015) Vitamin D improves diabetic nephropathy in rats by inhibiting renin and relieving oxidative stress. J Endocrinol Invest. [Epub ahead of print]. [Crossref]