Introduction and objective: Pre-pregnancy obesity is associated with complications including preeclampsia, gestational diabetes mellitus, stillbirth, and fetal macrosomia. The objective of this study was to determine whether pre-pregnancy body mass index (BMI, calculated as weight (kg)/ [height (m)]2) affected immediate neonatal outcomes.
Methods: Institutional review board–exempt status was obtained. Medical information was abstracted from all deliveries at University of Florida Health in December 2013, including age, race-ethnicity, pre-pregnancy and post-pregnancy BMI, Apgar scores, and venous and arterial cord gas pH levels. Standard statistical analysis was performed with Microsoft Excel; null hypothesis was rejected for p-value <0.05.
Results: A total of 135 patient charts were reviewed; average age was 27.5 years of age, mean pre-pregnancy BMI was 28.7, and average gestational weight gain was 12.55 kg. Thirty-nine percent of patients were normal-weight or underweight, 25% were overweight, and 36% were obese. Average fetal weight at delivery was 3,375 g. Fetal weight incrementally increased as maternal BMI increased; women with normal or low BMIs had an average fetal weight of 3,299 g, whereas those who were obese had an average fetal weight of 3,490 g. Apgar score at 1 minute was significantly lower for neonates of mothers with class III obesity than for those of mothers with normal or low BMIs (7 compared with 8.3; p=.04). The venous cord gases showed that patients with class II and III obesity had significantly lower pH levels than did normal-weight or underweight patients (7.3 and 7.28, respectively, compared with 7.34; p=0.02 and 0.01).
Conclusions: Pre-pregnancy obesity can lead to high fetal weight, lower 1 minute Apgar scores, and lower venous cord gas pH levels. We aim to analyze data based on gestational weight gain as well as to collect more patient charts to increase study power.
Obesity in the United States has become a large epidemic. In the year 2007-2008, 33.8% of adults are obese with an additional 34.2 are overweight. Also, a third of women ages 20-39 years are obese. There are many known complications of obesity such as hypertension, type II diabetes, hyperlipidemia, etc. As such, these things can be translated to pre-pregnancy obesity with complications including preeclampsia, GDM, still birth, and fetal macrosomia [1]. Thus, research has shown that children born to mothers who are obese or have diabetes mellitus are at a greater risk for developing metabolic disease. Because of the increased obesity rates in this country, there are implications that these pregnancies will continue the cycle of insulin resistance and obesity [2]. The objective for this pilot study was to determine if maternal pre-pregnancy BMI affects immediate neonatal outcomes.
IRB exempt status was obtained through the University of Florida Institutional Review Board for this retrospective chart review. CPT codes were used to identify all patients who delivered at University of Florida Health, Shands Hospital (Gainesville, FL) over the designated time period. Data analyzed for this preliminary pilot study abstracted information from patients who delivered during December 2013. Data collected included: age, race/ethnicity, insurance payer, pre- and post-pregnancy body mass index, total maternal weight gain, mode of delivery, pregnancy complications, maternal medical problems, fetal Apgar scores at 1 and 5 minutes, and cord blood gas pH. The exclusion criterion for this analysis was a delivery prior to 37 weeks’ gestational age [3-5]. Statistical analysis was performed using Microsoft Excel and GraphPad software. The null hypothesis was rejected for p<0.05.
135 deliveries were reviewed for this pilot preliminary study. The average age was 27.5 years old, mean pre-pregnancy BMI was 28.7, and average gestational weight gain was 12.55 kg. 71 (53%) were Caucasian/White, 23% Black/African American and 24% were Other races including Asian and Hispanic; this reflected our overall population that is served at UF Health. 38.9% of patients were normal-weight or underweight, 24.6 % were overweight, and 36.7% were obese (Table 1). As maternal BMI increased, there was an upward trend in fetal weight. When comparing women with low and normal BMI to women with BMI greater than 30, the fetal weights were 3299g and 3489g, respectively with a p-value equal to 0.145 (Figure 1). The next parameter that we examined was venous and arterial cord blood gas pHs that are obtained routinely on all deliveries at UF Health. Neonates born from class II and III obese mothers had lower pH values for venous cord gases than that of normal/underweight mothers (7.299 and 7.28 vs. 7.34; p-value equal to 0.02 and 0.03, respectively). Analysis of arterial blood gas pH data did not show any significant differences between the BMI classes (Figure 2).
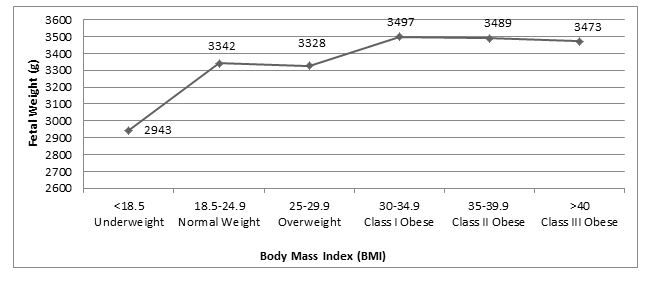
Figure 1. Fetal birth weight (g) and pre-pregnancy Body Mass Index
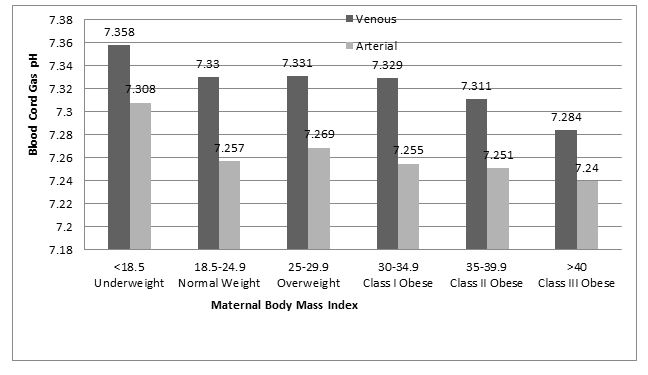
Figure 2. Arterial and Venous Blood Cord Gas pH and pre-pregnancy BMI
Table 1. BMI distribution
Weight Class |
% (No.) |
Underweight (BMI <18.5) |
4.2% (5) |
Normal Weight (BMI 18.5-24.9) |
34.7% (41) |
Overweight (BMI 25-29.9) |
24.6% (29) |
Class 1 Obesity (BMI 30-34.9) |
16.1% (19) |
Class 2 Obesity (BMI 35-39.9) |
13.8% (16) |
Class 3 Obesity (BMI >40) |
6.8% (8) |
Lastly, we assessed differences in fetal Apgar scores at 1 and 5 minutes of birth. The Apgar scores at 1 were lower in fetuses born to class III obese mothers when comparted to all BMI classes. The 1 minute Apgar score reached statistical significance when comparing neonates born to normal and underweight women to the Class III obese women (8.2 vs. 7.0; p-value=0.04); all others were just trends approaching clinical significance. There were no significant trends or differences with Apgar scores at 5 minutes among neonates born to the women of different BMI classes (Figure 3).
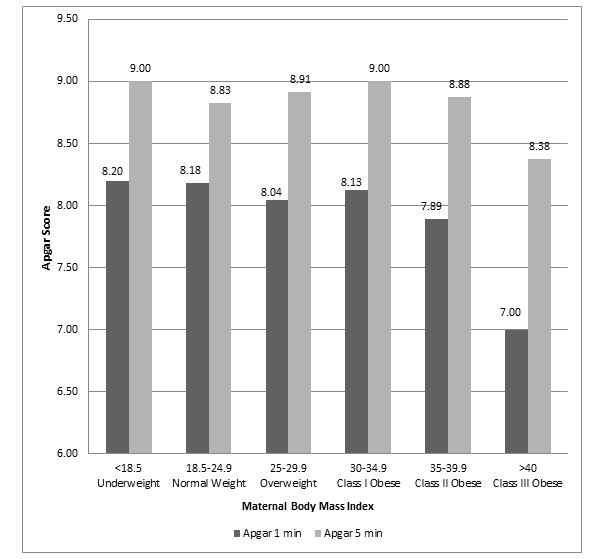
Figure 3. Neonate Apgar Scores and Pre-pregnancy BMI
Obesity is a known risk factor for potential adverse maternal pregnancy outcomes and now in the literature neonate/fetal outcomes as well as in later childhood development. This pilot study wanted to assess if pre-pregnancy BMI affected fetal weight, venous and arterial cord gas pH and Apgar scores at birth. We found that as pre-pregnancy BMI increased, fetal weight increased; Women with Class II Obesity delivered the largest infants (3686g; p-value=0.025). Fetuses born to women with Class III Obesity had lower venous cord blood gases than rest of weight classes. Additionally, these fetuses had the lowest average 1 minute Apgar scores (all statistically significant). The question that remains is how these parameters, in particular venous cord gases and 1 minute Apgar scores, impact future neurological development, meeting milestones, behavioral patterns and future learning in school There are several potential drawbacks [5,6]. or confounders to this study other than those inherent to a retrospective analysis. This pilot study only abstracted data from 135 maternal charts and did not look at long term fetal outcomes. Additionally, our only exclusion criterion was delivering less than 37 weeks’ gestational age. The cohort of patient analyzed included patients with a wide variety of maternal medical conditions such as diabetes and HIV and may confound results. The preliminary data obtained from this pilot study lays the foundation for a larger retrospective study to be performed and will include data about maternal weight gain and stratification of maternal medical problems. Additionally, we plan to add a prospective component assessing infant and childhood intellectual and behavioral milestones.
This work was supported by The Thomas H. Maren, M.D. Junior Investigator Research Award from the University of Florida, College of Medicine awarded to J Schneider.
- Mann JR, McDermott S, Hardin J, Pan C, Zhang Z (2013) Pre-pregnancy body mass index, weight change during pregnancy, and risk of intellectual disability in children.BJOG 120: 309-319. [crossref]
- Boney CM, Verma A, Tucker R, Vohr BR (2005) Metabolic syndrome in childhood: association with birth weight, maternal obesity, and gestational diabetes mellitus. Pediatrics 115: e290-6.[crossref]
- Crane JMG, White J, Murphy P, Burrage L, Hutchens D (2009) The effect of gestational weight gain by body mass index on maternal and neonatal outcomes. J Obstet Gynaecol Can 14: 28-35.[crossref]
- Dodd JM, Turnbull DA, McPhee AJ, Wittert G, Crowther CA, et al. (2011) Limiting weight gain in overweight and obese women during pregnancy to improve health outcomes: the LIMIT randomized controlled trial. BMC Pregnancy and Childbirth 11: 79.[crossref]
- Evenson KR, Moos M, Carrier K (2009) Perceived barriers to physical activity among pregnant women. Matern Child Health J 13: 364-375.[crossref]
- Tie HT, Xia YY, Zeng YS, Zhang Y, Dai CL, et al. (2014) Risk of childhood verweight or obesity associated with excessive weight gain during pregnancy: a meta-analysis. Arch Gynecol Obstet 289: 247-257. [crossref]