Abstract
Background: The former Soviet Republics Russia and Belarus have one of the highest alcohol-related problems rates in the world. Aims: To estimate the aggregate level effect of alcohol on the alcohol-related morbidity and mortality rates in Russia and Belarus. Method: Trends in alcohol-related morbidity and mortality rates and alcohol sales per capita from 1970 to 2013 in Russia and Belarus were analyzed employing an ARIMA analysis. Results: Alcohol sales is a statistically significant associated with alcohol poisoning mortality, liver cirrhosis mortality and alcoholic psychoses incidence rates in both countries. Conclusion: This comparative time-series analysis highlighted close temporal association between alcohol-related morbidity and mortality rates and population drinking in Russia and Belarus.
Key words
alcohol-related problems, ARIMA time series analysis, Russia, Belarus, 1970-2013.
Introduction
Alcohol is a major contributor to premature deaths toll in Eastern Europe [1]. Its effects on mortality seem to have been especially striking in the Slavic countries of the former Soviet Union (fSU), where it has been identified as one of the most important factor underpinning the mortality crisis that has occurred in the post-Soviet period [7,8,14,21,22]. Despite some positive changes in recent years, the former Soviet republics Russia and Belarus ranks among the world’s heaviest drinking countries with an annual official consumption rate about 10 litres of pure alcohol per capita [7,8]. Furthermore, according to the WHO, in 2010, Belarus appears at the top of global rating with 17.5 litres of total alcohol consumption (including unrecorded consumption) per capita [27]. Evidence of a major effect of binge drinking on mortality pattern in these countries comes from both aggregate level analyses and studies of individuals [7,8,14,21,22,28]. In Russia, for example, alcohol may be responsible for 59.0% of all male and 33.0% of all female deaths at ages 15-54 years [28]. Corresponding figures for Belarus are somewhat lover: 28.4% of all male and 16.4% of all female deaths [15]. The drinking culture in Russia and Belarus is rather similar and characterized by a high overall level of alcohol consumption and the heavy episodic (binge) drinking pattern of strong spirits, leading to a high alcohol poisoning mortality rates [7,8,14,21,22].
In comparative perspective, Belarus presents an interesting contrast to other former Soviet countries with extremely high alcohol-related mortality rate. The developmental path in Belarus has been somewhat different to that seen in other countries in the post-Soviet period. By contrast to Russia, which implemented mass privatization after the collapse of the former Soviet Union, Belarus has adopted a more gradual approach to transition. In relation to this, Stuckler et al. [23] argue that rapid mass privatization and increased unemployment rate in the early 1990s was the major determinant of the mortality crisis in Russia during this time.
Alcohol poisoning death is caused by drinking a large amount of alcohol in a short period of time. Therefore, alcohol poisoning has been proposed as a main indicator for alcohol-related problems for countries where episodic heavy drinking predominates [21]. Although alcohol poisoning mortality rates was comparatively high in Russia and Belarus, even during the later-Soviet period, the alarming rise that has occurred during the post-Soviet period means that these countries have one of the highest alcohol poisoning mortality rates in the world [7,8,21].
Alcoholic psychosis is a secondary psychosis that usually occurs in alcohol-dependent individuals after the prolonged period of heavy drinking and withdrawal [5]. The alcoholic psychoses incidence rate is a reliable indicator of alcohol-related problems at the population level since there is a strong relationship between alcoholic psychoses incidence rate and alcohol consumption per capita [13,26].
Liver cirrhosis is a major cause of deaths in many developed countries [29]. There is general consensus about causal role of alcohol for the risk of liver cirrhosis [19]. The strong support for a direct link between alcohol and liver cirrhosis comes both from individual- and aggregate-level data [19]. During the recent decades an increase in liver cirrhosis mortality rates appeared in the former Soviet republics [29]. The reasons for this increase in liver cirrhosis mortality rates are still poorly understood.
This study examines the trends in alcohol-related problems in Russia and Belarus from the late Soviet to post-Soviet period. It goes beyond previous studies that have been confined primarily to Russia and focused on alcohol-related mortality with few examples from elsewhere even though other former Soviet republics have experienced similar fluctuations in alcohol-related mortality rates. More specifically, this study focuses on a comparative analysis of trends in alcohol poisoning mortality rates, liver cirrhosis mortality rates, alcoholic psychoses incidence rates and alcohol sales per capita in Russia and Belarus.
Methods
Data
The data on alcohol poisoning mortality rates, liver cirrhosis mortality rates, alcoholic psychoses incidence rates (per 100.000 of the population) and data on per capita alcohol sales (in liters of pure alcohol) are taken from the Russian State Statistical Committee (Rosstat) reports and Belarusian State Statistical Committee (Belsstat).
Statistical analysis
To examine the relation between changes in alcohol sales and alcohol-related problems rates across the study period a time-series analysis was performed using the statistical package "Statistica". The dependent variable was the alcohol-related problems rates and the independent variable was aggregate alcohol sales. Bivariate correlations between the raw data from two time-series can often be spurious due to common sources in the trends and due to autocorrelation. One way to reduce the risk of obtaining a spurious relation between two variables that have common trends is to remove these trends by means of a ‘differencing’ procedure, as expressed in formula:
Ñxt = xt - xt-1
This means that the annual changes ‘Ñ’ in variable ‘X’ are analyzed rather than raw data. The process whereby systematic variation within a time series is eliminated before the examination of potential causal relationships is referred to as ‘prewhitening’. This is subsequently followed an inspection of the cross-correlation function in order to estimate the association between the two prewhitened time series. It was Box and Jenkins [2] who first proposed this particular method for undertaking a time series analysis and it is commonly referred to as ARIMA modeling. We used this model specification to estimate the relationship between the time series alcohol-related morbidity and mortality rates and alcohol sales in this paper. In line with previous aggregate studies [10,14], we estimated semi-logarithmic models with logged output. A semi-logarithmic model is based on the assumption that the risk of alcohol-related problems increases more than proportionally for a given increase in alcohol consumption [10]. The following model was estimated:
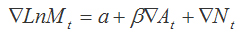
where Ñ means that the series is differenced, M is alcohol-related problems rates, a indicates the possible trend in alcohol-related problems rates due to other factors than those included in the model, A is the alcohol sales, β is the estimated regression parameter, and N is the noise term. The percentage increase in alcohol-related problems rates associated with a 1-litre increase in alcohol sales is given by the expression: (exp(β1)-1)*100.
Results
The average alcohol poisoning figure for Russia and Belarus was 19.3 and 16.7 per 100.000 respectively. The trend in the alcohol poisoning mortality rates is displayed in Figure 1. As can be seen, two countries have experienced similar fluctuations in the alcohol poisoning mortality rates over the Soviet period. This index increased steadily from 1970 to 1980, decreased markedly from 1980 to 1984, dropped sharply between 1984 and 1988, than started an upward trend from 1998 to 1991. While the trends in alcohol poisoning mortality rates have been similar in both countries during the Soviet period, there was significant discrepancy after the collapse of the Soviet Union. Trend in alcohol poisoning mortality rates have fluctuated greatly in Russia: jumped dramatically during 1991 to 1994; from 1994 to 1998 there was a fall in the rates before they again jumped between 1998 and 2003, and then started to decrease in the most recent years. In Belarus, alcohol poisoning mortality rates increased steadily up to 2005 and than started to decrease. The comparative analysis of long-term evolution of alcohol poisoning mortality rates suggests that in the 1970s the rate was considerably lower in Belarus than in Russia. This gap practically disappeared during the Gorbachev’s anti-alcohol campaign: between 1984 and 1988 alcohol poisoning mortality rates decreased 2.5 times in Russia (from 19.6 to 7.8 per 100.000) and about 2 times in Belarus (from 13.8 to 7.4 per 100.000). After the collapse of the fSU, the alcohol poisoning mortality rates was growing steadily in Belarus, whereas in Russia there was a sharp grows in the first half of 1990s followed by a decline, which resulted in comparatively high alcohol poisoning mortality rates in Belarus.
Figure 1. Trends in alcohol poisoning mortality rates in Russia and Belarus between 1970 and 2013.
The average alcoholic psychoses incidence figure for Russia and Belarus was 27.7 and 17.3 per 100.000 respectively. The trend in the alcoholic psychoses incidence rates is displayed in Figure 2. As can be seen, the trend in the alcoholic psychoses incidence rates rather similar to those in alcohol poisoning mortality rates.
Figure 2. Trends in alcohol psychoses incidence rate in Russia and Belarus between 1970 and 2013.
The average liver cirrhosis mortality figure for Russia and Belarus was 16.3 and 12.0 per 100.000 respectively. In Russia the time series liver cirrhosis mortality rates fluctuate greatly over the period: decreased markedly between 1984-1988, than started on an upward trend from 1988-1989, before increasing substantially during 1992 to 1995. From 1995-1998 there was a fall in the rates before they again jumping dramatically between 1998 and 2006. After the collapse of the fSU, the liver cirrhosis mortality rates was growing steadily in Belarus up to 2011, and then started to decrease in the most recent years (Figure 3).
Figure 3. Trends in liver cirrhosis mortality rates in Russia and Belarus between 1970 and 2013.
The average alcohol sales figure for Russia and Belarus was 8.4 and 8.8 litres per capita respectively. The temporal pattern of alcohol sales in Russia and Belarus was similar across the Soviet period (Figure 4). As can be seen, the alcohol sales decreased slightly in the early 1980s, and than decreased dramatically between 1984 and 1987. After the collapse of the Soviet Union, recorded alcohol consumption in Russia rose sharply between 1992 and 1995, decreased substantially in 1996, increased steadily up to 2007, and than started to decrease. In the post-Soviet Belarus alcohol sales increased steadily with several oscillations up to 2005, than jumped dramatically, and since 2011 started to decrease.
Figure 4. Trends in alcohol sales per capita in Russia and Belarus between 1970 and 2013.
There were sharp trends in the time series data across the study period. These trends were removed by means of a first-order differencing procedure. The specification of the bivariate ARIMA model and outcome of the analyses are presented in Table 1. According to the results, in Russia, alcohol sales is a statistically significant associated with all indicators of alcohol-related problems, implying that a 1-l increase in per capita alcohol sales is associated with an increase in the alcohol poisoning mortality rates of 9.0%, an increase in the liver cirrhosis mortality rates of 5,8%, an increase in the alcoholic psychoses incidence rates of 18.6%. In Belarus, alcohol sales is a statistically significant associated with alcohol-related morbidity and mortality rates, implying that a 1-l increase in per capita alcohol sales is associated with an increase in alcohol poisoning mortality rates of 8.1%, an increase in the liver cirrhosis mortality rates of 5,5%, an increase in the alcoholic psychoses incidence rate of 18.8%.
Table 1. Estimated effects (bivariate ARIMA model) of alcohol sales on alcohol-related morbidity and mortality rates.
Parameter |
Model |
Estim. |
P |
Russia |
Alcohol poisoning |
0.1.0* |
0.090 |
0.000 |
Liver cirrhosis |
0.1.0 |
0.058 |
0.001 |
Alcoholic psychosis |
0.1.0 |
0.186 |
0.000 |
Belarus |
Alcohol poisoning |
0.1.0 |
0.081 |
0.000 |
Liver cirrhosis |
1.1.0 |
0.055 |
0.001 |
Alcoholic psychosis |
0.1.0 |
0.188 |
0.000 |
*The general form of non-seasonal ARIMA model is (p,d,q), where p - the order of the autoregressive parameter, d – the order of differencing, and q – the order of the moving average parameter. Q test for residuals are satisfactory in all models.
Discussion
According to the results of present analysis there was a positive and statistically significant effect of per capita alcohol sales on alcohol-related problems rates in Russia and Belarus and the magnitude of this effect was similar in both countries. These results are consistent with the previous findings that highlighted close temporal association between alcohol-related morbidity and mortality rates and population drinking [7,8,10,14].
As it was mentioned above, rapid mass privatization and increased unemployment rate was suggested as the major determinant of the mortality crisis in Russia in the early 1990s [23]. Several studies have shown that unemployment have adverse effects on physical and mental health [25]. It was also assumed that this association is mediated through psychosocial distress, which leads to the adoption of unhealthy lifestyle including smoking and hazardous drinking [3]. Nevertheless, there are some inconsistencies in the findings concerning the association between unemployment and alcohol-related outcomes. In particular, in an analysis of the determinants of mortality in post-Soviet countries Earle and Gehlbach [4] find no evidence that privatization increased mortality during the early 1990s. This evidence suggests that rapid mass privatization, increase unemployment and psychosocial distress do not provide a sufficient explanation for cross-country differences in alcohol-related morbidity and mortality trends during the transition to the post-communism. It seems plausible that alcohol-dependent individuals do not particularly sensitive to psychosocial distress caused by the rapid social transformation but, instead, sensitive to availability and affordability of alcohol. Russian historical perspective provides sufficient evidence for this [21,22].
One of the most intriguing phenomenon in this context is the substantial decline in alcohol consumption and alcohol-related morbidity and mortality rates that occurred between 1980 and 1984, which might be attributed to the increase in the price of vodka in 1981 [8]. Furthermore, the new Soviet leader Andropov, who came to power in 1982, realized that mass drunkenness was a major threat to the Soviet system and saw a great opportunity to increase labor productivity by sobering up the nation. He took a number of steps in this direction using police methods to strengthen labor discipline and to fight against drunkenness in the workplace [13]. It might be the case that this policy resulted in a decline in both per capita alcohol consumption and the alcohol-related problems rates.
An especially sharp fall was recorded in alcohol sales in 1985–1987 that coincided with Mikhail Gorbachev’s anti-alcohol campaign, which substantially reduced availability and affordability of alcohol. The collapse of the Soviet Union and the ending of the state’s alcohol monopoly in January 1992 were accompanied by a sharp rise in alcohol sales. Treisman [24] argue that the increase in alcohol consumption in the early 1990s, which explains much of the rise in mortality, resulted largely from an increase in the affordability of vodka. With price liberalization in 1992, vodka became much more affordable because of a dramatic drop in its relative price. In the period from 1995 the real vodka price recovered somewhat until 1998, after which point the trend turned down again [8].
Some researchers attributed the Russian mortality crisis between 1992 and 1994 to the group of heavy drinkers, whose lives were saved during the anti-alcohol campaign [8]. It was also suggested that mortality in this group explains the subsequent fluctuations in total mortality. However, the substantial discrepancies between the trends in alcohol poisoning mortality rates in Russia and Belarus during the recent decades do not support this hypothesis.
In Russia, alcohol poisoning mortality rates has declined dramatically since 2003, with the highest rates of decline in 2006 and 2007, which might be attributed to the implementation of the alcohol policy reforms in 2001–2006, which increased government control over the alcohol market [9,17,20]. The policies included strict regulations on alcohol products, which resulted in a decline in a distributors and increased consumer prices [20]. In his recent study Pridemore and coauthors [12] concluded that the implementation of alcohol policies was responsible for a decline in deaths due to alcohol poisoning and alcoholic liver cirrhosis. This empirical evidence suggest that recent Russian government’s attempt to curb the high alcohol-related mortality have been at least partially successful and provide additional evidence that pricing policy may be an effective strategy to reduce an alcohol-related burden. There is, however, some doubts that recent decline in alcohol poisoning mortality rates in Russia is fully attributable to the alcohol control measures, since downward trend in alcohol poisoning mortality rates started before decline in recorded alcohol consumption.
In Belarus, alcohol poisoning mortality rates started to decrease since 2005, despite upward trend in recorded alcohol consumption. This apparent paradox can be explained by the recent alcohol control policies implemented in this country. It seems plausible that grows in recorded alcohol consumption took place in compensation for the sharp fall in unrecorded consumption. This trend coincides with an increase in state control over the alcohol market, including an intensification of the fight against home distillation, as well against consumption of surrogate alcohol [16]. A reciprocal relationship between unrecorded alcohol consumption and official alcohol sales can explain the paradox of how the alcohol poisoning mortality rates decreased at the same time that alcohol sales increased substantially. It might be the case, however, that alcohol control measures, implemented in this country, simply coincided with favorable trends in alcohol poisoning mortality rates.
Before concluding, we should address the potential limitations of this study. In particular, we relied on official alcohol sales data as a proxy measure for trends in alcohol consumption across the period. However, unrecorded consumption of alcohol was commonplace in Russia and Belarus throughout the study period, especially in the mid-1990s, when a considerable proportion of vodka came from illicit sources [18]. The consumption of homemade spirits (samogon) and surrogates might also have a particularly negative impact on alcohol poisoning mortality rates [21].
Further, a close relationship between per capita alcohol sale and liver cirrhosis mortality does not rule out the possibility that other factors have also influenced the development liver cirrhosis mortality rate. Although alcohol is regarded as the most important risk factor for liver cirrhosis, a number of other causal factors that influence the risk of development of liver cirrhosis have been indentified, including diet, obesity and concomitant infection with viral hepatitis [19]. The presence of these causal factors is likely to have distorted the estimated alcohol effects. It seems that the role of non-alcohol causes in liver cirrhoses mortality increased during the last decade. In particular, the epidemy of viral hepatitis among drug users might contribute to the dramatic increase in liver cirrhosis mortality in Russia during the past several years [11]. However, the etiological importance of other risk factors is clearly modest compared to alcohol, thus limiting their potential influence. Finally, the present analysis is based on fairly short time series and this implies caution in the interpretation of findings.
In conclusion, this comparative time-series analysis highlighted close temporal association between alcohol-related morbidity and mortality rates and population drinking in Russia and Belarus. The outcomes of this study provide indirect support for the hypothesis that the dramatic fluctuations in the alcohol-related problems rates in Russia and Belarus during the last decades were related to the availability/affordability of alcohol. The findings from the present study have important implications as regards alcohol policy, suggesting that any attempts to reduce alcohol-related burden should be linked with efforts through restriction of availability/affordability of alcohol.
See comment in PubMed Commons belowConflict of interest
None declared
References
- Anderson P, Baumberg B (2006) Alcohol in Europe. London: Institute of Alcohol Studies.
- Box G.E.P, Jenkins, G.M. (1976) Time Series Analysis: forecasting and control. London. Holden-Day Inc.
- Brainerd E, & Cutler D M (2005) Autopsy on an Empire: Understanding mortality in Russia and the former Soviet Union. Journal of Economic Perspective 19: 107–130.
- Earle J.S, Gehlbach S. Mass privatization and the post-communist mortality crisis, is there a relationship? Upjohn Institute Working Paper No. 10-162.
- Jordaan GP, Emsley R (2014) Alcohol-induced psychotic disorder: a review. Metab Brain Dis 29: 231-243. [Crossref]
- McKee M, Suzcs S, Sárváry A, Adany R, Kiryanov N, et al. (2005) The composition of surrogate alcohols consumed in Russia. Alcohol Clin Exp Res 29: 1884-1888. [Crossref]
- Nemtsov A.V. & Razvodovsky YE(2008) Alcohol situation in Russia, 1980-2005. Social and Clinical Psychiatry 2: 52–60.
2021 Copyright OAT. All rights reserv
- Nemtsov A.V (2011) A contemporary history of alcohol in Russia. Stockholm. Sodertorns hogskola.
- Neufeld M, Rehm J (2013) Alcohol consumption and mortality in Russia since 2000: are there any changes following the alcohol policy changes starting in 2006? Alcohol Alcohol 48: 222-230. [Crossref]
- Norström T, Skog OJ (2001) Alcohol and mortality: methodological and analytical issues in aggregate analyses. Addiction 96 Suppl 1: S5-17. [Crossref]
- Poinstil E, Verevochkin SV, Dukhovlinova E, Niccola IL, Barbour R, et al. (2009) Hepatitis C virus infection among drug injectors in St. Peterburg, Russia: social and molecular epidemiology of an endemic infection. Addiction 104: 1884-1890.
- Pridemore WA, Chamlin MB, Kaylen MT, Andreev E (2014) The effects of the 2006 Russian alcohol policy on alcohol-related mortality: an integrated time series analysis. Alcoholism: Clinical and Experimental Research 38: 257–266.
- RazvodovskiÄ IuE (2002) [Alcoholism and alcoholic psychosis in Belarus in 1970-1999]. Zh Nevrol Psikhiatr Im S S Korsakova 102: 58-63. [Crossref]
- Razvodovsky YE (2010) Beverage specific alcohol sale and mortality in Russia. Alcoholism 46: 63–75.
- Razvodovsky YE (2012) Alcohol attributable mortality in Belarus. Alcoholism 48: 13-22.
- Razvodovsky YE (2011) Currrent alcohol policy in the Republic of Belarus. Questions of Organization and Informatization of Public Health 3: 38-45.
- Razvodovsky YE (2014) Was the mortality decline attributable to alcohol control policy? Journal of Sociolomics 3: 2.
- Razvodovsky YE (2008) Noncommercial alcohol in central and eastern Europe, ICAP Review 3. In: International Center for Alcohol Policies, ed. Noncommercial alcohol in three regions. Washington, DC: ICAP 17–23.
- Rehm J, Taylor B, Mohapatra S, Irving H, Baliunas D, et al. (2010) Alcohol as a risk factor for liver cirrhosis: a systematic review and meta-analysis. Drug Alcohol Rev 29: 437-445. [Crossref]
- Schkolnicov VM, Andreev EM, McKee M, Leon DA (2013) Components and possible determinants of the decrease in Russian mortality in 2004–2010. Demographic Research 28: 917–950.
- Stickley A, Leinsalu M, Andreev E, Razvodovsky Y, Vågerö D, et al. (2007) Alcohol poisoning in Russia and the countries in the European part of the former Soviet Union, 1970 2002. Eur J Public Health 17: 444-449. [Crossref]
- Stickley A, Razvodovsky Y, McKee M (2009) Alcohol mortality in Russia: a historical perspective. Public Health 123: 20-26. [Crossref]
- Stuckler D, King L, McKee M (2009) Mass privatisation and the post-communist mortality crisis: a cross-national analysis. Lancet 373: 399-407. [Crossref]
- Treisman D (2010) Death and price. The political economy of Russia’s alcohol crisis. Economics of Transition 18: 281–331.
- Voss M, Nylén L, Floderus B, Diderichsen F, Terry PD (2004) Unemployment and early cause-specific mortality: a study based on the Swedish twin registry. Am J Public Health 94: 2155-2161. [Crossref]
- Wald I, Jaroszewski Z (1983) Alcohol consumption and alcoholic psychoses in Poland. J Stud Alcohol 44: 1040-1048. [Crossref]
- World Health Organization. Global status report on alcohol and health. Geneva:World Health organization 2014.
- Zaridze D, Maximovitch D, Lazarev A, Igitov V, Boroda A, et al. (2009) Alcohol poisoning is a main determinant of recent mortality trends in Russia: evidence from a detailed analysis of mortality statistics and autopsies. Int J Epidemiol 38: 143-153. [Crossref]
- Zatonski WA, Sulkowska U, Manczuk M, Rehm J, Boffetta P, et al. (2010) Liver cirrhosis mortality in Europe, with special attention to Central and Eastern Europe. European Addiction Research 16: 193-201.