Artificial living cells generated using defined compounds are useful for studying a myriad of problems in the life sciences. I have developed a method for generating artificial cells by incubating artificial cell seeds with a sphingosine (Sph)-DNA-adenosine mixture in egg white. However, the mechanism underlying artificial cell formation remains unclear. The present study examined the presence in egg white of the chemical components required to form artificial cells. The findings demonstrated that components bound to adenosine (adenosine-bound compounds; D-fraction) are present in egg-white and the compounds aggregate Sph-DNA. Moreover, cells were constructed upon addition of the components bound to adenosine (F-fraction) to the aggregates of Sph-DNA. TLC showed that the D-fraction mainly consists of adenosine-lipid compounds, whereas the F-fraction consists of free lipids. Thus, artificial cells may be formed as follows: Sph-DNA aggregates with the D-fraction, and cells (DNA crown cells) are constructed using the F-fraction and are covered with DNA. These findings suggest that DNA crown cells can grow in egg white.
adenosine-binding compound, aggregation, artificial cell formation, DNA crown cells, Sphingosine-DNA
There has been significant progress in the generation of artificial cells since the first studies in the 1960s [1-3], yet to date, artificial cells that can replicate autonomously have not been reported. Recent work on artificial cells has focused on cell division or replication [4]. I have studied approaches for generating fully operational (self-replicating) artificial cells [5,6] and have established a method [7] by which artificial cells can be cultivated and produce protein in egg white by combining adenosine with Sphingosine (Sph) and DNA.
However, the mechanism underlying the formation of artificial cells remains unclear. The present experiments examined whether the components that bind to adenosine and are associated with cell formation are present in egg white. To this end, adenosine was added to egg white and then the adenosine was recovered and fractionated. Adenosine was detected in F-fraction, a fraction that lacks protein and nucleic acids, and in D-Fraction, which contains nucleic acids that precipitate upon the addition of ethanol. The effects of the F- and D-fractions on Sph-DNA were examined. The results show that Sph-DNA aggregates when D-fraction is added to Sph-DNA, and that artificial cells covered with DNA, named DNA crown cells, were formed when F-fraction was added to Sph-DNA aggregates in vitro.
Also, these aggregates (Sph-DNA-D-fraction mixtures) could generate artificial cells within white-egg, specifically, artificial cells were generated when the aggregates were incubated with white-egg.
These findings indicate that the compounds that aggregate Sph-DNA are contained in the D-fraction of egg white, and the compounds that reconstitute Sph-DNA-aggregate cells are contained in the F-fraction obtained from egg white. As a result, DNA crown cells were generated and grown in egg white. The results obtained by HPLC and TLC on the D- and F-fractions suggest two interesting possibilities regarding the components: [1] The components that aggregate Sph-DNA may be adenosine-lipids, and [2] the components that construct the cells may be free lipids.
Herein, I demonstrate that the D-fraction (containing adenosine-lipids) aggregates Sph-DNA, and that DNA crown cells are constructed using the F-fraction (lipids). The present findings pose the question of whether DNA crown cells can self-replicate.
Materials
The following materials were used: Sph (Sigma, USA), DNA (Escherichia coli strain B, Sigma, USA), adenosine (Sigma, USA and Wako, Japan), the lipids monolaurin (Tokyo Kasei, Japan) and tribehenin (Tokyo Kasei, Japan), and white Leghorn eggs purchased from a market.
Preparation of egg white
Egg whites were injected with 0.5 ml of adenosine (0.1 M) and the eggs were incubated for 5 days at 37 °C, after which the egg white was collected and kept at 4 °C until use.
Sample preparation from egg white
Samples were prepared from egg white using a protocol similar to the protocol for extracting DNA with phenol/chloroform. A typical procedure involved incubating egg white (300 µl) at 65cC for 30 min in a microfuge tube, after which 400 µl of F-solution from a DNA extraction kit DNAs-ici!-F (Rizo Inc., Japan) was added and the tube contents were mixed. Then, 400 µl of phenol and 400 µl of chloroform were added and the tube contents were mixed until an emulsion formed. The tube was centrifuged for 10 min at 6,714×g and the precipitate was kept at 4○C. A pipette was used to transfer 300 µl of the upper layer (the aqueous phase) to a fresh tube and an equal volume (300 µl) of isopropanol was added and mixed. The tube was centrifuged for 10 min at 15,107×g, and the upper layer was collected and kept at 4 °C and used as the F-fraction. Then, 1 ml of 70% ethanol was added to the original tube, which was centrifuged at 15,107×g for 10 min. The precipitated DNA fraction was dissolved in 50 µl of distilled water. The fraction was divided between 10 tubes (5 µl sample each). This sample was used as the D-fraction. The F-fraction was dried and dissolved in 100 µg/ml of distilled water. Distilled water (50 µl) was added to the D-fraction. These samples (50~100μl) were used with the analysis of HPLC and TLC.
Effects of the F- and D-fractions on sphingosine-DNA
Sph (90 µl) was added to the DNA solution (40 µl), then D-fraction (50 µl) was added. After mixing, one drop of the mixture was placed on a glass slide and observed using phase contrast microscopy. Next, Sph (90 µl) was added to the DNA solution (40 µl) and then D-fraction (50 µl) was added. After mixing, F-fraction (100 µl) was added, the solution was mixed, and then one drop of the mixtures was placed on a glass slide after the addition of ethidium bromide solution and observed using a phase contrast microscope
and fluorescence microscope.
HPLC study
To investigate the presence of adenosine in the F- and D-fractions, both samples were dissolved in 1 ml of buffer (50 mM NaH2PO4, pH 2.4) and HPLC was conducted using the following parameters: Column: Develosil RPAQUEOUS (C30 UG-5, 4.6 mm i.d. × 250 mm, NOMURA CHEMICAL. CO., LTD, Japan); flow rate: 1.0 ml/min; temperature: 40°C; eluent: 50 mM NaH2PO4 (pH 2.4)/ acetonitrile (97/3); sample volume: 10 µl; detection: UV at 260 nm.
TLC study
The F-and D-fractions were extracted with 20% chloroform and the extracts were spotted on TLC plates and chromatographed using hexane:ether:acetic acid (80:20:1). After exposure to a solution of phosphate-molybdate (5%) and ethanol, the plates were heated. Monolaurin and tribehenin were chromatographed as standards.
Artificial cell generation using a mixture of Sph-DNA –D-fraction, (Sph-DNA-D)
The generation of artificial cells using Sph-DNA-D was tested as described above (5). Briefly, 90 µl of Sph (10 mM) and 40 µl of DNA (1.7 µg/µl) were mixed and the mixture was then heated. D-fraction (50 µl) was added, then the mixture was injected into the white (albumin) of an egg. After incubation at 37°C for 7 days, 1-2 ml of egg white potentially containing artificial cells was transferred to Dulbecco’ modified Eagles’ Medium containing 10% bovine serum (DMEM) and incubated at 37°C for 2 days. A drop of precipitate in culture medium was placed on a glass slide after the addition of ethidium bromide solution and observed using phase contrast microscopy and fluorescence microscopy.
Preparation of the compound formed by mixing F-fraction and adenosine (F-A solution)
F-fraction (1.0 ml, 100 µg) was added to 1.0 ml of adenosine solution (0.1 M). After mixing, 4.0 ml of ethanol was added, and the precipitate was dried and then analyzed by TLC as described above. The dried precipitate was re-dissolved in 1 ml of distilled water, and the effect of sphingosine-DNA was examined as described below.
Effect of compound (F-A) on Sphingosine-DNA
Sph (90 µl) was added to DNA solution (40 µl). After mixing, F-A solution (50 µl) was added and mixed, then one drop was placed on a glass slide and observed using phase contrast microscopy and florescence microscopy. Next, Sph-DNA mixture prepared as described above and F-A solution were added to the Sph-DNA mixtures, followed by F-fraction (100 µl). They were mixed. Then, one drop was placed on a glass slide after the addition of ethidium bromide solution and observed using phase contrast microscopy and fluorescence microscopy.
Effect of egg white (F- and D-fractions) on Sphingosine-DNA
The F- and D-fractions were extracted from the egg white of eggs injected with adenosine in order to investigate the effect of egg-white on the formation of artificial cells. First, F-fraction was added to Sph-DNA, mixed, then one drop was applied to a glass slide and immediately observed using phase contrast microscopy. No change in shape was observed. Next, D-fraction was added to the Sph-DNA mixture and the Sph-DNA aggregated (Figure 1a). Russell light was observed using florescence microscopy (Figure1b). F-fraction was added to this aggregate and round or particle-aggregate type cells emitting Russell light were formed (Figures 2a and 2b). A typical cell was approximately 10 µm in diameter (Figure 3a) and Russell light was observed on the exterior of the cells by fluorescence microscopy, suggesting that the surfaces of the cells were covered with DNA. The cells aggregated when incubated at 37°C for 60 min (Figure 3b). These findings showed that Sph-DNA aggregated upon the addition of D-fraction, that round or particle-like cells are formed upon the addition of F-fraction.
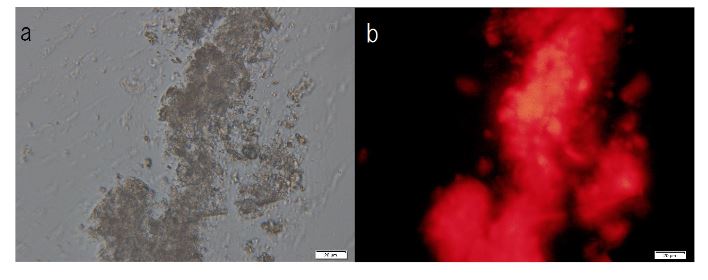
Figure 1. Aggregation of Sphingosine (Sph)-DNA with D-fraction. Sph was added to DNA, then D-fraction was added. Aggregates formed. The aggregates were stained with ethidium bromide solution. (a) Russell light was observed in the surface of the aggregates under fluorescence microscopy (b), suggesting that the surface consists of DNA. Scale bar: 20 µm
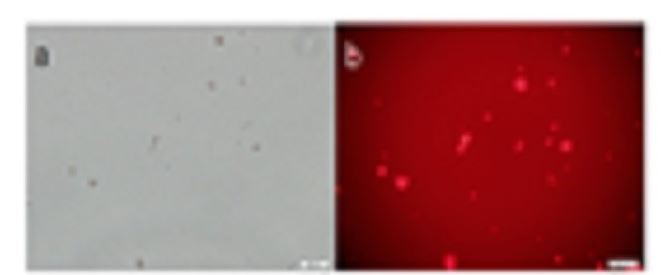
Figure 2. Construction of cells with F-fraction. Sph was added to DNA, mixed, then D-fraction was added, followed by the addition of F-fraction. The mixture was stained with ethidium bromide solution and smeared on a glass slide. The images in a) and b) show the same field of view. (a) Phase contrast microscopic observation, showing round or particle-like cells Scale bar: 50 µm (b) Russell light is observed in cells using fluorescence microscopy, indicating that DNA is present in the cells. Scale bar: 50 µm
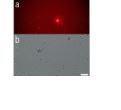
Figure 3. Typical cell constructed with F-fraction. Sph was added to DNA, then D-fraction was added, followed by the addition of F-fraction. (a) A drop was placed on a slide after the addition of ethidium bromide solution and observed using fluorescence microscopy. (b) A portion of the mixture was incubated for 30 min at 37 °C, and then a drop was placed on a slide and observed using phase contrast microscopy. Fig.3a Russell light was observed on the round cell surface, indicating that the edge of the cell consists of DNA. Scale bar: 20 mm
Analysis of F-fraction and D-fraction using HPLC and TLC
The presence of adenosine and lipids in the F- and D-fractions was determined using both HPLC and TLC,
HPLC study
HPLC chromatograms of the F-fraction and D-fraction are shown in (Figure 4a and Figure 4b) respectively. The peaks in the F-fraction and D-fraction at 6.54 or 6.53 min correspond to adenosine (standard: 6.50 min; data not shown), demonstrating the presence of adenosine in both the F- and D-fractions.
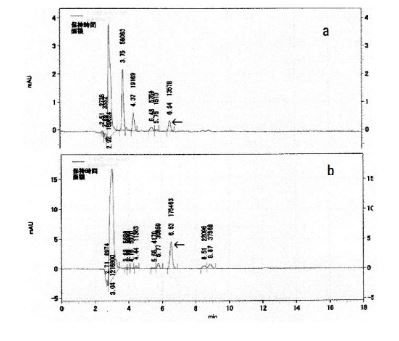
Figure 4. HPLC chromatograms of the D-fraction and the F-fraction. (a) Chromatogram for the D-fraction. Vertical scale is absorbance at 260 nm, and the chapter on the vertical scale represents retention time (min). The peak with a 6.54 minute retention time is highlighted with an arrow. (b) Chromatogram for the F-fraction. Vertical scale is absorbance at 260 nm, and the chapter on the vertical scale is retention time (min). The peak with a 6.53minute retention time is highlighted with an arrow. Purified adenosine had a retention time of 6.56 min (data not shown)
TLC study
The F- and D-fractions were chromatographed on thin layer plates and visualized. One spot was observed from the F-fraction (Figure 5a lane 1) whereas two spots were observed from the D-fraction (Figure 5a lane 2).
One spot was observed in common for both the F-fraction and D-fraction. The D-fraction generated a spot not seen in the F-fraction. These findings suggest that a component in the D-fraction may play a role in aggregation because the F-fraction cannot aggregate Sph, DNA and it is lacking a spot seen in the D-fraction (Figure 5b).
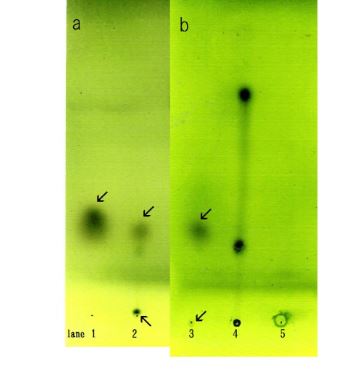
Figure 5. Thin-layer chromatograms of the F-fraction and D-fraction. Each sample was spotted on TLC plates, chromatographed, then visualized. (a) Spot from the F-fraction is shown in lane 1. One spot (arrow) was observed. Spots from the D-fraction are showed in lane 2. Two spots (arrows) were observed. One spot was observed in the original point. (b) Spots from the A-F fraction are shown in lane 3. Two spots (arrow) were observed. One faint spot was in the same location as in the F-fraction. Lane 4 shows purified tribehen in and Lane 5 purified monolaurin. (a) and (b) were carried out independently.
Artificial cell generation using the Sph-DNA-D fraction
Sph and DNA were mixed and heated, D-fraction was added, the mixture was incubated in egg-white, and the egg-white was then incubated with D-MEM. Artificial cells generated with Sph-DNA-D are shown in (Figure 6). Individual cells were observed as dots or aggregates (Figure 6a). Also, Russell light was observed in the cells using fluorescence microscopy, suggesting that they contain DNA (Figure 6b). These findings indicate that artificial cells were formed from the Sph-DNA-D-fraction mixture.
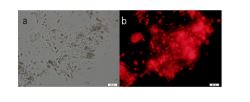
Figure 6. Artificial cells generated with mixtures of sphingosine-DNA-D-fraction incubated in egg white at 37 °C for 7 days in 2 ml of egg white in Dulbecco’s high glucose modified Eagle’s medium containing 10% bovine serum. Aggregates were stained with ethidium bromide and smeared on a glass slide. They were observed using a phase contrast microscope and fluorescence microscope. (a) Artificial cells were observed as a dot or as aggregates. (b) Russell light was observed on the surfaces of the cells using a fluorescence microscope, showing that DNA covered the cell surface. Scale bar is 20μm。
Separation of the compounds found in the mixture of F-fraction and adenosine
I attempted to separate the compounds in the mixture of F-fraction and adenosine, because D-fraction may comprise F-fraction and adenosine. Adenosine was added to F-fraction and precipitated with ethanol. Aggregates (F-A) were obtained. F-A was subjected to TLC and colored with sulfate. Two spots were observed (Figure 5b lane 3). A small spot was detected in original spot. This finding indicated that F-A consists of two kinds of lipids. Spots obtained using tribehenin and monolaurin standards are shown in (Figure 5 lane 4 and Figure 5 lane 5) respectively.
Effect of F-A on Sph-DNA
F-A was added to Sph-DNA solution, mixed, and immediately one drop was placed on a glass slide and observed using phase contrast microscopy and fluorescence microscopy. Two types of aggregates, mucoid type and crystal type, were observed. Typical crystal aggregates are shown in (Figure 7a). Russell light was observed on the edge of the crystals (Figure 7b) under fluorescence microscopy, suggesting that the edge consists of DNA. When F-fraction was added to the aggregates, cells were constructed, as shown in Figure 8a. Russell light was observed on the surfaces of the cells (Figure 8b) under fluorescence microscopy, suggesting that the surfaces of the cells were covered with DNA. Typical fluorescence cells are shown in (Figure 9). These observation demonstrated that aggregates of Sph-DNA were formed using F-A and cells were constructed using the F-fraction.
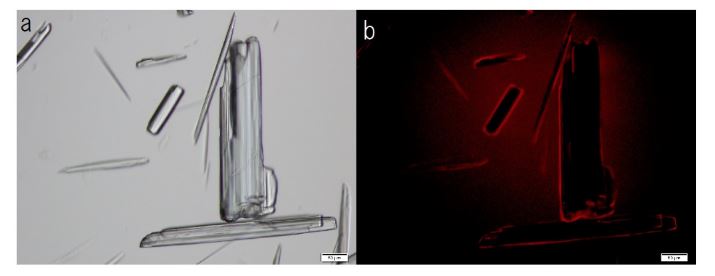
Figure 7. Structural integrity of Sph-DNA-aggregates formed with compounds in the adenosine-F-fraction. Sph was added to DNA, mixed, then compound A-F was added. A drop was smeared on a glass slide after the addition of ethidium bromide solution and observed using phase contrast microscopy and fluorescence microscope. (a) Crystal type aggregates were observed. (b) Russell light was observed on the edges of the aggregates using a fluorescence microscope, showing that the edge consists of DNA (Fig 7b). Scale bar is 50 µm.
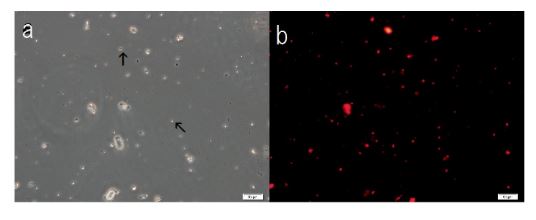
Figure 8. Structural integrity of cells formed with the addition of F-fraction to Sph-DNA-aggregates. Sph was added to DNA, mixed, then A-F compound was added. After mixing, F-fraction was added. A drop was smeared on a glass slide and observed under a phase contrast microscope and fluorescence microscope. (a) Cells are observed as dots (arrow) or aggregates (arrow). (b) Russell light was observed on the surfaces of the cells using a fluorescence microscope, showing that the cells contain DNA (Figure 8b). Scale bar is 50 µm
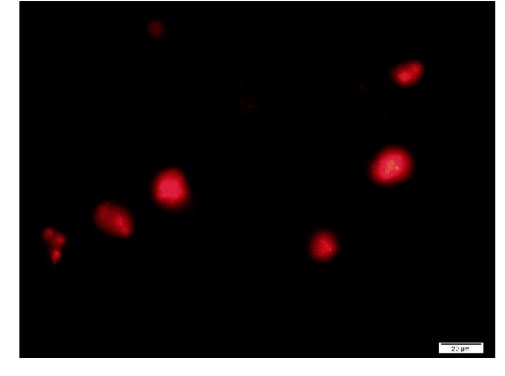
Figure 9. A typical cell formed with F-A compound. Sph was added to DNA, mixed, then A-F compound was added and then F-fraction was added. A drop was smeared on a glass slide and observed under a fluorescence microscope. Russell light was observed on the surfaces of the cells, showing that the cells contain DNA. Scale bar is 20 µm.
The mechanisms and elements required for the generation of artificial cells were unclear prior to this study, which determined if the elements essential for artificial cell generation are present in egg white.
Previously, I reported that artificial cell seeds required for the generation of artificial cells can be formed using Sph-DNA-adenosine [7]. This suggested that adenosine-associated factors may be present in egg white. Therefore, a large amount of adenosine was injected into the egg white of eggs and the adenosine in the egg white was determined using HPLC. Here, it may be very important that egg white 5 days after adenosine-administration was used, as shown by preliminary experiments.
Adenosine was detected both in the fraction (F-fraction) that lacked protein and nucleic acids and in the fraction (D-fraction) from which nucleic acids were extracted. It is very interesting that adenosine was present in the fraction from which DNA was extracted by precipitation with ethanol. Moreover, interestingly, Sph-DNA aggregated upon the addition of D-fraction, as described below in detail. These characteristics were not observed in the F-fraction. In addition, TLC analysis showed a difference between the F- and D-fractions: two spots were detected in the D-fraction, whereas one spot was detected in the F-fraction. The common spot had almost the same Rf value (Figure 5a, lanes 1 and 2). A second spot was observed in the D-fraction original spot (Figure 5a, lane 2). This demonstrated that the D-fraction contains a component that the F-fraction does not. On the other hand, it is unclear what component corresponds to this spot. However, the D-fraction contains adenosine and lipids and this component may exist as a compound, especially as an adenosine-lipid compound. The part of compounds may retain in original spot. monolaurin which was spotted as a standard retains in original spot (Figure 5b, lane 5). Therefore, the D-fraction may contain monolaurin. It is therefore likely that the D-fraction contains adenosine-lipid and therefore adenosine-F-fraction (A-F) compounds were prepared and investigated. A-F compounds were prepared by precipitation with ethanol after mixing adenosine and F-fraction. Next, to examine whether A-F aggregates Shp-DNA, A-F was added to the Sph-DNA mixture. Aggregates were observed.
Next, I discuss on the aggregates formed with both D-fraction and F-A compounds. Two types of aggregates, mucoid type and crystal type, were formed when D-fraction and F-A compounds are mixed. I showed mucoid type aggregates in the D-fraction (Figure 1) and crystal type aggregates in A-F compounds (Figure 7). However, the difference in the type of aggregate may be not important because crystal type aggregates were sometimes observed in the D-fraction and mucoid type aggregates was also observed in A-F compounds.
It is unclear why different aggregates were formed. Generally speaking, one reason may be the quality of the reagent, especially adenosine. If the adenosine is of low purity, it is possible that crystal type aggregates will occur. These aggregates may be formed by the following procedure: First, when Sph was added to DNA, fine fibers of Sph bound the DNA fibers [8,9] and many fine fibers (Sph-DNA) were formed in the presence of the D-fraction or F-A compounds. As a result, aggregates were formed. Cells were formed spontaneously when F-fraction was added to either the mucoid or crystal type aggregates, as shown in Figures 2 and 8. Russell light was observed on surfaces of typical cells upon fluorescence microscopy (Figures 3a and 9), suggesting that the cells are covered with DNA. On the other hand, cells that look like aggregates of particles and are not round were observed (Figure 2a). When a typical cell was incubated at 37 °C for 60 min, aggregate-like cells consisting of several small particles were observed (Figure 3b). Therefore, these cells may form during this short time. I plan to identify the phenomena that destroy the original cells or trigger mitosis of the original cells.
It is well known that artificial and natural cells comprise lipid-polymer protein complexes. Here, the surfaces of cells generated using Sph-DNA consist of DNA, suggesting that the components of the cells may comprise lipid-polymer DNA complexes. To date, the lipids in the D-fraction have not been determined. However, I carried out an experiment separate from the present research. I prepared a compound composed of adenosine and F-fraction (A-F) and tested whether it aggregates Sph-DNA. It did, suggesting that adenosine-lipids (in the F-fraction) aggregate Sph-DNA. This further suggested that several lipids, including monolaurate, bind adenosine and allow the preparation of aggregated Sph-DNA. On the other hand, it is unclear how cells are constructed using F-fraction. One possibility is that lipids in the F-fraction cover the aggregates, resulting in the construction of cells. Another possibility is that the D-fraction may be able to both aggregate and form cells and that the F-fraction may only accelerate cell construction. Based on these findings, artificial cells can be formed using Sph-DNA aggregates with D-fraction (adenosine-lipid compound) in egg white. The cells constructed using the F-fraction (lipids) in egg white are covered with DNA. Now, it remains unclear how artificial cells acquire the ability to self-replicate and generate progeny artificial cells.
Finally, to help make further studies more convenient, I named the cells that have lipid-DNA on the cell surface “DNA crown cells”.
I have established a method for generating artificial cells. The present experiments were conducted to clarify the mechanism by which artificial
cells are formed. Sph-DNA acts as the seed for generating artificial cells
and aggregated upon the addition of D-fraction, the fraction containing
DNA extracted from egg 2021 Copyright OAT. All rights reservupon the
addition of F-fraction, the fraction that lacks protein and DNA from egg
white. The D-fraction may contain a compound comprising adenosine
and lipids whereas the F-fraction does not contain this compound
but rather free adenosine and lipids. Thus, this procedure for forming
artificial cells demonstrated that the D-fraction contains adenosinelipid
aggregates of Sph-DNA and F-fraction and the free lipids in the
F-fraction, resulting in the construction of cells covered with DNA.
These results suggest that DNA crown cells represent the origin of
artificial cells.
I would like to thank I. Monna (Rizo Inc.) for assistance in extracting samples for adenosine analysis and for useful discussions, S. Higuchi (Saitama Industrial Technology Center Northern Laboratory, Japan) for assistance with analysis of the HPLC and TLC data and for useful discussions, and Tokyo Metropolitan Research Industrial Technology Institute for the use of laboratory space and fluorescence microscopes.
The author declares no competing financial interests.
- Zhang Y, Ruder WC, LeDuc PR (2008) Artificial cells: building bioinspired systems using small-scale biology. Trends Biotechnol 26: 14-20. [Crossref]
- Liu YJ, Hansen GP, Venancio-Marques A, Baigl D (2013) Cell-free preparation of functional and triggerable giant proteoliposomes. Chembiochem 14: 2243-2247. [Crossref]
- Kuruma Y, Stano P, Ueda T, Luisi PL (2009) A synthetic biology approach to the construction of membrane proteins in semi-synthetic minimal cells. Biochim Biophys Acta: 567-574
- Noireaux V, Maeda YT, Libchaber A (2011) Development of an artificial cell, from self-organization to computation and self-reproduction. Proc Natl Acad Sci USA 108: 3473-3480. [Crossref]
- Inooka S (2012) Preparation and cultivation of artificial cells. App Cell Biol: 13-18
- Inooka S (2016) Investigation of the chemical composition of artificial cell seeds; Sphingoisne-DNA bound components from extract of the meat from adult ascidians. International Journal of Current Research in Life Science: 534-540
- Inooka S (2016) Preparation of Artificial Cells Using Eggs with Sphingosine-DNA. J Chem Eng Process. Technol: 277
- Inooka S (2009) Cyto-organisms (cell-originated cultivable particles) with sphingosine-DNA. Comm. App Cell Biol: 11-34
- Inooka S (2014) Theory of cytoorganism generation (sequel). The track of the dawn of self-replicating artificial cells (in Japanese). Daigakukyouiku Press. Okayama, Japan