Abstract
Infantile-onset ascending hereditary spastic paralysis (IAHSP) is a rare, early onset, autosomal recessive motor neuron disease characterized by progressive weakness and spasticity. Several mutations in the alsin 2 gene (ALS2) have been described in IAHSP patients; however, a relevant subset of patients is ALS2 mutation-negative, and pathogenic events causing the disease are unknown. The present study aimed at better understanding the molecular mechanisms underlying motor neuron loss in IAHSP patients by identifying microRNAs (miRNAs) potentially implicated in neuronal differentiation. Using the human induced pluripotent stem cell (iPSC) technology, we developed a patient-specific in vitro cellular model and performed miRNome profiling in fibroblasts, iPSCs and iPSCs-derived neurons obtained from an ALS2 mutation-negative IAHSP patient and a healthy control. The selected differentially expressed miRNAs were also analyzed in fibroblasts, iPSCs and iPSCs-derived neurons from two patients affected by other motor neuron diseases, two patients with other neurological disease, and three healthy controls. We found that miR-376a, miR-432 and miR-451a expression was altered in cell cultures obtained from the IAHSP patient compared to the other patients and controls. In addition, the hierarchical clustering analysis revealed that miR-451a was differentially expressed in fibroblasts and iPSCs, whereas miR-376a and miR-432 in neuronal cells. These results, together with the miRNA/mRNA target analysis, were indicative of a significant involvement of miR-451a in stem cell biology processes, and of miR-376a and miR-432 in the establishment of the neuronal phenotype. Our overall findings identified miR-376a, miR-432 and miR-451a as molecules involved in neuronal differentiation, and potentially in IAHSP pathogenesis, which could provide cues for future development of patient-specific miRNA-based therapeutic strategies for IAHSP or other motor neuron diseases.
Key words
alsin, induced pluripotent stem cells, infantile-onset ascending hereditary spastic paralysis, microRNAs, motor neuron disease
Introduction
Motor neuron diseases (MNDs) are a heterogeneous group of neurological disorders characterized by a progressive and selective loss of motor neurons in the motor cortex, brainstem, and spinal cord [1], variably affected depending on the specific MND [2]. The spectrum of MNDs extends from childhood to adulthood and the variety of clinical manifestations reflects the numerous genetic alterations identified in patients with familial and sporadic MND [3,4].
MNDs with juvenile-onset include the infantile-onset ascending hereditary spastic paralysis (IAHSP), a rare fatal disorder characterized by weakness and spasticity due to a selective severe degeneration of the pyramidal tract, with onset at lower limbs within the first two years of life, and slowly progressive ascending evolution [5]. Familial occurrence of the disease suggests an autosomal recessive inheritance, and several mutations in alsin 2 gene (ALS2) have been described [5,6]. This gene encodes for a guanine nucleotide exchange factor abundantly expressed in motor neurons, and its mutations are also responsible for juvenile primary lateral sclerosis, that typically presents later in life, and juvenile amyotrophic lateral sclerosis (ALS), in which both upper and lower motor neurons are involved [6]. However, in a notable number of IAHSP patients no mutation was found in the coding sequence of ALS2 [7], indicating that IAHSP is a genetically heterogeneous syndrome. Pathophysiological mechanisms leading to progressive loss of motor neurons in IAHSP patients have not been clarified yet. Further genetic and molecular studies are needed to understand IAHSP pathogenesis, especially in those patients in whom a disease-causing mutation was not found.
An approach to disclose molecular mechanisms underlying MNDs is to establish in vitro models starting from human samples. The recently developed techniques allowing neuronal differentiation from induced pluripotent stem cells (iPSCs) obtained from patients’ skin fibroblasts represent a valuable system for in vitro modeling of neurological diseases and for the discovery of gene regulatory networks [8-10]. Several studies have shown that iPSCs from patients affected by neurological diseases, including ALS and spinal muscular atrophy (SMA), represent an ideal new patient-specific in vitro model to study and reveal molecular and cellular disease mechanisms, or to develop novel drugs [11-21]. Such an iPSC modeling for IAHSP has never been developed so far, thus its development promises to be relevant for understanding IAHSP pathogenesis.
In the context of stem cell biology, microRNAs (miRNAs) are of particular interest since they are involved in modulating stem cell self-renewal, pluripotency and neuronal cell differentiation [22-27]. MiRNAs have been identified as markers of cell identity and their expression profiles clearly distinguish different cell types [28-30]. In addition, the implication of miRNAs in neurodegenerative diseases has become evident in the last few years [31-35], particularly in the field of MNDs [31,34,35]. Growing evidence suggests that miRNAs are ideal candidates as biomarkers for neurodegenerative diseases, both for disease diagnosis and prognosis, and as potential therapeutic targets [36].
In this study we performed miRNome profiling in fibroblasts, iPSCs and iPSCs-derived neurons obtained from an ALS2 mutation-negative IAHSP patient and a healthy control, in order to disclose those miRNAs associated with neuronal differentiation stages, relevant for stem cell pluripotency and neuronal phenotype. The selected miRNAs, differentially expressed in IAHSP cells compared to control cells, were further investigated in fibroblast, iPSC and neuronal cell cultures from additional healthy controls, patients affected by ALS, SMA, and by neurological disorders other than MNDs (generalized epilepsy with febrile seizures plus condition – GEFS+, and severe myoclonic epilepsy at infancy – SMEI). Our findings identified a miRNA pattern associated with neuronal differentiation whose expression was altered in IAHSP cell cultures, thus providing new insights on miRNAs involved in IAHSP pathogenesis that could be further explored for future development of patient-specific miRNA-based therapeutic strategies for this disorder, and other MNDs.
Materials and methods
Reagents and source companies are listed in Supplemental Table 1.
Table 1. Dysregulated expression of selected miRNAs in IAHSP compared to control fibroblasts, iPSCs and iPSC-derived neuronal cells
miRNA | Discovery phase IAHSP versus healthy control | Validation phase |
IAHSP versus healthy controlsa | IAHSP versus pathological controlsb |
Fibroblasts | iPSCs | Neuronal cells | Fibroblasts | iPSCs | Neuronal cells | Fibroblasts | iPSCs | Neuronal cells |
miR-155 | - | Down | Down | - | - | - | - | - | - |
miR-376a | Down | Down | Down | - | - | Down | - | - | Down |
miR-432 | - | Up | Down | - | - | Down | - | - | Down |
miR-451a | Down | Up | - | Down | Up | - | Down | Down versus MNDs; Up versus NDs | - |
miR-490 | - | Down | - | - | - | - | - | - | - |
miR-520 | - | Down | Up | - | - | - | - | - | - |
miR-629 | Down | - | Up | - | - | - | - | - | - |
miR-657 | - | - | - | - | - | - | - | - | - |
miR-1289 | - | - | Up | - | - | - | - | - | - |
aHealthy controls included four healthy subjects without neurological diseases; bPathologic controls included two patients with motor neuron diseases (MNDs), one with ALS and one with SMA, and two patients affected by neurological diseases (NDs) other than MNDs, one with generalized epilepsy with febrile seizures plus condition (GEFS+), and one with severe myoclonic epilepsy at infancy (SMEI). Down: down-regulated; Up: up-regulated; -: not changed
Patients and clinical data
The study included: a 16-year-old boy affected by IAHSP (OMIM #607225) clinically defined, negative for ALS2 gene mutations; two patients affected by MNDs, one 35-year-old female patient with ALS (OMIM#105400) and one 3-year-old male patient with SMA (OMIM#253300); one 40-year-old female patient affected by generalized epilepsy with febrile seizures plus condition (GEFS+) (OMIM#604233), and one 40-year-old male with severe myoclonic epilepsy at infancy (SMEI) (OMIM#607208); three healthy females (36, 55 and 60 years old) and one male (50 years old) with no neurological diseases.
Written informed consent was obtained from IAHSP and SMA patients' parents, ALS, GEFS+ and SMEI patients, and from healthy controls. The study was approved by the local Ethics Committee and performed according to the amended Declaration of Helsinki.
Fibroblasts, iPSCs and iPSCs-derived neurons were obtained from all patients and healthy controls. Cells derived from the IAHSP patient and one healthy control were included in miRNome profiling and miRNA validation. Cells obtained from the patients affected by ALS, SMA, GEFS+ and SMEI, and the other three healthy controls were included in miRNA validation experiments.
Fibroblast cultures and iPSC generation
Fibroblasts were isolated from skin biopsies as previously described [37]. Cells were maintained and expanded until 3-4 passages in Dulbecco's modified Eagle medium (DMEM) supplemented with 20% fetal bovine serum (FBS), 1% L-Glutamine, 1% non-essential amino acids, 100 mM sodium pyruvate and 1% penicillin/streptomycin (P/S). Fibroblasts (2x10⁴ cells) were infected by using the STEMCCA Cre-Excisable Constitutive Polycistronic Lentivirus reprogramming and Nucleofector™ Kits, as previously described [38]. At day 25 post-infection, at least 10 iPSC clones were manually picked and cultured on mouse embryonic fibroblast feeder layer and maintained in human embryonic stem cell (ESC) medium containing 20 ng/mL basic fibroblast growth factor (bFGF), as described elsewhere [39], and expanded up to 3 passages for pluripotent status evaluation and analysis of morphology, and up to 20 passages for neuronal cell differentiation induction. All the experiments were performed on three iPSC lines obtained from three iPSC clones derived from each patient and healthy control.
RNA isolation from iPSCs and cDNA synthesis
Total RNA was extracted using TRIzol reagent from 1 to 2 × 10⁶ iPSCs, and its quality was checked using a 2100Nano Bioanalyzer (Agilent Technologies, Waldbron, Germany). Total RNA (100 ng) was retro-transcribed using SuperScript VILO cDNA Synthesis kit.
PCR analysis for pluripotency markers
To demonstrate the pluripotency of iPSCs, cDNA obtained from iPSC lines was amplified by PCR using primers specific for Oct4, Sox2, Nanog and Lin-28 genes, all markers of pluripotency, as previously described [40]. GAPDH was examined as housekeeping gene. Sequences of primers are reported in Supplemental Table 1. PCR products were run on DNA stain clear G-stained 1% agarose gel by electrophoresis.
Real-time PCR for AKT1 and Bcl2 in iPSCs
To analyze AKT1 and Bcl2 mRNA expression in iPSCs, cDNA was amplified by Taqman gene expression assays specific for AKT1 and Bcl2 gene on the ViiA7 Real time PCR system (Thermo Fisher Scientific, Waltham, MA, USA). 18s ribosomal RNA was stably expressed in both control and IAHSP cells (standard deviation of Ct values: < 0.5) and was used as endogenous control. Transcriptional levels of the target genes were expressed as relative values (2-ΔCt) normalized towards 18s levels.
Flow cytometry of apoptotic cell death in iPSCs
Flow cytometry analysis of apoptotic events was performed in two iPSC lines from the IAHSP patient and a healthy control using the Attune NxT Acoustic Focusing Cytometer (Thermo Fisher Scientific). iPSCs were stained using annexin V-FITC apoptosis detection kit following manufacturer's instructions. A minimum of 40,000 events was acquired for each sample. Annexin V-positive events were considered apoptotic cells. Analysis was performed using FlowJo vX.0.7 data analysis software (Tree Star, Ashland, Oregon, USA).
Generation of neuronal precursors
iPSCs were resuspended in human ESC medium without bFGF and cultured as spheres in low binding non-treated dishes to form embryoid bodies (EBs). After 5-6 days, EBs were collected and plated in Matrigel-coated dishes and maintained for 4-5 days in neuronal induction medium (DMEM/F12) plus 1% N-2 supplement and 20 ng/mL bFGF, to obtain neural rosettes. The medium was then replaced with the Neurobasal medium plus 1% N-2 supplement and after 10 days neuronal precursors and neurons were obtained. To obtain motor neurons, the rosettes, maintained in Neurobasal medium plus 1% N-2 supplement, were manually picked, plated in Matrigel-coated dishes and cultured with 1 μM cyclic adenosine 3′,5′-monophosphate (cAMP), 1% P/S, 0.1 μM retinoic acid (RA) and 50 ng/mL Sonic Hedgehog (SHH) [39]. Adherent neural progenitors were dissociated with 1X accutase and plated on Matrigel-treated dishes for further analysis.
Immunofluorescence
Immunostaining analysis was performed on iPSCs, EBs, neural rosettes and neuronal cells plated onto Matrigel-treated glass coverslips. The cells were fixed in 4% paraformaldehyde at room temperature for 20 min, permeabilized with 0.1% Triton X-100 and treated with 10% normal goat serum in PBS to block non-specific binding. iPSCs and EBs were incubated with a combination of the following primary antibodies: rabbit anti-Nanog, mouse anti-Sox2 and rabbit anti-Oct-4 antibodies, mouse anti-TRA-1-60, all markers of pluripotency [40]. To assess the proliferative activity, iPSCs were stained with the rabbit anti-Ki67 antibody. Neural rosettes were immunostained with mouse anti-nestin antibody. Neuronal cells were stained with a combination of the following primary antibodies: mouse anti-β-tubulin III (β-TubIII), mouse anti-microtubule associated protein 2 (MAP2) and rabbit anti-homeobox gene Hb9 (Hb9), mouse anti-neuronal nuclei (NeuN), markers of immature motor neurons. Immunopositivity was revealed with Alexa Fluor 488-conjugated goat anti-mouse IgG and Cy3-conjugated goat anti-rabbit IgG secondary antibodies. Cells were counterstained with 4',6-diamidino-2-phenylindole (DAPI) and the coverslips were mounted with FluorSave. Confocal fluorescence images were obtained with a laser-scanning microscope (Eclipse TE 2000-E, Nikon, Tokyo) and analyzed using EZ-C1 3.70 imaging software (Nikon). Antibody details and working dilutions are summarized in Supplemental Table 1. For alkaline phosphatase colorimetric detection, iPSC cultures were stained with 5-Bromo-4-chloro-3-indolyl phosphate and Nitro Blue Tetrazolium.
Quantification of iPSCs, EBs and neuronal cells
For iPSC diameter measurement, one hundred DAPI-positive iPSC clones were acquired for each of the three IAHSP and three control iPSC lines using EZ-C1 3.70 imaging software (Nikon). The diameter of each iPSC clone, defined as the widest transversal distance, was measured and expressed as mean ± standard deviation (SD). The number of DAPI-positive cells forming each iPSC clone was counted using Image Pro-Plus (Media Cybernetics, Silver Spring, MD, USA) and expressed as mean ± SD. To assess the proliferative activity, fifty iPSC clones were examined for each of the three IAHSP and three control iPSC lines after immunofluorescence staining specific for the Ki67 antigen followed by cell counting using Image Pro-Plus (Media Cybernetics). The percentage of Ki67-positive cells in each iPSC clone was calculated in relation to the total number of DAPI-positive cells/field and expressed as mean ± SD for each examined group.
For EB diameter measurement, ten DAPI-positive EBs were acquired for each of the three EB lines derived from the three IAHSP and three control iPSC lines, using EZ-C1 3.70 imaging software (Nikon), and the size was reported as mean ± SD. β-TubIII- and MAP2-positive neurons were counted on four randomly selected fields per coverslip. Two coverslips were analyzed for each of the three IAHSP and three control iPSC-derived neuron cell lines. The total number of β-TubIII- and MAP2-positive cells/field was expressed as mean ± SD for each examined group. For neurite length measurement, β-TubIII and MAP2-positive neurons were manually selected on four randomly selected fields per coverslip, and the longest neurite of each selected cell was measured using EZ-C1 3.70 imaging software (Nikon) and expressed as mean ± SD. Two coverslips were analyzed for each of the three IAHSP and control iPSC-derived neuron cell lines. For Hb9-positive motor neuron quantification a mean of one hundred cells/field were counted on four randomly selected fields per coverslip. Two coverslips were analyzed for each of the three IAHSP and three control iPSC-derived motor neuron cell lines for a total number of thirty neural rosettes. The percentages of Hb9-positive motor neurons were calculated in relation to the total number of DAPI- and β-TubIII-positive cells/field and expressed as mean ± SD for each examined group.
miRNome profiling and data analysis
Total RNA was extracted from 1 to 2 × 10⁶ fibroblasts, iPSCs and neuronal cells obtained from the IAHSP patient and one healthy control and reverse transcribed using Megaplex RT primers Human Pool A and B and MultiScribe Reverse Transcriptase Kit. cDNA, corresponding to 500 ng total RNA, was combined with TaqMan Universal PCR Master Mix and dispensed into each port of the TaqMan Human MicroRNA array card A and B v2.0, following the manufacturer’s instructions. The arrays were run on the Viia 7 Fast Real-Time PCR System (Thermo Fisher Scientific) in triplicate. Human array A and B cards contained primers for 381 miRNAs, including 3 positive control miRNAs and 1 negative control. All the results were normalized against U6 endogenous control [41,42] and relative miRNA expression levels were calculated using the ΔCt method.
miRNA validation by real-time PCR
miRNAs differentially expressed between IAHSP and control fibroblasts, iPSCs and neuronal cells were selected for validation by real-time PCR based on fold change ≥ 3 criterion and literature data [43˗51]. Total RNA was extracted from 1 to 2 × 10⁶ fibroblasts, iPSCs and neuronal cells from the IAHSP patient, the four healthy controls and the ALS, SMA, GEFS+ and SMEI patients using TRIzol reagent. RNA quality was checked by 2100Nano Bioanalyzer (Agilent Technologies). RNA was reverse transcribed using TaqMan MicroRNA Reverse Transcription Kit with primers specific for the selected miRNAs: miR-155, miR-376a, miR-432, miR-451a, miR-490, miR-520, miR-629, miR-657, and miR-1289. U6 was used as endogenous control [41,42]. cDNA (corresponding to 15 ng of total RNA) was amplified in triplicates by real-time PCR, using Universal PCR master mix and pre-designed TaqMan MicroRNA assays on the Viia 7 Fast Real-Time PCR System (Thermo Fisher Scientific). All the results were normalized against U6 and the relative miRNA expression levels were calculated using the ΔCt method.
Predicted miRNA-mRNA network construction
In silico prediction of miRNA targets was performed using the DIANA-microT-CDS algorithm from the DIANA miRNA database using the default score cut-off [52]. Predicted annotation of gene targets of validated miRNAs was made using Cytoscape, version 2.8.2 (http://www.cytoscape.org/), with the ClueGO plugin [53] and using the metabolic pathways (KEGG, Biocarta) and gene ontology biological process terms. ClueGO displays the functional terms as nodes, and the relationships between the terms, based on the similarity of their associated genes, are shown as edges. The degree of connectivity between terms was calculated by Cohen's kappa statistics using a threshold cutoff n = 0.4.
Real-time PCR for mRNA targets
mRNA targets were selected for validation by real-time PCR considering three genes for each miRNA with a default score cut-off equal to 0.9-0.8. RNA, previous extracted from 1 to 2 × 10⁶ fibroblasts, iPSCs and neuronal cells from the IAHSP patient, the ALS, SMA, GEFS+ and SMEI patients and the four healthy controls, was retro-transcribed using SuperScript VILO cDNA Synthesis kit. cDNA was amplified by Taqman gene expression assays specific for CAB39, DNAJA1, EIF4B, KMTC2, NDUFAB1, PSMB8, TSC1, TSG101, SMURF1. 18s gene was used as endogenous control. cDNA (corresponding to 10 ng of total RNA) was amplified in duplicates by real-time PCR, using TaqMan Fast Master Mix and TaqMan gene assays on the Viia 7 Fast Real-Time PCR System (Thermo Fisher Scientific). All the results were normalized against 18s and the relative gene expression levels were calculated using the 2-ΔCt method.
Statistical analysis
Data analysis was performed with the R Statistical environment (version 3.0.2.) (www.r-statistics.org). Mann-Whitney test was applied to compare experimental data derived from IAHSP and control cells. Bonferroni correction was applied to control for false discovery rate. P value < 0.05 was considered significant. MiRNA data analysis was performed by hierarchical clustering of miRNAs and samples, using the mean values of relative expression converted to a log2 scale. An heat map diagram was obtained to show clustering results. Relationship between the expression of each miRNA and its mRNA targets was evaluated by obtaining “before-after graphs” showing the miRNA/mRNA correlation trend in the IAHSP patient cells, and cells from all the other patients and healthy controls.
Results
Generation of IAHSP iPSC lines
We generated iPSC lines by reprogramming fibroblasts from an IAHSP patient and a healthy control. Both IAHSP and control iPSCs were positive for alkaline phosphatase (Figure 1A), normally detected in undifferentiated pluripotent stem cells [38], and expressed the pluripotency markers Nanog, Lin-28, Sox2 and OCT4 [40] (Figure 1B/C), thus indicating that they were pluripotent. The IAHSP iPSCs showed a smaller size, as estimated by diameter measurement, and a lower number of DAPI-positive cells than control iPSCs (p < 0.001) (Figure 1D). To assess possible apoptotic events, we evaluated the transcriptional levels of the apoptosis regulator Bcl2 by real-time PCR (Supplemental Figure 1) and estimated the percentage of annexin V-positive apoptotic cells by flow cytometry (Supplemental Figures 2): Bcl2 was over-expressed in IAHSP iPSCs compared to control cells and the percentage of annexin V-positive cells was higher in IAHSP than in control iPSCs, but both values did not reach significance. By immunofluorescence, we found a decreased proportion of IAHSP iPSCs expressing the proliferation-associated Ki67 antigen compared to control cells (p < 0.001) (Figure 1E). Moreover, the expression levels of AKT1, a serine-threonine protein kinase functioning as a critical regulator of cell proliferation and survival [54], was also decreased in IAHSP iPSCs compared to control cells (p < 0.05) (Figure 1F), thus suggesting a reduced proliferation ability and survival of iPSCs derived from the IAHSP patient.
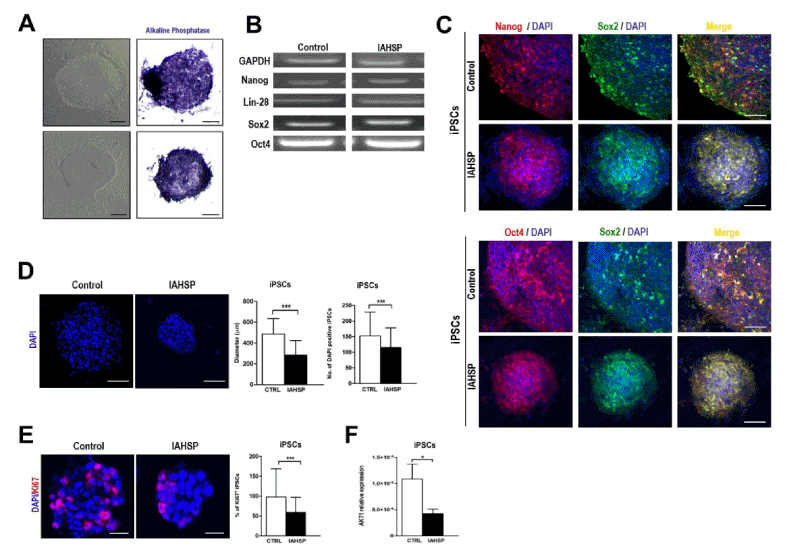
Figure 1. Generation of iPSC colonies. Representative images of control (upper panels) and IAHSP (lower panels) iPSC colonies obtained by phase contrast microscopy (left panels) and bright field microscopy after staining with phosphatase alkaline (right panels) (A). Expression analysis by PCR of the pluripotency markers Nanog, Lin-28, Sox2, and Oct4, and of the housekeeping gene GAPDH, in control and IAHSP iPSC clones (B). Confocal microscopy images of control and IAHSP iPSC clones positive for Nanog (red) and Sox2 (green) (upper panels), and for Oct4 (red) and Sox2 (green) (lower panels), with cell nuclei stained with DAPI (blue) (C). Confocal microscopy images of control and IAHSP iPSC clones showing cell nuclei stained with DAPI (blue) (D, panels in left side). Quantification of diameter, defined as the widest transversal distance and espressed as mean ± standard deviation (SD), of one hundred DAPI-positive iPSC clones obtained from control (n=3) and IAHSP (n=3) iPSC lines (D, left graph in right side); number of DAPI-positive cells forming the iPSC clones expressed as mean ± SD (D, right graph in right side). Confocal microscopy images of control and IAHSP iPSC clones after immunostaining specific for the proliferation marker Ki67 (red) and counterstaining with DAPI (blue) (E, panels in left side). Mean percentage of Ki67-positive cells ± SD calculated in relation to the total number of DAPI-positive cells/field for each clone in fifty iPSC clones from control (n=3) and IAHSP (n=3) iPSC lines (E, graph in right side). Real-time PCR analysis of AKT1 gene expression levels in control (white bar), and IAHSP (black bar) iPSCs (n = 3 iPSC lines per group), *p < 0.05; ***p < 0.001: Mann-Whitney test (F). Magnification bars: 80 μm in A, C and D; 30 μm in E.
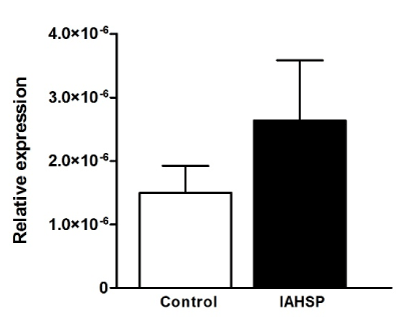
Supplemental Figure 1. Expression levels of Bcl2 in control and IAHSP iPSCs
Real time-PCR analysis of Bcl2 expression in control (white bar) and IAHSP (black bar) iPSCs (n = 3 colonies per group). Transcriptional levels of the target gene were expressed as relative values (2-ΔCt) normalized with 18s
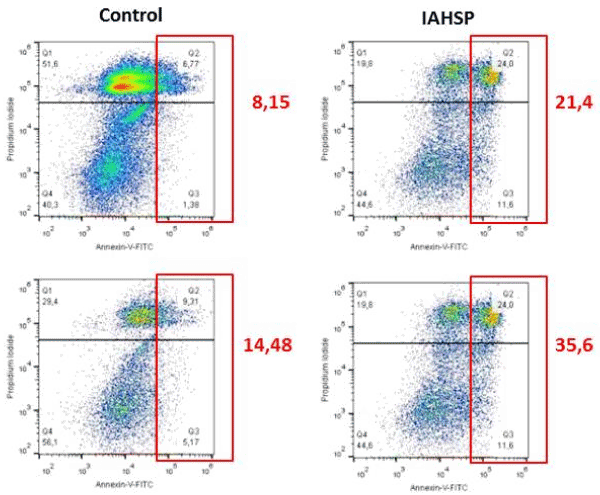
Supplemental Figure 2. Apoptotic events in control and IAHSP iPSCs
Flow cytometry analysis of apoptotic events in control (left column) and IAHSP (right column) iPSCs (n = 2 iPSC lines per group) using annexin V-FITC apoptosis detection kit. Percentages of Annexin V-positive apoptotic cells (red squares) in each sample are reported
Generation of IAHSP neurons and motor neuron precursors
At first, we induced the formation of EBs from IAHSP and control iPSCs (Figure 2A). By immunofluorescence, EBs were positive for the pluripotency markers Sox2, Nanog and Oct4 [40] (Figure 2B/C). They were maintained in appropriate conditions for five days and subsequently differentiated in neural rosettes (Figure 2A). Neural rosettes showed immunoreactivity to nestin, a specific marker of neural stem cells [39], in both groups examined (Figure 2D). IAHSP and control EBs and neural rosettes had similar morphology and did not show significant differences in size (Figure 2E).
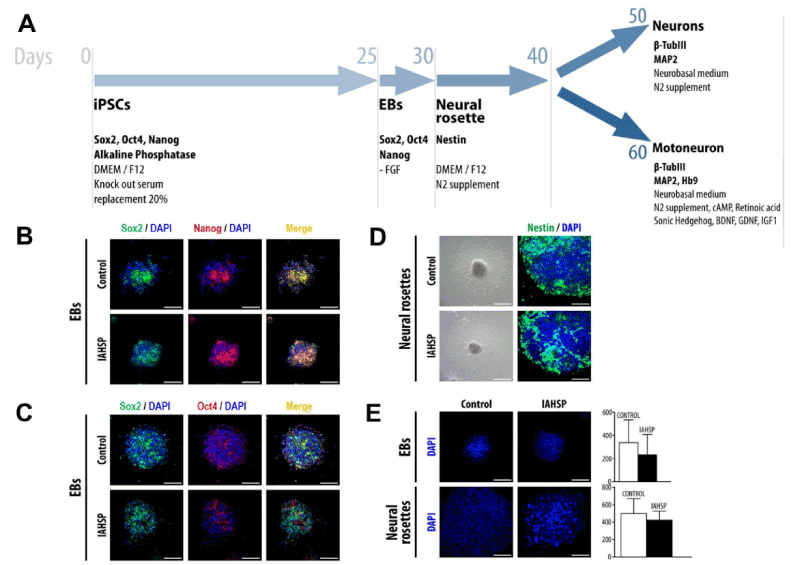
Figure 2. Differentiation of iPSCs into neuronal phenotype cells. Schematic representation of motor neuron differentiation protocol (A). Confocal microscopy of EBs, obtained from control and IAHSP iPSCs, positive for Sox2 (green), Nanog (red), and DAPI (blue) (B). Confocal microscopy of control and IAHSP iPSC-derived EBs positive for Sox2 (green), Oct4 (red) and DAPI (blue) (C). Representative images of neural rosettes derived from control and IAHSP EBs obtained by bright field microscopy (D, left panels); confocal microscopy images of control and IAHSP neural rosettes stained for nestin (green) and DAPI (blue) (D, right panels). Confocal microscopy images of EBs (upper panels) and neural rosettes (lower panels) obtained from control and IAHSP iPSCs stained with DAPI (blue) (E, left side); quantification of EB (upper graph) and neural rosette (lower graph) diameter in 30 EBs and 30 neural rosettes obtained from control (n=3) and IAHSP (n=3) iPSC lines, expressed as mean ± SD (E, right side). Magnification bars: 80 μm in all panels.
EB-derived neural rosettes were then maintained for 10 days in N2 supplement, to obtain neuronal cells (Figure 2A). Interestingly, IAHSP neural rosettes generated a greater proportion of MAP2- and β-TubIII-positive neurons than those from control cultures (p < 0.05) (Figure 3A/B). However, neurons derived from IAHSP iPSCs displayed shorter neurites than control neurons, as shown by measurement of the neurite length (p < 0.001) (Figure 3C).
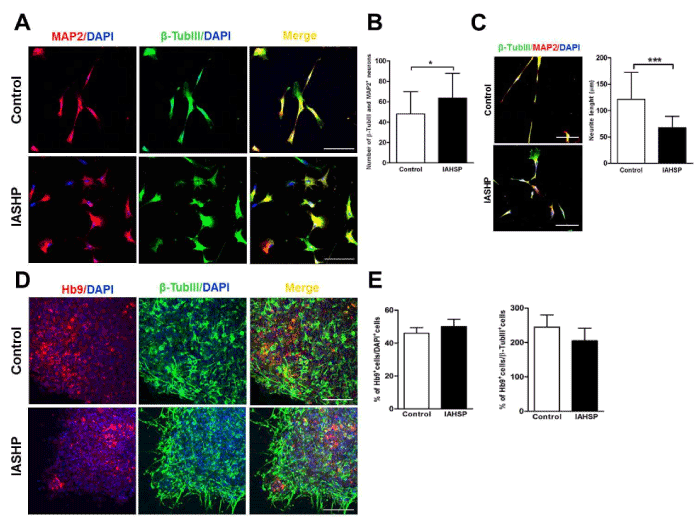
Figure 3. Differentiation of iPSCs into motor neurons. Confocal microscopy images of control and IAHSP iPSC-derived neurons positive for MAP2 (red), β-TubIII (green) and DAPI (blue) (A). Quantification of neurons performed on four randomly selected fields per coverslip in two coverslips for each control (n=3) and IAHSP (n=3) iPSC line-derived neuronal culture, expressed as means ± SD of the total number of β- TubIII- and MAP2-positive cells/field, *p < 0.05: Mann-Whitney test (B). Confocal microscopy images of control and IAHSP iPSC-derived neurons positive for β-TubIII (green), MAP2 (red) and DAPI (blue) (C, panels in left side). Measurement of the neurite length of β-TubIII- and MAP2-positive neurons performed on four randomly selected fields per coverslip in two coverslips for each control (n=3) and IAHSP (n=3) culture, expressed as mean ± SD, ***p < 0.001: Mann-Whitney test (C, graph in right side). Confocal microscopy images of control and IAHSP iPSC-derived motor neurons positive for Hb9 (red), β-TubIII (green) and DAPI (blue) (D). Quantification of the mean percentage ± SD of Hb9-positive motor neurons in relation to the total number of DAPI-positive (left graph) and β-TubIII-positive (right graph) cells/field in control (n=3) and IAHSP (n=3) iPSC line-derived motor neuron cultures (E). Magnification bars: 80 μm in all panels.
To obtain spinal motor neurons, IAHSP and control neural rosettes were manually picked and cultured with RA to establish a caudal position, and subsequently with the addition of SHH to promote ventral position according to the protocol previously described by Erceg and colleagues (2010) (Figure 2A). By day 50 of the differentiation protocol, IAHSP and control cultures were characterized by a substantial number of cells displaying a motor-specific expression pattern, i.e. positivity for Hb9, a transcription factor induced during motor neuron differentiation, and β-TubIII (Figure 3D). No significant differences in the percentage of Hb9-positive motor neurons were observed between IAHSP and control cultures (Figure 3E).
miRNome profiling in IAHSP fibroblasts, iPSCs and neuronal cells
To identify miRNAs relevant for stem cell biology and neuronal differentiation, potentially implicated in IAHSP, we performed a miRNome expression profiling, including 381 human miRNAs, in fibroblasts, iPSCs and neuronal cells derived from the IAHSP patient and a healthy control. In the discovery phase, we revealed that 70 miRNAs were differently expressed in IAHSP compared to control fibroblasts, with 24 miRNAs being up-regulated and 46 down-regulated (Figure 4A). In IAHSP iPSCs the expression of 179 miRNAs was dysregulated compared to control iPSCs, including 77 miRNAs up-regulated and 102 down-regulated (Figure 4B). Moreover, 262 miRNAs were differentially expressed in IAHSP neuronal cells compared to control cells, including 32 miRNAs up-regulated and 230 down-regulated (Figure 4C).
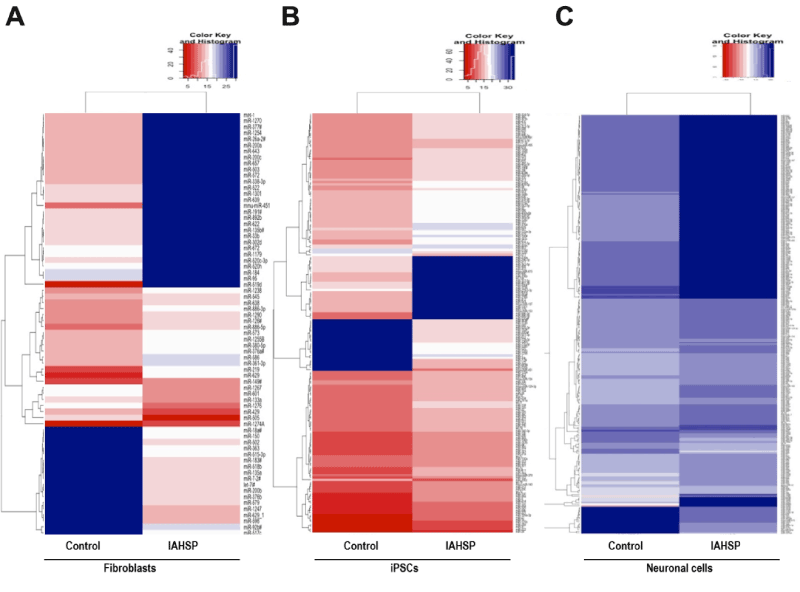
Figure 4. Heat map representation of miRNA expression profile in control and IAHSP fibroblasts, iPSCs and iPSC-derived neuronal cells. Comparison of expression levels of differentially expressed miRNAs, normalized against U6 endogenous control and calculated using the ΔCt method, in control and IAHSP fibroblasts (A), iPSCs (B) and neuronal cells (C). In rainbow scale color, blue indicates down-regulation and red indicates up-regulation of miRNAs in IAHSP cells compared to control cultures.
Among miRNAs differentially expressed in IAHSP compared to control cultures, we selected for validation 9 miRNAs, based on fold-change values greater than 3 and on their known role in stem cell biology and motor neuron diseases: miR-155, miR-376a, miR-432, miR-451a, miR-490, miR-520, miR-629, miR-657, and miR-1289. Data from miRNome profiling on the expression of these molecules revealed that: i) miR-376a, miR-451a, and miR-629 were down-regulated in IAHSP fibroblasts compared to control cells (Figure 4A and Table 1); ii) miR-155, miR-376a, miR-490, and miR-520 were down-regulated, whereas miR-432 and miR-451a were up-regulated in IAHSP iPSCs compared to control iPSCs (Figure 4B and Table 1); iii) miR-155, miR-376a, and miR-432 were down-regulated, whereas miR-520, miR-629, and miR-1289 were up-regulated in IAHSP neuronal cells compared to control cells (Figure 4C and Table 1).
Differences in miRNA expression between IAHSP and control cells were not related to differences in the efficiency of fibroblast isolation and reprogramming, since fibroblast morphology and the number of iPSC colonies obtained from 2x10⁴ reprogramming fibroblasts (8 to 10 colonies) were comparable among the examined sample groups (~ 0.2% efficiency).
miRNA validation: identification of miR-376a, miR-432 and miR-451a as modulators of neuronal differentiation in IAHSP
To validate data from miRNoma profiling, the 9 selected miRNAs were analysed by real-time PCR in fibroblasts, iPSCs, and neuronal cells derived from the IAHSP patient and the healthy control included in the discovery phase, and in fibroblasts, iPSCs and neuronal cells derived from additional three healthy controls, two patients affected by MNDs – one affected by ALS and one by SMA –, and two patients affected by neurological diseases different from MNDs, GEFS+ and SMEI (Supplemental Figure 3/4). The results of the validation phase showed that miR-451a expression was decreased in IAHSP fibroblasts compared to fibroblasts of healthy controls, MND, GEFS+ and SMEI patients (Figure 5), in line with the previous miRNome profiling data, whereas miR-376a and miR-629 levels were similar in all the fibroblast cultures analyzed (Supplemental Figure 5 and Table 1). In iPSCs, miR-451a was up-regulated in IAHSP compared to healthy control, GEFS+ and SMEI cells, confirming miRNome profiling results, but it was down-regulated if compared with MND iPSCs (Figure 5 and Table 1). All the other miRNAs, miR-155, miR-376a, miR-432, miR-520, and miR-490, whose expression was altered in the discovery phase, were not detected or expressed at similar levels in the analyzed iPSC samples (Supplemental Figure 5 and Table 1). Validation of miRNAs in neuronal cells showed a significant reduction of miR-376a and miR-432 in IAHSP compared to all the other samples (Figure 5 and Table 1), in agreement with the discovery phase data. Contrariwise, miR-155 down-regulation in IAHSP neuronal cells was not confirmed, as well as up-regulation of miR-520, miR-629 and miR-1289. Indeed, miR-155 and miR-520 were expressed at similar levels among IAHSP, SMA and healthy control cells, and were not detected in ALS, GEFS+ and SMEI cells; miR-629 expression was similar in IAHSP compared to all the analyzed neuronal samples; miR-1289 was not detected in all cultures (Supplemental Figure 5).
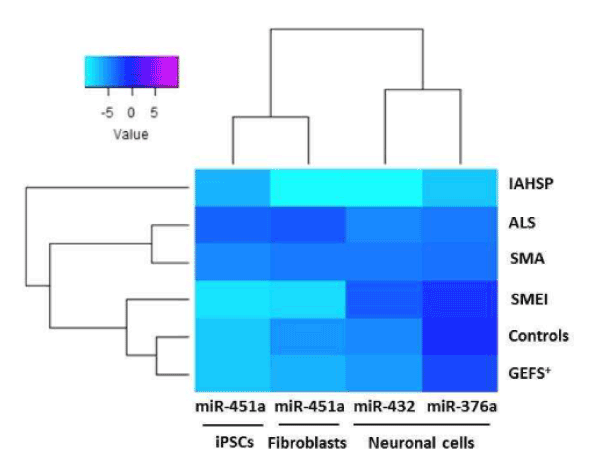
Figure 5. Heat map representation of validated miRNA (miR-376a, miR-432, miR-451a) expression in healthy control, pathological control and IAHSP fibroblasts, iPSCs, and neuronal cell cultures. Comparison of the expression levels of validated miRNAs, miR-376a, miR-432, and miR-451a, in fibroblasts, iPSC and neuronal cells from four healthy subjects without neurological diseases, two patients with motor neuron diseases (MNDs), one with ALS and one with SMA, and two patients affected by neurological diseases other than MNDs, one with generalized epilepsy with febrile seizures plus condition (GEFS+), and one with severe myoclonic epilepsy at infancy (SMEI). miRNAs levels were reported as log 2-transformed relative expression and normalized against U6 endogenous control. Rainbow scale color is representative of expression level values from negative (light cyan) to positive (magenta).

Supplemental Figure 3. Generation of iPSCs and EBs by reprogramming fibroblasts from familial epilepsy patients (GEFS+ and SMEI)
Representative images of iPSC clones obtained from an healthy control and two patients affected by familial epilepsy, one with generalized epilepsy with febrile seizure plus (GEFS+) and one with severe myoclonic epilepsy at infancy (SMEI) (A). Representative image of iPSC clone-derived EBs from the healthy control and the GEFS+ and SMEI patients. Magnification bars: 80 μm
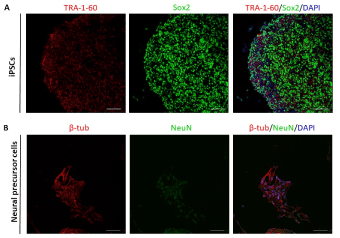
Supplemental Figure 4. Generation of iPSCs, neuronal precursors cells by reprogramming fibroblasts from motor neuron disease patients (ALS and SMA)
(A) Representative images of an iPSC colony obtained from SMA patient's fibroblasts positive for the stem cell markers TRA-1-60 (red), SOX2 (green). iPSCs were obtained also from ALS and healthy subject fibroblasts. (B) Representative images of neural precursors obtained from SMA iPSCs positive for b-tub (red) and NeuN (green). Neural precursors were obtained also from ALS and healthy iPSCs. Nuclei are stained with DAPI (blue). Scale bars: 70 μm
Taken together, these data identified an altered expression profile of miR-376a, miR-432 and miR-451a in IAHSP fibroblasts, iPSCs and neuronal cells compared to the corresponding cell cultures from healthy controls and patients affected by ALS, SMA, SMEI and GEFS+ (Figure 5 and Table 1). Interestingly, the hierarchical clustering analysis showed a distinct miRNA cluster characterizing IAHSP samples compared to healthy control, ALS, SMA, SMEI and GEFS+ samples, suggesting that altered expression of the identified miRNAs might contribute to IAHSP pathogenesis. A sub-cluster distinctive of ALS and SMA compared to all the other samples was also disclosed, leading to the hypothesis that a fine balance of miR-376a, miR-432 and miR-451a expression levels may be critical in MNDs. Of note, the hierarchical clustering analysis also revealed two different clusters of miRNAs, one characterizing fibroblasts and iPSCs, which included miR-451a, and the other one being associated with the neuronal cell phenotype, which included miR-376a and miR-432. These results suggested that miR-451a is specifically involved in stem cell biology processes, whereas miR-376a and miR-432 participate in neuronal differentiation processes.
In-silico miRNA target prediction and functional network construction
A network was constructed to visualize the functional connections of miR-376a, miR-432, and miR-451a, and their predicted targets, and the annotations involved in motor neuron disease-related processes (Figure 6). miR-376 resulted a regulator of: i) RNA transport by modulating EIF4A1 and 2, EIF4B, NUP58 and 160, TGS1 genes; ii) protein processing in endoplasmic reticulum, closely linked with N-Glycan biosynthesis, by modulating MAN1C1, DNAJA1, and SEC24D; and iii) oxidative phosphorylation, connected with phagosome and synaptic vesicle cycle, by modulating ATP6V1G1, NDUFAB1, and SDHD. miR-432 was implicated in: i) GABAergic synapse pathway, including cAMP signaling, via targeting GABRB1 and GABBR1 genes; ii) lysine degradation, via targeting WHSC1L1 and KMT2C genes; and iii) endocytosis, via targeting EPN3, PIP5K1B, TSG101, SMURF. miR-451a, and their putative target genes CAB39 and tuberous sclerosis 1 (TSC1), were implicated in mTOR signaling pathways, closely linked with AMPK and P13K-Akt signaling pathways; the same miRNA, along with miR-376a, was also associated with proteasome via targeting PSMA1 and 6, and PSMB8 genes.
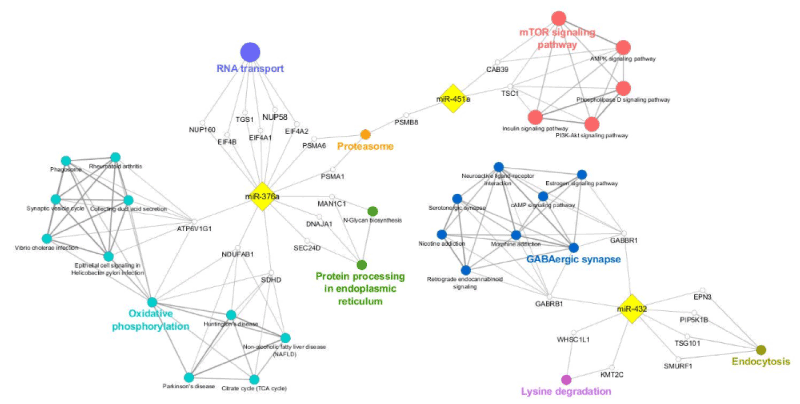
Figure 6. Functional annotation network representation of validated miRNA (miR-376a, miR-432, miR-451a) and their predicted gene targets. Gene targets, implicated in mTOR signaling pathways (red ovals), proteasome (orange oval), gabaergic synapse (blue ovals), lysine degradation (pink ovals), protein processing in endoplasmatic reticulum (green ovals), and oxidative phosphorylation (light blue ovals) were selected on the basis of their in silico prediction (gray dotted arrows). MiRNAs (miR-451a, miR-432 and miR-376a, yellow square) and predicted gene targets (ATP6V1G1, CAB39, DNAJA1, EIF4A1, EIF4A2, EIF4B, EPN3, MAN1C1, NDUFAB1, NUP58, NUP160, PIP5K1B, PSMA1, PSMA6, PSMNB8, SDHD, SMURF1, SEC24D, TGS101, TSC101, WHSC1L1, KMT2C, white circles) are shown in the network, constructed using Cytoscape software through the ClueGO plug-in.
Expression analysis of mRNA targets of miR-376a, miR-432 and miR-451a
Transcriptional levels of selected putative target genes of miR-376a, miR-432 and miR-451a were analyzed in fibroblasts, iPSCs and neuronal cells from the IAHSP patient, the ALS, SMA, SMEI, and GEFS+ patients, and the healthy controls. Specifically, in iPSCs and fibroblasts we analyzed CAB39, TSC1 and PSMB8, as targets of miR-451a (Figure 7A and B); in neuronal cells, DNAJA1, EIF4B and NDUFAB1 were tested as targets of miR-376a, and SMURF, TSG101 and KMT2C as targets of miR-432 (Figure 7C).
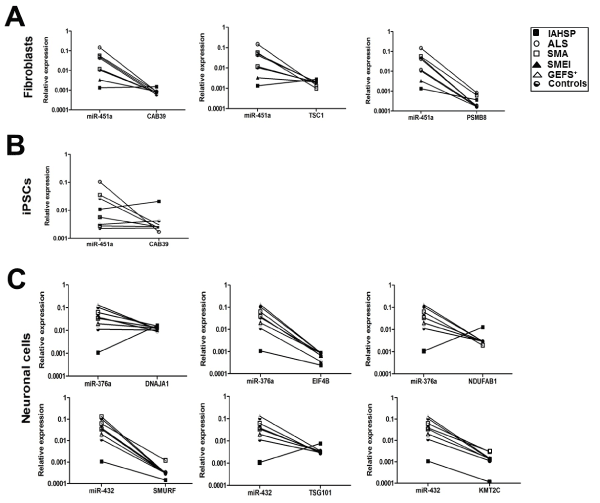
Figure 7. Transcriptional levels of the selected gene targets of miR-376a, miR-432 and miR-451a were analyzed in fibroblasts, iPSCs and neuronal cells from the IAHSP patient (black square), ALS (white circle), SMA(white square), SMEI (black triangle), and GEFS+ (white triangle) patients, and the healthy controls (black and white circle). The relationship between the expression of each miRNA and its mRNA targets was evaluated by obtaining “before-after graphs” showing the miRNA/mRNA correlation trend in the IAHSP patient cells compared to cells from all the other patients and healthy controls. Expression levels of target genes were expressed normalizing against 18s endogenous control and calculated using the ΔCt method, in IAHSP, ALS, SMA, SMEI, and GEFS+ patients and control fibroblasts, iPSCs and neuronal cells. (A) miR-451a and relationship with the expression of its targets CAB39, TSC1 and PSMB8 in fibroblasts. (B) miR-451a and relationship with the expression of its target CAB39 in iPSCs. (C) Upper panel, miR-376a and relationship with the expression of its targets DNAJA1, EIF4B, NDUFAB1 in neuronal. Lower panel, miR-432 and relationship with the expression of its targets SMURF, TSG101, KMT2C in neuronal cells.
miR-451a expression showed a negative relationship with the expression of its targets CAB39 and TSC1 in fibroblasts and iPSCs (only TSC1) of ALS, SMA, SMEI, and GEFS+ patients and controls, but not in the corresponding cells of the IAHSP patient, where CAB39 and TSC1 levels were higher than those of the miRNA, indicative of a positive correlation trend. In all fibroblast samples, PSMB8 mRNA levels were lower than those of miR-451a, with IAHSP fibroblasts having the lower values of miR-451a expression levels (Figure 7A and B).
miR-376a expression displayed a positive relationship with the expression of its targets DNAJA1 and NUDFAB1 in neuronal cells of the IAHSP patient, but not in the corresponding cells of ALS, SMA, SMEI, and GEFS+ patients and controls (Figure 7C). In the same cells from all patients and controls, a negative correlation trend was observed between EIF4B mRNA levels and those of miR-376a. However, neurons of the IAHSP patient had the lower expression levels of both miR-376a and EIF4B. A positive correlation trend between miR-432 and TSG101expression levels was showed in neuronal cells of the IAHSP patient, but not in cells from the other patients and controls. A trend indicative of negative correlation was found between miR-432 levels and those of SMURF and KMT2C in all samples, with neurons of the IAHSP patient showing the lower expression levels of the miRNA and its targets (Figure 7C).
All these data suggested that dysregulated expression of miR-376a, miR-432 and miR-451a in IAHSP cells may be responsible for an altered expression pattern of key genes involved in stem cell biology process and neuronal differentiation, particularly TSC1, TSG101, DNAJA1 and NDUFAB1, whose balance could be critical for the IAHSP-specific neurodegenerative process.
Discussion
MNDs, including IAHSP, are complex neurodegenerative disorders in terms of genetic background and clinical presentations. Several mutations in ALS2 locus have been described in IAHSP patients, but no genetic alterations were found in a relevant subset of patients in whom mechanisms underlying motor neuron deficiency remain to be clarified. Notably, even if no mutations in ALS2 gene were tracked in the IAHSP patient under study in this manuscript, the gene transcript expression levels in IAHSP-derived neuronal cells was down regulated compared to all the other disease and healthy controls (Supplemental Figure 6). This here suggests that an altered transcriptional regulation might occur, underlying the complexity of combinatorial gene control mechanisms in IAHSP, and other ALS2 gene-related diseases.
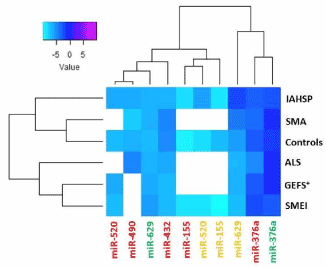
Supplemental Figure 5. Heat map representation of the expression levels of not validated miRNAs in healthy control, pathological control, and IAHSP fibroblasts, iPSCs, and neuronal cells
Heat map of not validated miRNAs having comparable expression levels in fibroblasts (green), iPSCs (red), and neuronal cells (orange) obtained from four healthy subjects, two patients with motor neuron diseases (MNDs), one with ALS and one with SMA, and two patients affected by neurological diseases other than MNDs, one with generalized epilepsy with febrile seizures plus condition (GEFS+), and one with severe myoclonic epilepsy at infancy (SMEI). miRNAs levels were reported as log 2-transformed relative expression and normalized against U6 endogenous control. Rainbow scale color is representative of expression level values from negative (light cyan) to positive (magenta). White boxes indicate undetected miRNAs
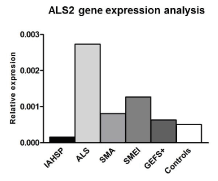
Supplemental Figure 6. ALS2 gene expression levels in IAHSP neuronal cells. Transcriptional expression analysis of ALS2 gene in neuronal cells derived from iPSCs of the IAHSP patient (black histogram), ALS (light gray histogram), SMA (gray histogram), SMEI (dark gray histogram), GEFS+ (darker gray histogram) and controls (white histogram) expression levels was expressed as relative values (2-ΔCt) normalized with endogenous control 18s in triplicate. ALS2 gene expression levels were lower than to healthy controls, ALS, SMA, SMEI and GEFS+ cells. This suggest that an altered transcriptional regulation might occur for ALS2 gene, underlying the complexity of combinatorial gene control mechanisms in IAHSP, and other ALS2 gene-related diseases
Reprogramming fibroblasts from MND patients into iPSCs, and differentiating them into neurons, could provide a patient-specific cellular model for studying diseases’ molecular mechanisms [18]. As far as we know iPSCs from IAHSP patients have never been generated and studied to investigate pathogenic mechanisms or possible therapeutic interventions, therefore it is still unknown whether there are key molecules associated with IAHSP iPSC identity or involved in neuronal differentiation and pathogenic processes in the disease. Due to their well-known involvement in stem cell function and neurodegeneration [22,55,56], miRNAs represent one of the most plausible molecular candidates suspected to play a role in the pathogenic events underlying MNDs. However, their role in IAHSP remains unexplored.
Here, we performed a miRNome profiling, including 381 human miRNAs, in fibroblasts, iPSCs and iPSC-derived neuronal cells from an ALS2 mutation-negative IAHSP patient and a healthy control, to disclose miRNAs differentially expressed in IAHSP cells and potentially implicated in the disease. Validation of selected miRNAs in cell cultures from additional healthy controls, patients affected by different MNDs (ALS and SMA), and neurological disorders other than MNDs (SMEI and GEFS+), revealed a miRNA pattern specifically associated with neuronal differentiation and potentially implicated in IAHSP.
Our molecular analysis of the developmental axis "fibroblast-iPSC-neuronal cell" strongly demonstrated the relevance of characterizing patient-derived cell types to identify the molecular underpinning of IAHSP and other MNDs.
iPSCs generated from IAHSP patient showed reduced size, accompanied by decreased ability to proliferate compared to control iPSCs, suggesting disease-related differences in intrinsic survival properties of patient-derived cells. However, such differences were not reflected in a different efficiency in reprogramming of fibroblasts; indeed, fibroblast morphology, and iPSC-derived colonies’ number were similar in the two examined groups.
The analysis of miRNome in IAHSP and control fibroblasts, and the further validation of selected miRNAs in fibroblast cultures of additional disease-controls – ALS, SMA, SMEI and GEFS+ patients – led to identify a reduced expression of miR-451a in IAHSP fibroblasts compared to all the other samples. Contrariwise, this miRNA was incremented in the IAHSP fibroblast-derived iPSCs compared to control cells and cells from SMEI and GEFS+ patients, but not in comparison with cells from ALS and SMA patients. By exploring in-silico miR-451 function through miRNA-mRNA target network construction, we found that this miRNA putatively regulates mTOR, AMPK and PI3K-Akt signaling pathways, which are relevant for cell cycle regulation [27], via targeting TSC1 gene. Accordingly, our mRNA expression analyses showed a positive trend correlation between miR-451a and TSC1 gene level in iPSCs. The regulation of this pathway by miR-451a is corroborated by studies in the field of cancer which demonstrated that, by activating mTOR/AMPK/PI3K-Akt signaling, via direct targeting of TSC1, miR-451a enhances stemness features [57]. Based on these literature data, and the observed mRNA target trend, miR-451a up-regulation in IAHPS iPSCs, compared to the fibroblast stage, could be related to its ability to promote self-renewal capacity and expression of pluripotent cell markers, actually proper of iPSC stage of differentiation. Our gene expression analysis also demonstrated an inverse relationship between miR-451a and AKT1 mRNA levels, suggesting that altered cell size, and decreased proliferative activity, we observed in IAHSP iPSCs compared to controls, might be linked to a miR-451a-dependent decreased expression of AKT1, which is known to promote proliferation, and increase cell survival [54]. Moreover, our miRNA-mRNA study for miR-451 identified proteasome subunit beta 8 (PSMB8) gene as another potential target. PSMB8 has a major role in the removal of misfolded and damaged proteins, controlling cell integrity and cell viability [58]. Interestingly, in IAHSP, as well as in ALS and SMA cells, miR-451a expression levels were higher compared to control samples and other neurological disease samples, suggesting an altered regulation in protein quality control, which is actually known to play a crucial role in MNDs [59].
miRNA analysis in iPSC-derived neurons showed that miR-376a and miR-432 were reduced in IAHSP neuronal cells compared to all the other cells. Considerable data suggest that RNA processing and intracellular transport are altered in MNDs associated with mutations in TDP-43, a protein required for miRNA biogenesis [60,61]. Interestingly, the putative relationship between miR-376a and genes implicated in RNA transport pathways (i.e. EIF4A1 and 2, EIF4B, NUP58 and 160, TGS1), suggests a contribution of this miRNA in altering RNA metabolism, not only in TDP-43-associated MNDs, but also in other MNDs as IAHSP. Furthermore, by predicted functional network, we found that oxidative phosphorylation pathways are additional potential targets of miR-376a. In accordance, NDUFAB1 gene, which codes for a subunit of Complex I of the mitochondrial respiratory chain, showed a positive trend correlation with miR-376a. This observation is of particular interest, due to the well-known role of oxidative stress, and mitochondrial function, in MNDs pathogenesis, including ALS, particularly considering that anti-oxidants are potential therapeutic agents for the disease [62,63].
Substantial studies suggested that a better knowledge of protein processing in endoplasmic reticulum pathways should be valuable in understanding the pathogenesis and eventually in designing therapy for neurodegenerative diseases [64,65]. Our prediction analysis showed a putative relationship between miR-376a and genes implicated in endoplasmic reticulum-associated pathways (i.e. MAN1C1, DNAJA1, and SEC24D). This was supported by a miRNA/mRNA positive relationship with DNAJA1 gene in IAHSP neuronal cells, suggestive of a possible implication also for miR-376a in misfolded and damaged protein repair mechanisms in MNDs. Of note, Jovicic, et al. demonstrated that miR-376a was enriched in functional neurons and induced stem cell differentiation towards neuronal phenotype in rat primary cultures [66]. Relying on these data, and on the iPSC-derived neuronal cell characterization, we hypothesized that the reduction of miR-376a expression levels may be responsible for the altered neuron phenotype characterized by impaired neurite outgrowth. Regarding this aspect, further investigations are needed to understand whether this defect is related to RNA metabolism alterations or to an altered axonal transport not mediated by alsin.
Regarding miR-432, our network analysis showed that GABAergic synapse, lysine degradation, and endocytosis pathways, are putative miR-432-regulated mechanisms. Interestingly, a contribution of miRNAs in modulating the interaction between endosomal toxicity and synaptic vesicle recycling pathways has been described [67,68]. Here, we suggested that miR-432 might be critically involved in these pathways, which are widely implicated in MND, as ALS, onset and progression [68,69]. In addition, it has been shown that miR-432 induces neurite outgrowth, inhibition of proliferation, and cell cycle arrest in human neuroblastoma cells by targeting nestin, corepressor 1 and methyl cpg binding protein 2 [49]. These results suggest an involvement of miR-432 in neuritogenesis processes, and indicate that defective expression of this miRNA, perhaps together with miR-376, might negatively influence neuronal cell differentiation by impairing neurite growth. Finally, the reduced expression of miR-432 we found in IAHSP neuronal cells, in accordance with its positive relationship with TSG101 gene, which acts as a negative growth regulator, might be responsible for the observed different number of neurons in the IAHSP cultures compared to controls.
Conclusions
Our overall data identified miR-451a, miR-376a, and miR-432 as closely implicated in the differentiation program from fibroblasts to iPSC-derived neurons, and as molecules whose altered expression might significantly affect signaling pathways relevant in MND-related processes. Of interest, hierarchical clustering analysis of miRNA expression levels in the axis “fibroblast-iPSC-neuron” revealed two clusters of miRNAs: the first, including miR-451a, was distinctive of fibroblasts and iPSCS, indicating a contribution of miR-451 to stem cell biology processes; the second, which included miR-376a and miR-432, was associated with the neuronal cell phenotype, highlighting a role for these miRNAs in modulating neuronal differentiation programs. Our findings on dysregulation of miR-451a, miR-376a, and miR-431 expression pattern in the iPSC-based in vitro model of IAHSP provide new insights into the IAHSP pathogenesis, pointing out the possibility that altered neuronal differentiation processes, depending on these miRNAs, could eventually lead to an altered availability of motor neurons in the IAHSP disease. Further studies in genetically defined, or not defined, IAHSP patients, and in other MNDs, could help to deeply understand the synergistic effect of miR-376a, miR-432 and miR-451a in disease onset and/or progression, towards future development of patient-specific miRNA-based therapeutic strategies for IAHSP and other MNDs.
Acknowledgements
We are grateful to Dr. E. Ciusani (Laboratory of Clinical Pathology and Medical Genetics, Fondazione Istituto Neurologico “Carlo Besta”, Milan, Italy) for the kind gift of annexin V-FITC apoptosis detection kit and helpful suggestions on flow cytometry analyses.
Funding
This work was supported by grants to RM from the Annual Research Funding of the Italian Ministry of Health (RC2013/LR3, RC2014/LR3, RC2015/LR1, RC2016/LR1, RC2017/LR1), and Regione Lombardia (8598/Ricerca Indipendente 2009); Fondazione Regionale per la Ricerca Biomedica (FRRB; TRANS_ALS, Grant No. 2015-0023); grant to SB from Fondazione Cariplo, FRRB reserved to physician scientists (A STEP for ALS, CARIPLO 2017 – Rif. 2017-1886).
Conflicts of interest
The authors declare that they have no conflicts of interest.
View supplementary data References
- Turner MR, Talbot K (2013) Mimics and chameleons in motor neurone disease. Pract Neurol 13: 153-164. [crossref]
- Sathasivam S (2010) Motor neurone disease: clinical features, diagnosis, dignostic pitfalls and prognostic markers. Singapore Med J 51: 367-372. [crossref]
- Al-Chalabi A, Visscher PM (2014) Motor neuron disease: common genetic variants and the heritability of ALS. Nat Rev Neurol 10: 549-550. [crossref]
- Therrien M, Dion PA, Rouleau GA (2016) ALS: Recent Developments from Genetics Studies. Curr Neurol Neurosci Rep 16: 59. [crossref]
- Lesca G, Eymard-Pierre E, Santorelli FM, Cusmai R, Di Capua M, et al. (2003) Infantile ascending hereditary spastic paralysis (IAHSP): clinical features in 11 families. Neurology 60: 674-682. [crossref]
- Racis L, Tessa A, Pugliatti M, Storti E, Agnetti V, et al. (2014) Infantile-onset ascending hereditary spastic paralysis: a case report and brief literature review. Eur J Paediatr Neurol 18: 235-239. [crossref]
- Eymard-Pierre E, Lesca G, Dollet S, Santorelli FM, Di Capua M, et al. (2002) Infantile-onset ascending hereditary spastic paralysis is associated with mutations in the alsin gene. Am J Hum Genet 71: 518-527. [crossref]
- Takahashi KK, Tanabe M, Ohnuki M, Narita T, Ichisaka K, et al. (2007) Induction of pluripotent stem cells from adult human fibroblasts by defined factors. Cell 131: 861-872. [crossref]
- Hargus G, Ehrlich M, Hallmann AL, Kuhlmann T (2014) Human stem cell models of neurodegeneration: a novel approach to study mechanisms of disease development. Acta Neuropathol 127: 151-173. [crossref]
- Myszczynska M, Ferraiuolo L (2016) New in vitro models to study amyotrophic lateral sclerosis. Brain Pathol 26: 258-265. [crossref]
- Dimos JT, Rodolfa KT, Niakan KK, Weisenthal LM, Mitsumoto H, et al. (2008) Induced pluripotent stem cells generated from patients with ALS can be differentiated into motor neurons. Science 32: 1218-1221. [crossref]
- Ebert AD, Yu J, Rose FF, Mattis VB, Lorson CL, et al. (2009) Induced pluripotent stem cells from a spinal muscular atrophy patient. Nature 457: 277-280. [crossref]
- Soldner F, Hockemeyer D, Beard C, Gao Q, Bell GW, et al. (2009) Parkinson’s disease patient-derived induced pluripotent stem cells free of viral reprogramming factors. Cell 136: 964-977. [crossref]
- Zhang N, An MC, Montoro D, Ellerby LM (2010) Characterization of human huntington's disease cell model from induced pluripotent stem cells. PLoS Curr 2: RRN1193. [crossref]
- Marchetto MC, Winner B, Gage FH (2010) Pluripotent stem cells in neurodegenerative and neurodevelopmental diseases. Hum Mol Genet 19: R71-76. [crossref]
- Lunn JS, Sakowski SA, Federici T, Glass JD, Boulis NM, et al. (2011) Stem cell technology for the study and treatment of motor neuron diseases. Regen Med 6: 201-213. [crossref]
- Grskovic M, Javaherian A, Strulovici B, Daley GQ (2011) Induced pluripotent stem cells--opportunities for disease modelling and drug discovery. Nat Rev Drug Discov 10: 915-929. [crossref]
- Burkhardt MF, Martinez FJ, Wright S, Ramos C, Volfson D, et al. (2013) A cellular model for sporadic ALS using patient-derived induced pluripotent stem cells. Mol Cell Neurosci 56: 355-364. [crossref]
- Yang YM, Gupta SK, Kim KJ, Powers BE, Cerqueira A, et al. (2013) A small molecule screen in stem-cell-derived motor neurons identifies a kinase inhibitor as a candidate therapeutic for ALS. Cell Stem Cell 12: 713-726. [crossref]
- Cocks G, Curran S, Gami P, Uwanogho D, Jeffries AR, et al. (2014) The utility of patient specific induced pluripotent stem cells for the modelling of autistic spectrum disorders. Psychopharmacology 23: 1079-1088. [crossref]
- Hossini AM, Megges M, Prigione A (2015) Induced pluripotent stem cell-derived neuronal cells from a sporadic Alzheimer's disease donor as a model for investigating AD-associated gene regulatory networks. BMC Genomics 16: 84. [crossref]
- Liu SP, Fu RH, Yu HH, Li KW, Tsai CH, et al. (2009) MicroRNAs regulation modulated self-renewal and lineage differentiation of stem cells. Cell Transplant 18: 1039-1045. [crossref]
- Xu B, Chen X, Mao Z, Chen M, Han X, et al. (2013) Perfluorooctane sulfonate disturbs Nanog expression through miR-490-3p in mouse embryonic stem cells. PLoS One 8: e74968. [crossref]
- Davis-Dusenbery BN, Hata A (2010) Mechanisms of control of microRNA biogenesis. J Biochem 148: 381-392. [crossref]
- Li Z, Yang CS, Nakashima K, Rana TM (2011) Small RNA-mediated regulation of iPS cell generation. EMBO J 30: 823-834. [crossref]
- Lukovic D, Moreno-Manzano V, Klabusay M, Stojkovic M, Bhattacharya SS, et al. (2014) Non-coding RNAs in pluripotency and neural differentiation of human pluripotent stem cells. Front Genet 5: 132. [crossref]
- Marcuzzo S, Kapetis D, Mantegazza R, Baggi F, Bonanno S, et al. (2014) Altered miRNA expression is associated with neuronal fate in G93A-SOD1 ependymal stem progenitor cells. Exp Neurol 253: 91-101. [crossref]
- Aboobaker AA, Tomancak P, Patel N, Rubin GM, Lai EC (2005) Drosophila microRNAs exhibit diverse spatial expression patterns during embryonic development. Proc Natl Acad Sci USA 102: 18017-18022. [crossref]
- Monticelli S, Ansel KM, Xiao C, Socci ND, Krichevsky AM, et al. (2005) MicroRNA profiling of the murine hematopoietic system. Genome Biol 6: R71. [crossref]
- Laurent LC, Chen J, Ulitsky I, Mueller FJ, Lu C, et al. (2008) Comprehensive microRNA profiling reveals a unique human embryonic stem cell signature dominated by a single seed sequence. Stem Cells 26: 1506-1516. [crossref]
- Goodall EF, Heath PR, Bandmann O, Kirby J, Shaw PJ (2013) Neuronal dark matter: the emerging role of microRNAs in neurodegeneration. Front Cell Neurosci 7: 178. [crossref]
- Maciotta S, Meregalli M, Torrente Y (2013) The involvement of microRNAs in neurodegenerative diseases. Front Cell Neurosci 7: 265. [crossref]
- Basak I, Patil KS, Alves G, Larsen JP, Møller SG (2015) microRNAs as neuroregulators, biomarkers and therapeutic agents in neurodegenerative diseases. Cell Mol Life Sci 4: 811-827. [crossref]
- Qiu L, Tan EK, Zeng L (2015) microRNAs and Neurodegenerative Diseases. Adv Exp Med Biol 888: 85-105. [crossref]
- Kye MJ, Gonçalves Ido C (2014) The role of miRNA in motor neuron disease. Front Cell Neurosci 8: 15. [crossref]
- Ganesalingam J, Bowser R (2010) The application of biomarkers in clinical trials for motor neuron disease. Biomark Med 2: 281-297. [crossref]
- Rittié L, Fisher GJ (2005) Isolation and culture of skin fibroblasts. Methods Mol Med 117: 83-98. [crossref]
- Verpelli C, Carlessi L, Bechi G, Fusar Poli E, Orellana D, et al. (2013) Comparative neuronal differentiation of self-renewing neural progenitor cell lines obtained from human induced pluripotent stem cells. Front Cell Neurosci 7: 175. [crossref]
- Erceg S, Ronaghi M, Oria M, Roselló MG, Aragó, et al. (2010) Transplanted oligodendrocytes and motoneuron progenitors generated from human embryonic stem cells promote locomotor recovery after spinal cord transection. Stem Cells 28: 1541-1549. [crossref]
- Yu J, Chau KF, Vodyanik MA, Jiang J, Jiang Y (2011) Efficient feeder-free episomal reprogramming with small molecules. PLoS One 6: e17557. [crossref]
- Dong J, Jiang G, Asmann YW, Tomaszek S, Jen J, et al. (2010) MicroRNA networks in mouse lung organogenesis. PLoS One 5: e10854. [crossref]
- Jiang Y, Zhang M, He H, Chen J, Zeng H, et al. (2013) MicroRNA/mRNA profiling and regulatory network of intracranial aneurysm. BMC Med Genom 6: 36. [crossref]
- Wichterle H, Lieberam I, Porter JA, Jessell TM (2002) Directed differentiation of embryonic stem cells into motor neurons. Cell 110: 385-397. [crossref]
- Morin RD, O’Connor MD, Griffith M, Kuchenbauer F, Delaney A, et al. (2008) Application of massively parallel sequencing to microRNA profiling and discovery in human embryonic stem cells. Genome Res 18: 610-621. [crossref]
- Godlewski J, Nowicki MO, Bronisz A, Nuovo G, Palatini J, et al. (2010) MicroRNA-451 regulates LKB1/AMPK signaling and allows adaptation to metabolic stress in glioma cells. Mol Cell 37: 620-632. [crossref]
- Bitarte N, Bandres E, Boni V, Zarate R, Rodriguez J, et al. (2011) MicroRNA-451 is involved in the self-renewal, tumorigenicity, and chemoresistance of colorectal cancer stem cells. Stem Cells 29: 1661-1671. [crossref]
- Yan D, Xing Y, Ouyang X, Zhu J, Chen ZY, et al. (2012) Analysis of miR-376 RNA cluster members in the mouse inner ear. Int J Exp Pathol 93: 450-457. [crossref]
- Xu J, Chen Q, Zen K, Zhang C, Zhang Q (2013) Synaptosomes secrete and uptake functionally active microRNAs via exocytosis and endocytosis pathways. J Neurochem 1: 15-25. [crossref]
- Das E, Bhattacharyya NP (2014) MicroRNA-432 contributes to dopamine cocktail and retinoic acid induced differentiation of human neuroblastoma cells by targeting nestin and RCOR1 genes. FEBS Lett 588: 1706-1714. [crossref]
- Yao Y, Xue Y, Ma J, Shang C, Wang P, et al. (2014) MiR-330-mediated regulation of SH3GL2 expression enhances malignant behaviors of glioblastoma stem cells by activating ERK and PI3K/AKT signaling pathways. PLoS One 9: e95060. [crossref]
- Curtis AM, Fagundes CT, Yang G, Palsson-McDermott EM, Wochal P, et al. (2015) Circadian control of innate immunity in macrophages by miR-155 targeting Bmal1. Proc Natl Acad Sci U S A 112: 7231-7236. [crossref]
- Paraskevopoulou MD, Georgakilas G, Kostoulas N, Vlachos IS, Vergoulis T, et al. (2013) DIANA-microT web server v5.0: service integration into miRNA functional analysis workflows. Nucleic Acids Res 41: W169-173. [crossref]
- Bindea G, Mlecnik B, Hackl H, Charoentong P, Tosolini M, et al. (2009) ClueGO: a Cytoscape plug-in to decipher functionally grouped gene ontology and pathway annotation networks. Bioinformatics 25: 1091-1093. [crossref]
- Nicholson KM, Anderson NG (2002) The protein kinase B/Akt signalling pathway in human malignancy. Cell Signal 14: 381-395. [crossref]
- Marcuzzo S, Bonanno S, Kapetis D, Barzago C, Cavalcante P, et al. (2015) Up-regulation of neural and cell cycle-related microRNAs in brain of amyotrophic lateral sclerosis mice at late disease stage. Mol Brain 8: 5. [crossref]
- Rinchetti P, Rizzuti M, Faravelli I, Corti S (2018) MicroRNA Metabolism and dysregulation in amyotrophic lateral sclerosis. Mol Neurobiol 55: 2617-2630. [crossref]
- Du J, Liu S, He J, Liu X, Qu Y, et al. (2015) MicroRNA-451 regulates stemness of side population cells via PI3K/Akt/mTOR signaling pathway in multiple myeloma. Oncotarget 6: 14993-15007. [crossref]
- Ciechanover A, Kwon YT (2015) Degradation of misfolded proteins in neurodegenerative diseases: therapeutic targets and strategies. Exp Mol Med 47: e147. [crossref]
- Carra S, Crippa V, Rusmini P, Boncoraglio A, Minoia M, et al. (2012) Alteration of protein folding and degradation in motor neuron diseases: Implications and protective functions of small heat shock proteins. Prog Neurobiol 97: 83-100. [crossref]
- Štalekar M, Yin X, Rebolj K, Darovic S, Troakes C, et al. (2015) Proteomic analyses reveal that loss of TDP-43 affects RNA processing and intracellular transport. Neuroscience 293: 157-170. [crossref]
- Eitan C, Hornstein E (2016) Vulnerability of microRNA biogenesis in FTD-ALS. Brain Res 1647: 105-11. [crossref]
- Shaw PJ (2005) Molecular and cellular pathways of neurodegeneration in motor neurone disease. J Neurol Neurosurg Psychiatry 76: 1046-1057. [crossref]
- Barber SC, Mead RJ, Shaw PJ (2006) Oxidative stress in ALS: a mechanism of neurodegeneration and a therapeutic target. Biochim Biophys Acta 1762: 1051-1067. [crossref]
- Lautenschlaeger J, Prell T, Grosskreutz J (2012) Endoplasmic reticulum stress and the ER mitochondrial calcium cycle in amyotrophic lateral sclerosis. Amyotroph Lateral Scler 13: 166-177. [crossref]
- Rao RV, Bredesen DE (2004) Misfolded proteins, endoplasmic reticulum stress and neurodegeneration. Curr Opin Cell Biol 16: 653-662. [crossref]
- Jovicic A, Roshan R, Moisoi N, Pradervand S, Moser R, et al. (2013) Comprehensive expression analyses of neural cell-type-specific miRNAs identify new determinants of the specification and maintenance of neuronal phenotypes. J Neurosci 12: 5127-5137. [crossref]
- Morel L, Regan M, Higashimori H, Ng SK, Esau C, et al. (2013) Neuronal exosomal miRNA-dependent translational regulation of astroglial glutamate transporter GLT1. J Biol Chem 288: 7105-7116. [crossref]
- Sim SE, Bakes J, Kaang BK (2014) Neuronal activity-dependent regulation of MicroRNAs. Mol Cells 37: 511-517. [crossref]
- Xu N, Papagiannakopoulos T, Pan G, Thomson JA, Kosik KS (2009) MicroRNA-145 regulates OCT4, SOX2, and KLF4 and represses pluripotency in human embryonic stem cells. Cell 137: 647-658. [crossref]


