Abstract
Background: Sepsis syndrome is one of the major emergency department (ED) presentations, which if not recognized and managed in a timely manner carries high mortality. The ED at King Faisal Specialist Hospital & Research Centre (KFSF&RC) receives a large cohort of immunocompromised patients, which makes them highly vulnerable to sepsis. There are two validated criteria that can be used in predicting sepsis: quick Sequential Organ Failure Assessment (qSOFA) and National Early Warning Scoring System (NEWS2). In our ED, no specific criteria is used to alert ED physicians, hence diagnosis of sepsis is based on clinical judgement. We wanted to know, if the above two predictive criteria can be applied to all those patients treated as sepsis within ED. We also wanted to know the disposition of these patients.
Objectives
- How many patients diagnosed as sepsis by the ED physician could have been predicted by qSOFA & NEWS2.
- How many of these patients needed ICU admissions.
Methods: Retrospective review of medical records of all ED patients over a 6 month period (Dec 2020 till June 2021), who had a minimum of blood culture, urinary culture and chest X-ray requested from ED for a new emergency attendance. A data collection sheet was used to record patients’ demographics, temperature, heart rate (HR), respiratory rate (RR), blood pressure (BP), oxygen saturations (O2 sats), clinical symptoms, Canadian Triage & Acuity Scale (CTAS) category, Glasgow Coma Scale (GCS), blood culture, urine culture, COVID-19 PCR result (where applicable), lactate, C-reactive protein (CRP), pro-calcitonin, White Blood Cell (WBC) count, platelets count, creatinine level and Chest X-ray (CXR) status.
Results: A total of 3897 patients were eligible for our study. Age ranged from 17-101 years. 1476 (37.9%) were males. On the qSOFA scale, 3675 (94.3%) were assessed to be “not high risk” and 176 (4.5%) were assessed to be at “high risk" of sepsis. On the NEWS2 scale, 3287 (84.3%) were assessed to be at “low risk” of sepsis, 549 (14.1%) were assessed to be at “high risk” of sepsis. qSOFA’s sensitivity in detecting sepsis was 43.47%, while the specificity was 95.91%. NEWS2 sensitivity for detecting sepsis was 82.61%, while the specificity was observed to be 86.6%. 16 (0.4%) patients needed ICU admission and 99.5% were admitted to a standard bed.
Conclusion: NEWS2 is relatively a more sensitive tool than qSOFA for detecting sepsis within our ED. It could be due to inclusion of additional clinical parameters, which makes it more sensitive in identifying patients with sepsis. The tertiary care patients have complex clinical presentations, needing a wide-ranging set of parameters to suspect sepsis.
Keywords
sepsis, qSOFA, NEWS2, emergency department, sepsis prediction
Introduction
Sepsis syndrome encompasses a wide array of presentations, ranging from early sepsis to septic shock, which can lead to multiple organ dysfunction and death. It is a significant cause of mortality and morbidity in patients admitted to the ED. The number of worldwide sepsis incidents reported in 2017 was estimated to be 48.9 million, and there were 11 million sepsis-related deaths [1].
In total, 30% of patients admitted in the ICU worldwide in 2011 had sepsis. Such patients had a mortality rate between 11.9% and 39.5%, across different regions. More than $20.3 billion is spent annually on sepsis-related care in the United States in 2011 [2,3]. Systemic inflammatory response syndrome (SIRS) encompasses a group of physiological and immune-mediated reactions that are caused by an infectious or non-infectious insult [4]. SIRS is diagnosed when a patient is found to have two or more of the following four criteria: tachycardia (HR >90/m), tachypnea (>20/m), hyperthermia/hypothermia (> 38C or <36C), and/or leukocytosis/leukopenia (>12000/mm3 or < 4000mm3) [5]. When SIRS is confirmed to be caused by an infectious process, it is termed as sepsis [6].
Early detection and management of sepsis is crucial for preventing the progression of sepsis to septic shock and improving survival rates [7]. Unfortunately, early recognition of sepsis is complex due to its vague symptomatology and lack of standardized criteria for diagnosis and management.
Sepsis prediction criteria can allow timely interventions and help reduce associated morbidity and mortality. Numerous scoring systems have been deployed to aid early detection of sepsis. NEWS2 and qSOFA are the two main scoring systems that are widely used within the ED to predict sepsis and many studies have been published comparing the two criteria [8,9]. The NEWS2 tool includes RR, O2 saturation, systolic blood pressure (SBP), pulse rate, temperature and Glasgow coma scale (GCS). It classifies patients as low risk (0-4), medium risk (5-6) and high risk (7 or more) [Reference Table 1,2]. qSOFA criteria allocates one point each for SBP ≤100 mm Hg, RR of ≥ 22/minute and GCS score <15. It classifies patients as “Not high risk” (0-1) and “High risk” (2-3) [10] [Reference Table 3]. A study that assessed the validity of qSOFA found it to be a poor screening tool for identifying sepsis in the ED. It also found that the time needed to meet qSOFA criteria was significantly longer than for SIRS criteria [11].
Demographical charactaristics |
n |
% |
Age |
Minimum |
17 |
|
Maximum |
101 |
|
Mean |
45.7 |
|
Standard deviation |
17.68 |
|
Gender |
Male |
1476 |
37.9 |
Female |
2421 |
62.1 |
Table 1. Socio-Demographic profile of the patients (n = 3897)
Question |
n |
% |
Presenting Symptoms |
Fever |
2062 |
52.9 |
Shortness of breath |
1280 |
32.8 |
Vomiting |
781 |
20 |
Malaise |
754 |
19.3 |
Nausea |
753 |
19.3 |
Cough |
576 |
14.8 |
Diarrhea |
378 |
9.7 |
Altered mental status |
287 |
7.4 |
Abdominal pain |
282 |
7.2 |
Headache |
146 |
3.7 |
Flank pain |
11 |
0.3 |
Others |
1377 |
35.3 |
Mental status Level Based on Glasgow Coma Scale |
Normal (score of 15) |
3607 |
92.6 |
Mild altered mental status (score between 13 - 14) |
205 |
5.3 |
Moderate altered mental status (score between 9 - 12) |
74 |
1.9 |
Severe altered mental status (score between 3 - 8) |
8 |
0.2 |
Undocumented |
3 |
0.1 |
Table 2. Clinical presentation profile (n = 3897)
Item |
Mean |
Standard deviation |
Vitals sign |
Temperature (°C) |
37.86 |
0.92 |
Heart rate |
88.88 |
18.14 |
Respiratory rate |
20.55 |
2.96 |
Systolic blood pressure |
120.79 |
18.18 |
Diastolic blood pressure |
73.96 |
10.58 |
Oxygen saturation |
97.53 |
3.54 |
Table 3. Vitals profile (n = 3897)
Item |
Median |
Interquartile range |
Laboratory investigation
|
WBC count |
10.82 |
12.13 |
RBC count |
5.62 |
9.06 |
Platelets |
125 |
50 |
C-reactive protein |
11.3 |
12.85 |
Creatinine |
75 |
15 |
Lactate |
2 |
1.6 |
Procalcitonin |
1.8 |
1.89 |
Imaging |
n |
% |
Chest x-ray |
|
|
Done |
3864 |
99.2 |
Not done |
33 |
0.8 |
Evidence of Infection |
n |
% |
Blood culture |
Negative |
3870 |
99.3 |
Positive |
27 |
0.7 |
Urine culture |
Negative |
3880 |
99.6 |
Positive |
17 |
0.4 |
COVID-19 |
Negative |
3873 |
99.4 |
Positive |
17 |
0.4 |
Undocumented |
7 |
0.2 |
In contrast, a study comparing qSOFA, NEWS2, and SIRS concluded that both qSOFA and NEWS2 were superior to SIRS in diagnosing sepsis and predicting mortality [12]. The variability in the research regarding the accuracy and effectiveness of these scoring systems further denotes the importance of establishing a standardized way to identify sepsis.
In 2004, the surviving sepsis campaign (SSC) established its first guideline for managing sepsis to reduce mortality. Updated guidelines have later been published in 2023. Adherence to these guidelines has led to better patient outcomes and lower healthcare costs [13]. The SSC also released guidelines for managing sepsis caused by COVID-19 during the pandemic [14].
A retrospective study conducted in Australia assessed the impact of implementing evidence-based sepsis guidelines. The new guidelines led to a 230-minute decrease in the time to administer antibiotics. Overall, it enhanced the early assessment, recognition, and management of sepsis patients [3].
The lack of reliable tools to diagnose sepsis can harm patients by unnecessary administration of fluids and medications. A study was conducted to assess the number of patients initially diagnosed with sepsis on presentation to the ED and compared them to those still diagnosed with sepsis upon discharge. It was found that most patients meeting sepsis criteria in the ED were not diagnosed with sepsis at discharge [15].
A study assessed the clinical application of artificial intelligence (AI) in sepsis. Targeted Real Time Early Warning System (TRESS), a bedside tool was designed to create a sepsis alert for the clinician, by combining patients medical records with symptoms and laboratory results. It claimed a reduction in sepsis related mortality from 21.3% to 8.96%. These findings can provide significant aid to ED physicians in future [16].
It is evident that there is a need for more research to establish a standardized approach for properly detecting sepsis within the ED, as very few studies address such a pervasive topic. Furthermore, establishing a unified prediction tool for identifying sepsis patients will optimize treatment and minimize harm. We wanted to know the sensitivity and specificity of qSOFA and NEWS2 criteria treated as sepsis within our ED.
Materials and methods
Study design and setting
Retrospective review of the medical records of ED patients over a 6-month period (from Dec 2020 to June 2021) in the ED of KFSH&RC, Riyadh, Saudi Arabia.
Inclusion criteria
All patients with suspected sepsis within the ED (patients who had blood culture and/or urine culture and chest x-ray requested by the ED physician).
Exclusion criteria
Boarded patients in the ED (already admitted patients under a specialty, waiting an inpatient bed).
Data collection tool
The patients’ data was collected from the electronic medical records of KFSH&RC.
Statistical analysis
Data analysis was performed using “Statistical Package for the Social Sciences,” SPSS 23rd version. Frequency and percentages were used to display categorical variables. Mean and standard deviation were used to present numerical variables. Sensitivity and specificity were used for qSOFA and NEWS2 scales for sepsis risk assessment.
Ethical considerations
The study was approved by the Research advisory council (RAC: 2211111) of KFSH&RC. There was no funding or cost associated with this study.
Results
A total of 3897 patients were included in the study. The age range was 17-101years with a mean of 45.7 (SD 17.68). 2421(62.1%) patients were females (Table 1). Seven (0.2%) patients were triaged as CTAS 1 (immediate), 2082 (53.4%) CTAS 2 (emergent), 1755 (45%) CTAS 3 (urgent), 50 (1.3%) CTAS 4 (less urgent), 1 (0.03%) was triaged as CTAS 5 (non-urgent), while 2 (0.05%) did not have a documented triage level (Figure 1). The most common reported symptom was “fever", documented in 2062 (42.9%) patients, followed by “shortness of breath” in 1280 (32.8%), “vomiting” in 781 (20%), and “malaise” in 754 (19.3%). The least reported symptom was “flank pain” in 11 (0.3%) patients. 3607 (92.6%) patients had a normal GCS score, 205 (5.3%) ranged between 13-14, 74 (1.9%) between 9 – 12, eight (0.2%) between 3 – 8, while 3 (0.1%) did not have a documented GCS score (Table 2).
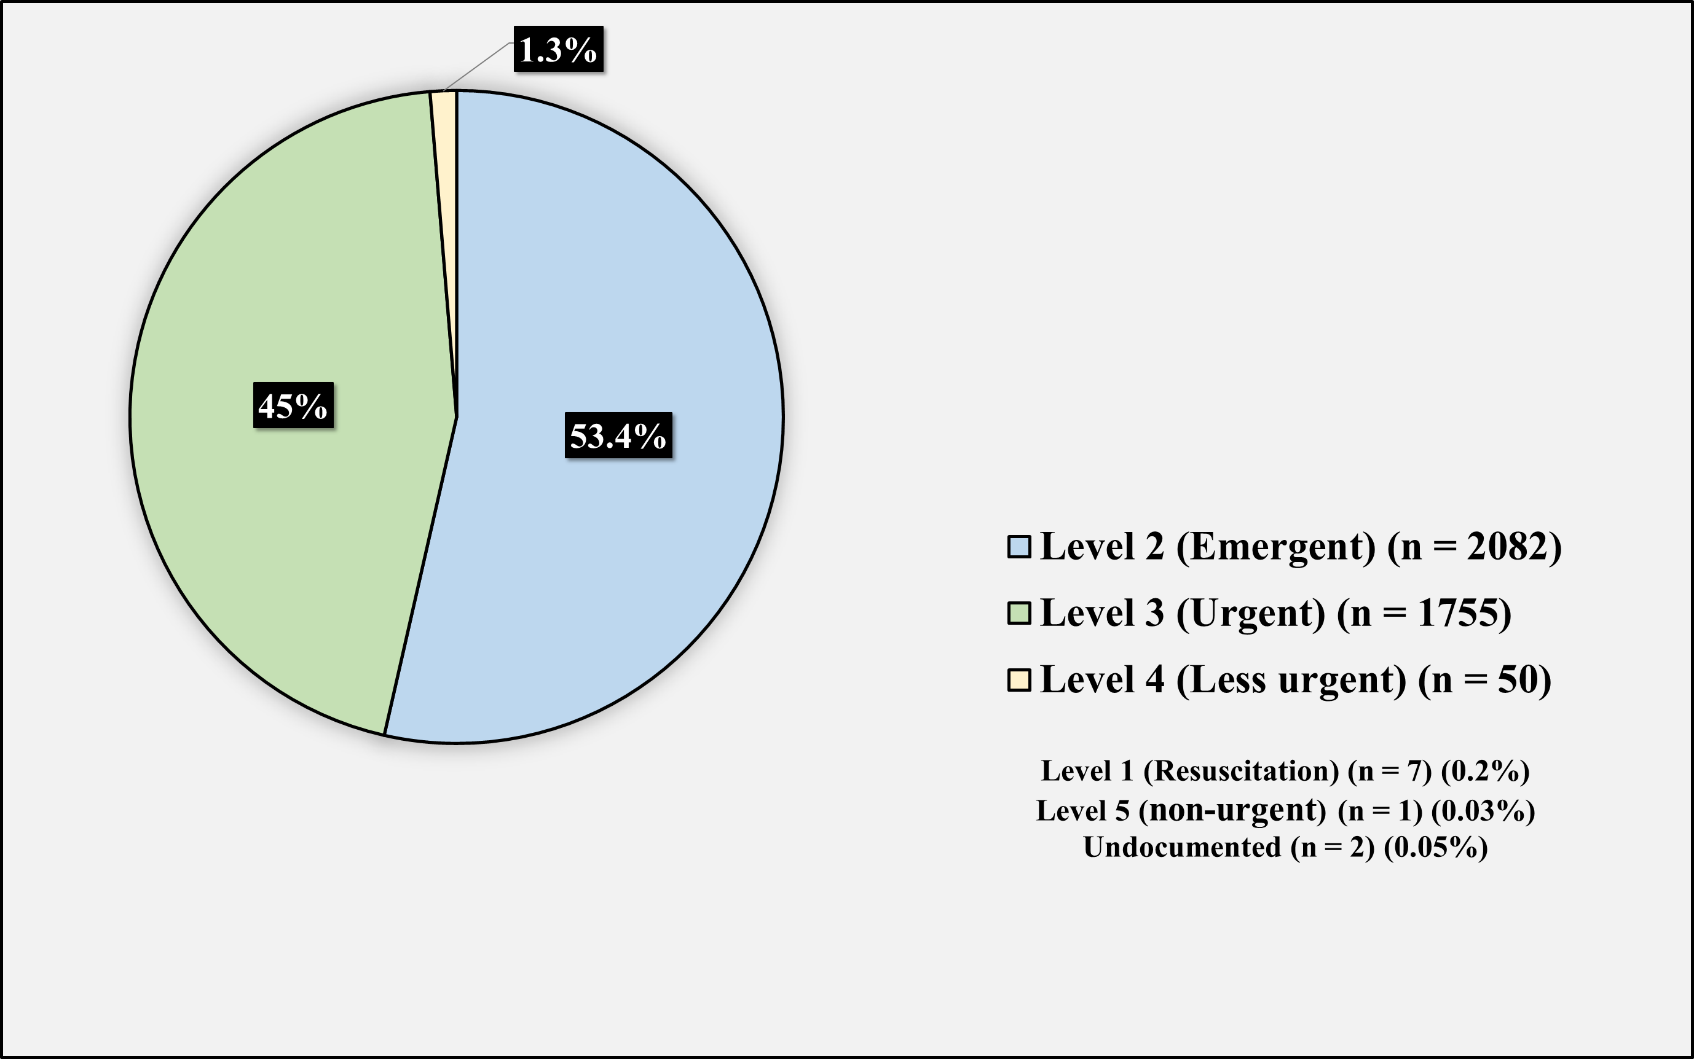
Figure 1. Patients’ triage levels
The mean temperature was 37.86 °C (SD.92), HR 88.88 (18.14), RR 20.55 (2.96), SBP 120.79 (18.18), diastolic (DBP) 73.96 (10.58), and O2 saturation 97.53 (3.54) (Table 3). The mean WBC count was 12.57 (10.06), RBC count 9.59 (9.41), platelets count 165.52 (121.35), CRP 23.99 (49.04), creatinine 78.76 (40.02), lactate 2.64 (2.15), and pro-calcitonin 3.2 (7.36). CXR was done for 3864 (99.2%) (Table 4). In accordance to qSOFA scale, 3675 (94.3%) were assessed to be “not high risk” of sepsis, 176 (4.5%) were assessed to be “high risk”, while 46 (1.2%) were not assessed due to missing data. According to NEWS2 scale, 3287 (84.3%) were assessed to be at low risk of sepsis, 549 (14.1%) were assessed to be at high risk, while 61 (1.6%) were not assessed (Figure 2).
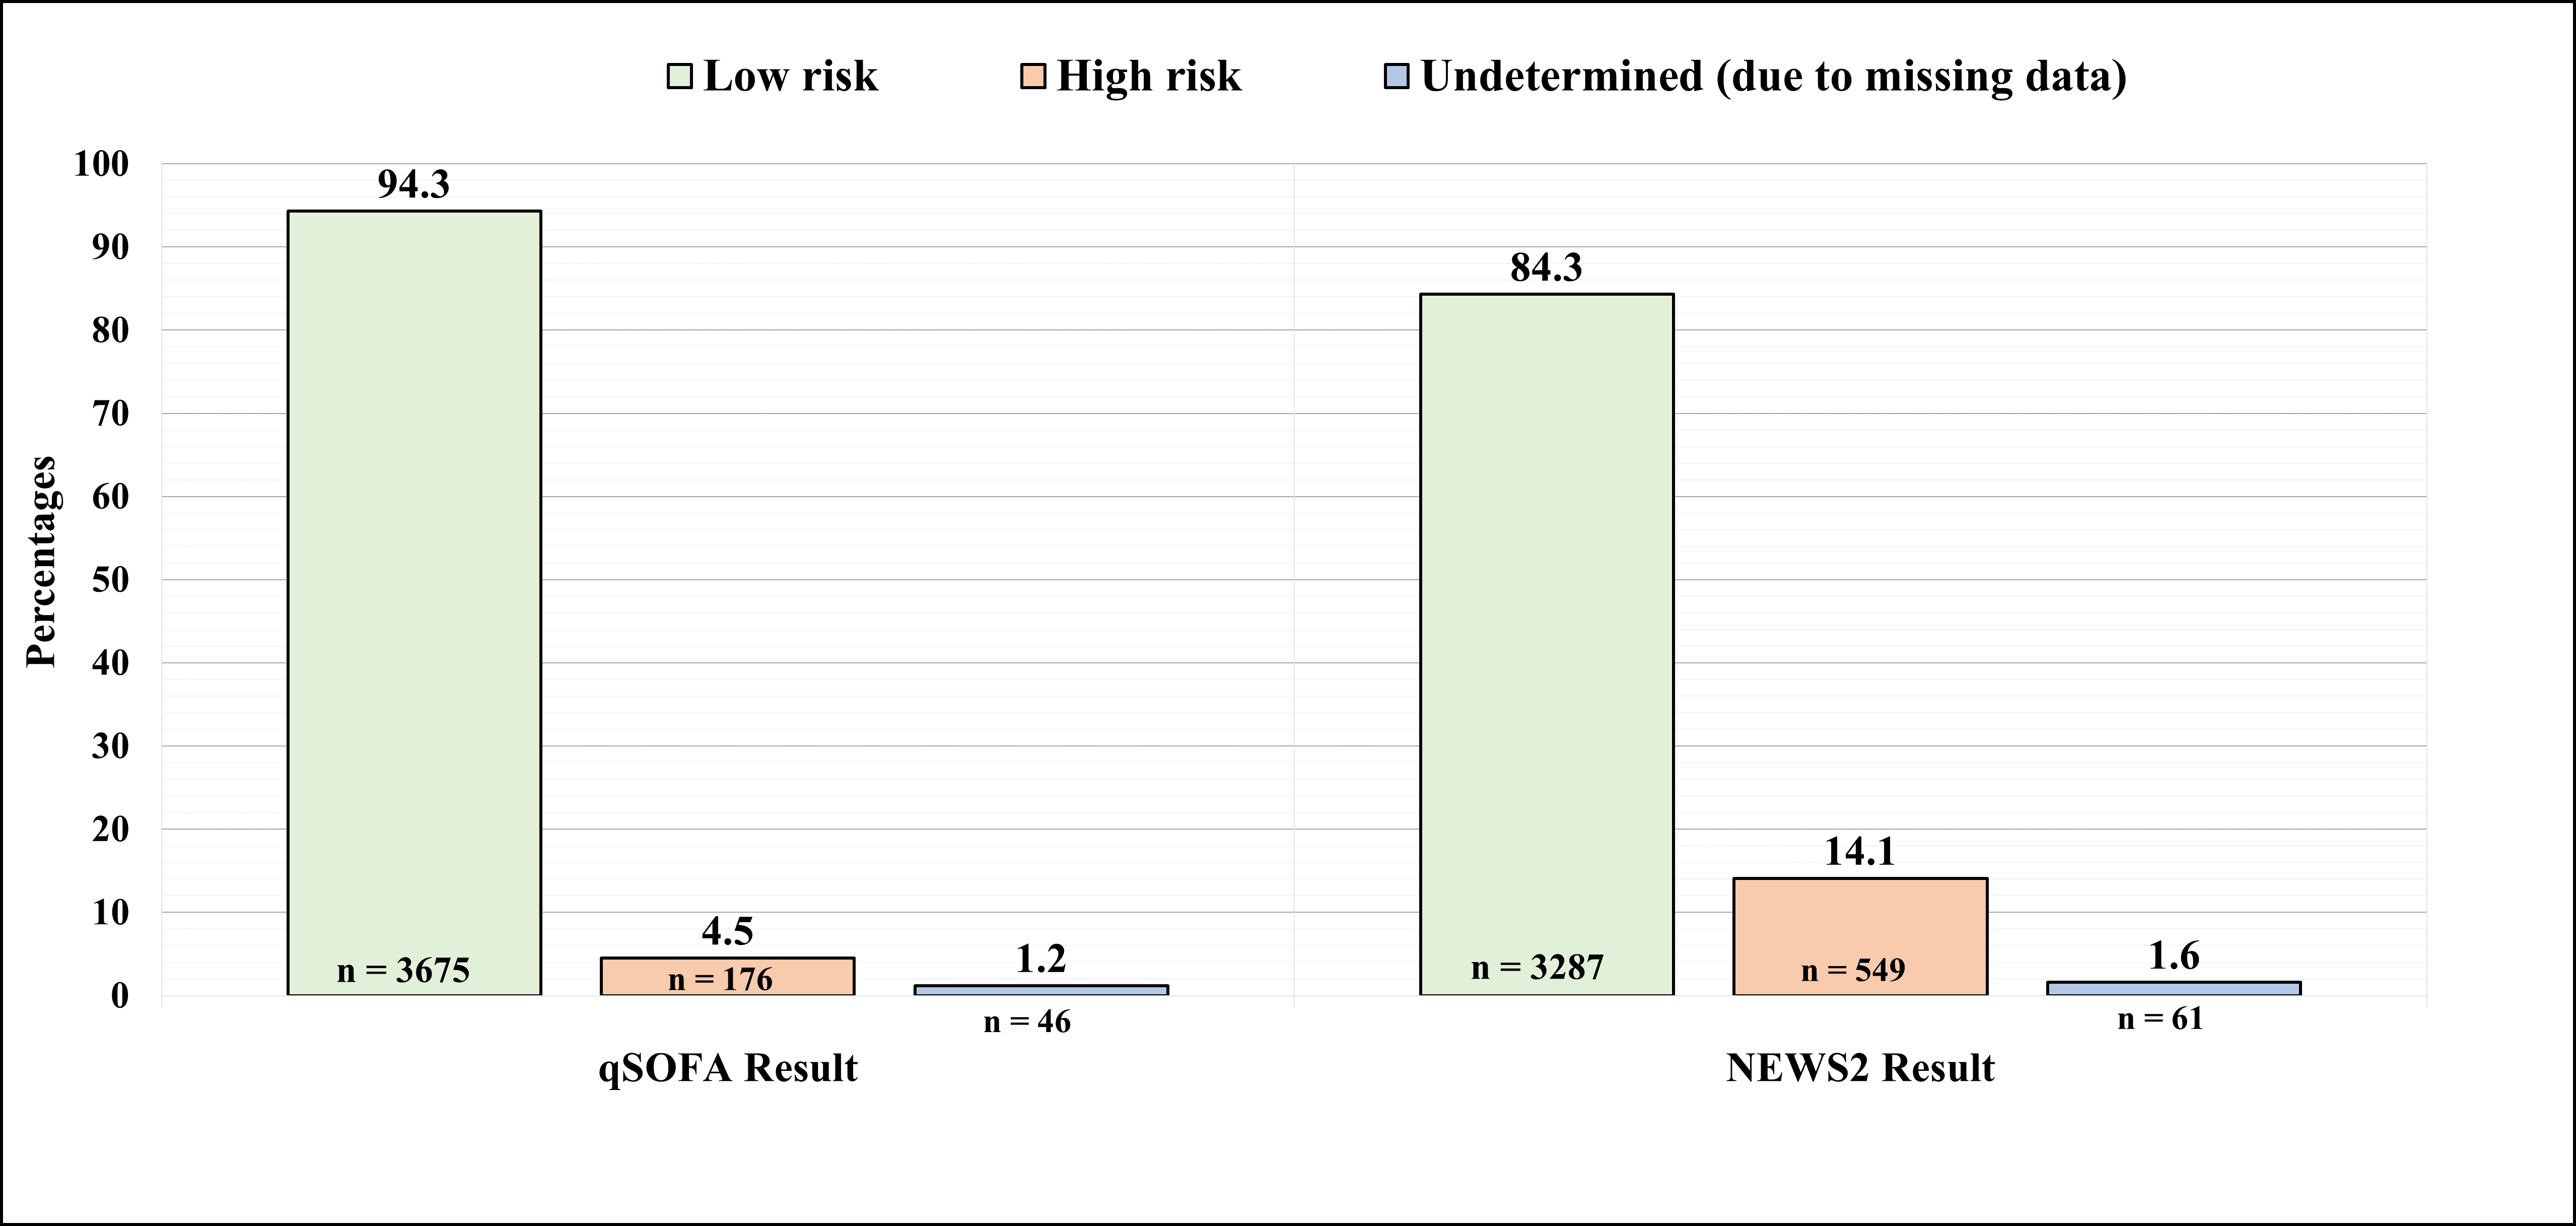
Figure 2. Patients’ risk assessment of sepsis
Among the participants, 2026 (52%) fulfilled the SIRS criteria, 1849 (47.4%) did not meet the criteria, while the status of 22 (0.6%) stayed undetermined due to missing data. 46 (1.2%) of these patients were categorised as sepsis (due to positive cultures) and remaining 3824 (98.1%) as not having sepsis, while the sepsis status of 27 (0.7%) patients was undetermined, due to missing data (Figure 3). As for the qSOFA sensitivity and specificity scale in detecting SIRS, the sensitivity was observed to be 7.06%, while the specificity was 98.14%. Moreover, in detecting sepsis, qSOFA sensitivity was observed to be 43.47%, while the specificity was 95.91%. As for NEWS2, the sensitivity for detecting SIRS was 24.33%, while the specificity was 96.71%. NEWS2 sensitivity for detecting sepsis was 82.61%, while the specificity was recorded to be 86.6% (Table 5).
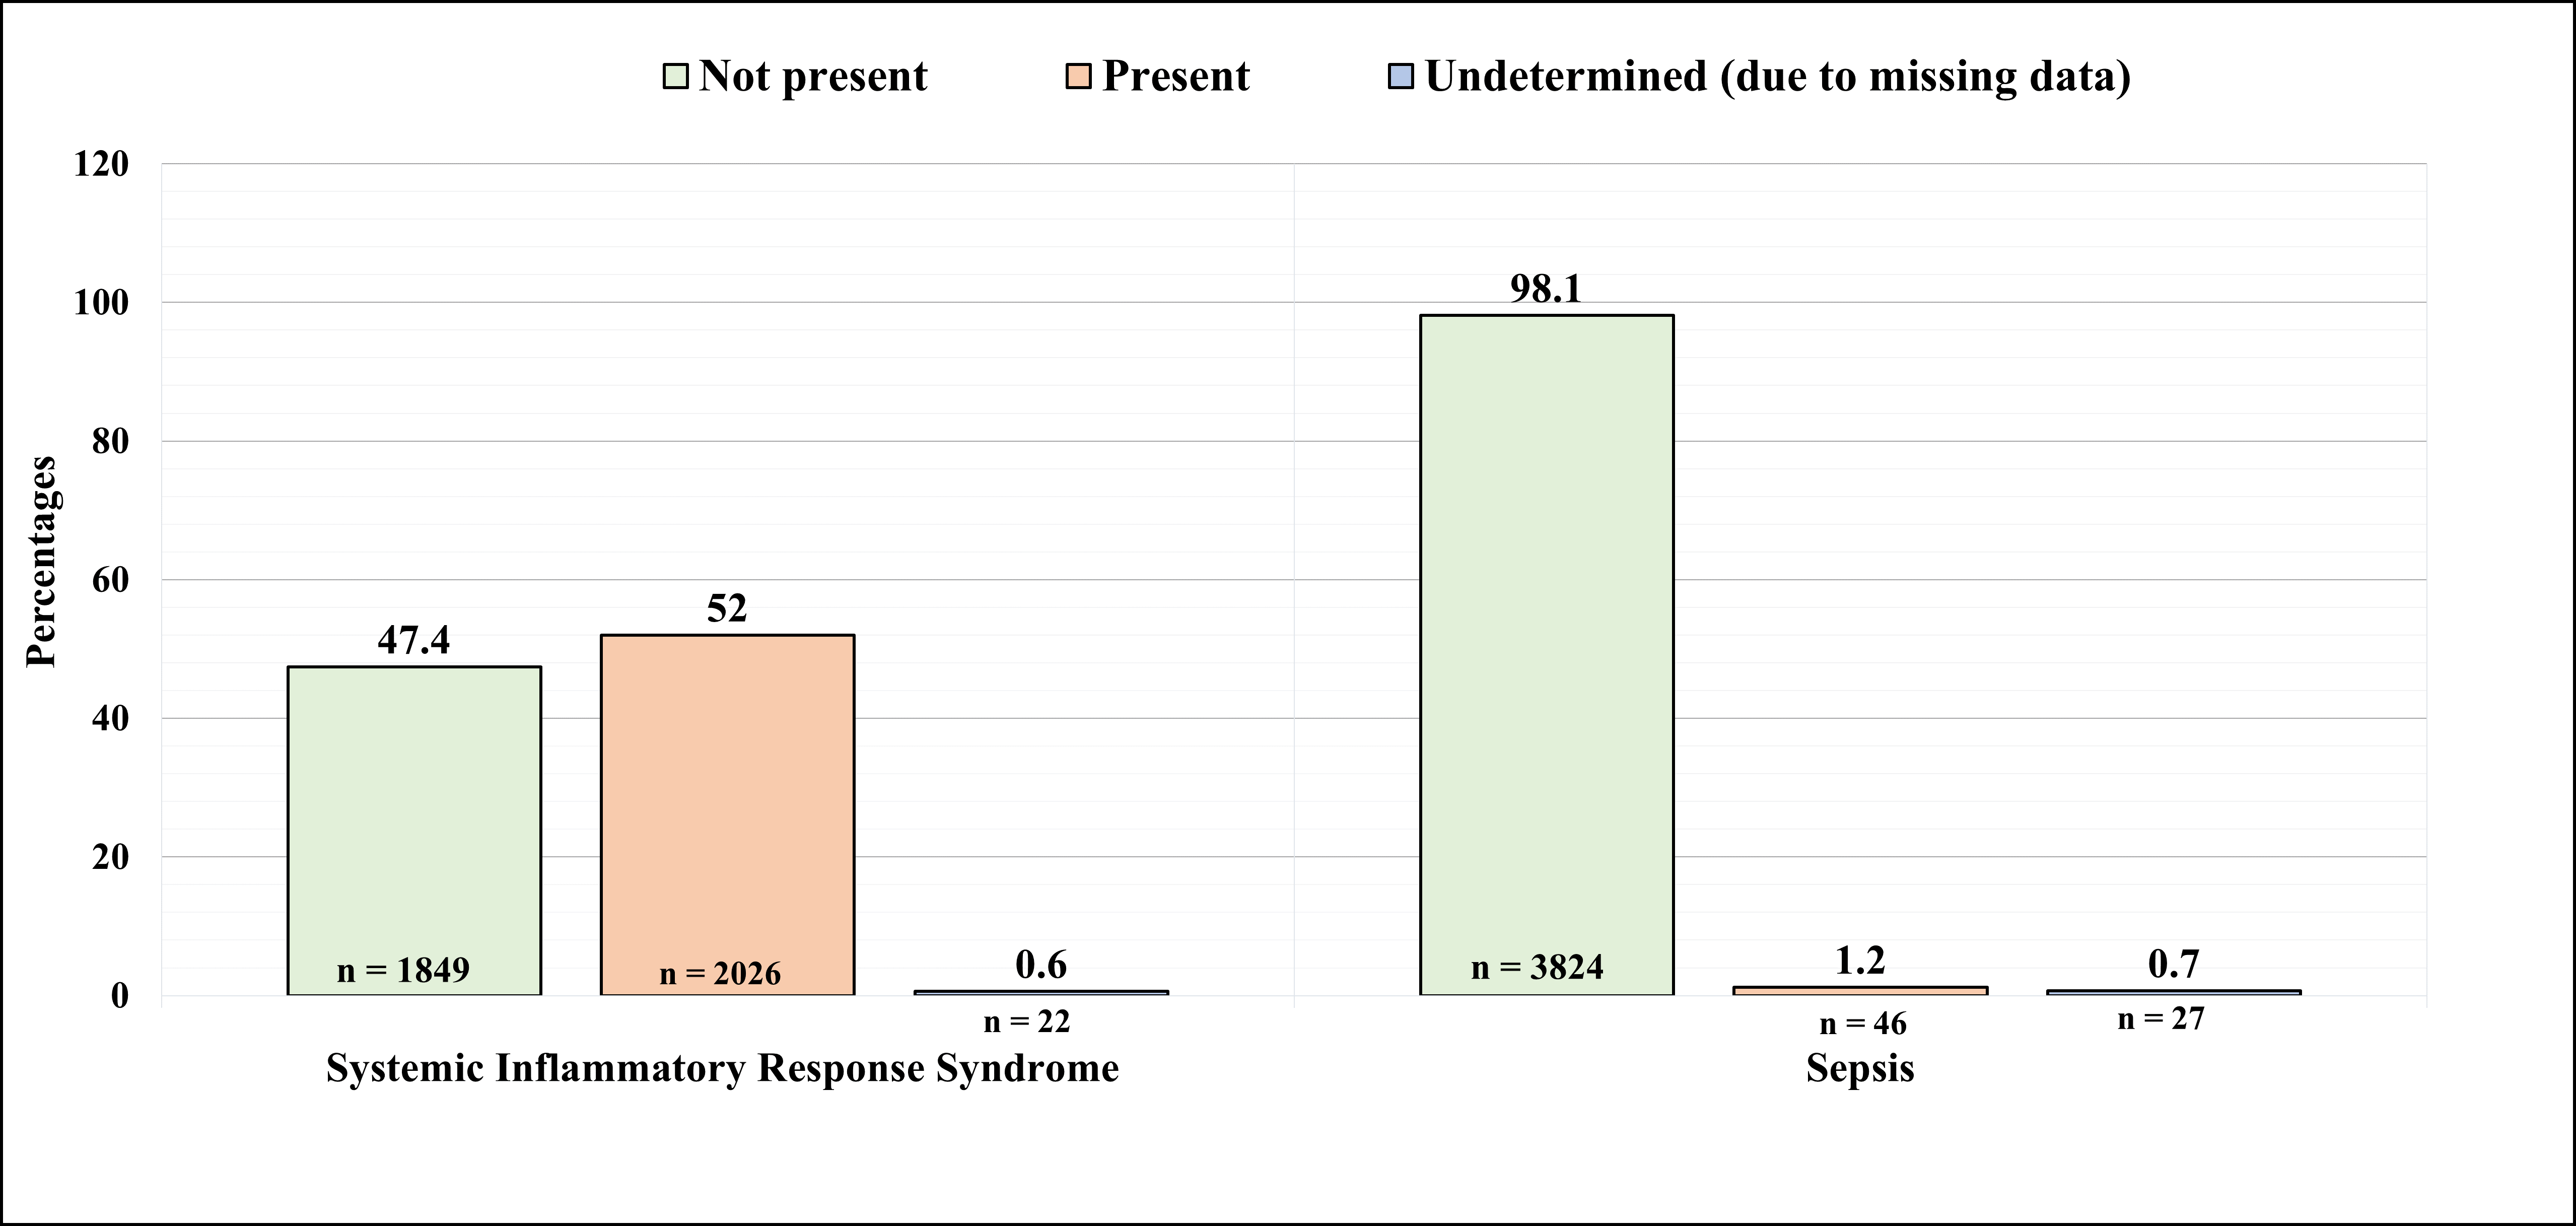
Figure 3. Prevalence of systemic inflammatory response syndrome and sepsis
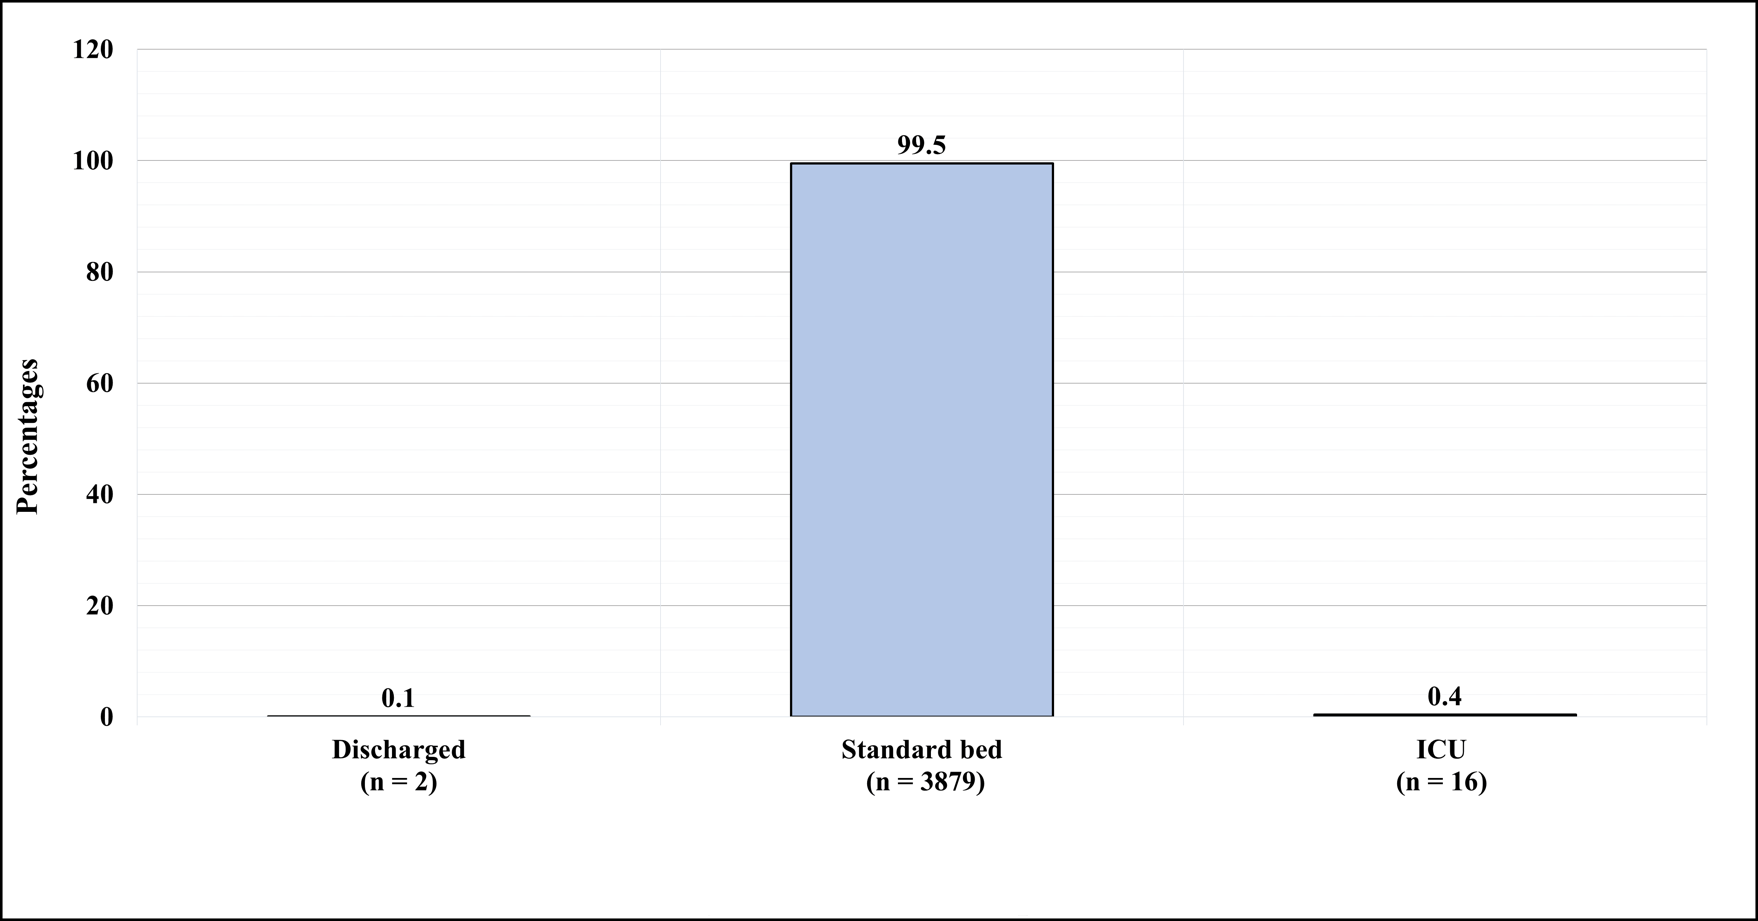
Figure 4. Patients’ disposition
Table 4. Laboratory investigation, imaging profile, and evidence of infection (n = 3897)
qSOFA (n = 3845) |
qSOFA parameters for systemic inflammatory response syndrome |
True positive |
142 |
False positive |
34 |
True negative |
1799 |
False negative |
1870 |
qSOFA sensitivity and specificity in detecting systemic inflammatory response syndrome |
Sensitivity |
7.06% |
Specificity |
98.14% |
qSOFA parameters for sepsis |
True positive |
20 |
False positive |
155 |
True negative |
3639 |
False negative |
26 |
qSOFA sensitivity and specificity in detecting sepsis |
Sensitivity |
43.47% |
Specificity |
95.91% |
NEWS2 (n = 3835) |
NEWS2 parameters for systemic inflammatory response syndrome |
True positive |
489 |
False positive |
60 |
True negative |
1765 |
False negative |
1521 |
NEWS2 sensitivity and specificity in detecting systemic inflammatory response syndrome |
Sensitivity |
24.33% |
Specificity |
96.71% |
NEWS2 parameters for sepsis
|
True positive |
38 |
False positive |
507 |
True negative |
3277 |
False negative |
8 |
NEWS2 sensitivity and specificity in detecting sepsis
|
Sensitivity |
82.61% |
Specificity |
86.60% |
Table 5. Sensitivity and specificity of qSOFA and NEWS2 in detecting systemic inflammatory response syndrome and sepsis
Factor |
Sepsis Risk Assessment based on qSOFA
|
P-Value |
Low risk of sepsis |
High risk of sepsis |
|
Clinical presentation |
Headache (n, %) |
Present
|
140 (96.6%) |
5 (3.4%) |
0.51
|
Not present
|
3535 (95.4%) |
171 (4.6%) |
Abdominal pain (n, %)
|
|
Present
|
265 (95.7%) |
12 (4.3%) |
0.844 |
Not present
|
3410 (95.4%) |
164 (4.6%) |
|
Flank pain (n, %)
|
Present
|
8 (72.7%) |
3 (27.3%) |
< 0.001* |
Not present
|
3667 (95.5%) |
173 (4.5%) |
|
Shortness of breath (n, %) |
Present
|
1205 (95.6%) |
56 (4.4%) |
0.789 |
Not present
|
2470 (95.4%) |
120 (4.6%) |
|
Cough (n, %)
|
Present
|
546 (96.3%) |
21 (3.7%) |
0.285 |
Not present
|
3129 (95.3% |
155 (4.7%) |
|
Fever (n, %)
|
Present
|
1970 (96.5%) |
72 (3.5%) |
0.001* |
Not present
|
1705 (94.3%) |
104 (5.7%) |
|
Diarrhea (n, %)
|
Present
|
360 (95.5%) |
17 (4.5%) |
0.952 |
Not present
|
3315 (95.4%) |
159 (4.6%) |
|
Nausea (n, %)
|
Present
|
722 (96.8%) |
24 (3.2%) |
0.049* |
Not present
|
2953 (95.1%) |
152 (4.9%) |
|
Vomiting (n, %) |
Present
|
746 (96.3%) |
29 (3.7%) |
0.217 |
Not present
|
2929 (95.2%) |
147 (4.8%) |
|
Malaise (n, %)
|
Present
|
720 (96.5%) |
26 (3.5%) |
0.114 |
Not present
|
2955 (95.2%) |
150 (4.8%) |
|
Vital Signs |
Temperature (°C) (mean, standard deviation)
|
37.87 + 0.911 |
37.66 + 1.03 |
0.003* |
Heart rate (mean, standard deviation)
|
88.54 + 17.82 |
95.52 + 21.96 |
< 0.001* |
Diastolic blood pressure (mean, standard deviation)
|
74.43 + 10.28 |
64.53 + 12.21 |
< 0.001* |
Oxygen saturation (mean, standard deviation)
|
97.64 + 2.88 |
95.30 + 9.96 |
< 0.001* |
Laboratory investigation |
Lactate (median, interquartile range) |
2 + 1.6 |
2.3 + 1.8 |
0.021 |
Procalcitonin |
1.8 + 1.8 |
1.7 + 2.88 |
0.464 |
WBC count |
10.82 + 12.12 |
10.45 + 12.35 |
0.145 |
RBC count |
5.65 + 9.06 |
4.39 + 5.18 |
< 0.001* |
Platelets |
124 + 46 |
133 + 129 |
0.027* |
C-reactive protein |
11.3 + 12.17 |
14 + 28.56 |
< 0.001* |
Creatinine |
75 + 15 |
77 + 20 |
0.146 |
Source of Infection and Imaging
|
COVID-19 status (n, %) |
Negative
|
3658 (95.6%) |
169 (4.4%) |
< 0.001* |
Positive
|
12 (70.6%) |
5 (29.4%) |
|
Blood culture (n, %) |
Negative
|
3660 (95.7%) |
164 (4.3%) |
< 0.001* |
Positive
|
15 (55.6%) |
12 (44.4%) |
|
Urine culture (n, %)
|
Negative
|
3664 (95.6%) |
170 (4.4%) |
< 0.001* |
Positive
|
11 (64.7%) |
6 (35.3%) |
|
Chest x-ray (n, %) |
Done |
3650 (95.6%) |
168 (4.4%) |
< 0.001* |
Not done
|
25 (75.8%) |
8 (24.2%) |
|
NEWS2 risk assessment of sepsis (n, %) |
Low risk of sepsis
|
3271 (99.5%) |
16 (0.5%) |
< 0.001* |
High risk of sepsis
|
389 (70.9%) |
160 (29.1%) |
|
*Significant at level 0.05 |
Table 6. Factors associated with sepsis risk assessment based on qSOFA
Factor |
|
Sepsis Risk Assessment based on NEWS2 |
P-Value
|
Low risk of sepsis |
High risk of sepsis |
Vital Signs |
Diastolic blood pressure (mean, standard deviation) |
74.73 + 10.15 |
69.49 + 11.86 |
< 0.001* |
Laboratory investigation |
Lactate (median, interquartile range) |
2 + 1.6 |
2 + 1.6 |
0.383 |
Procalcitonin (median, interquartile range) |
1.8 + 1.8 |
1.7 + 2.3 |
0.243 |
WBC count (median, interquartile range) |
10.82 + 12.12 |
10.82 + 12.38 |
0.955 |
RBC count (median, interquartile range) |
5.67 + 9.44 |
4.86 + 7.22 |
0.001* |
Platelets (median, interquartile range) |
123 + 43 |
133 + 119 |
< 0.001* |
C-reactive protein (median, interquartile range) |
11.3 + 12.18 |
12.33 + 17.19 |
0.001* |
Creatinine (median, interquartile range) |
75 +14 |
75 + 18 |
0.386 |
Source of Infection and Imaging |
COVID-19 status (n, %) |
Negative |
3283 (86.1%) |
529 (13.9%) |
< 0.001* |
Positive |
3 (17.6%) |
14 (82.4%) |
|
Blood culture (n, %) |
Negative |
3279 (86.1%) |
530 (13.9%) |
< 0.001* |
Positive |
8 (29.6%) |
19 (70.4%) |
|
Urine culture (n, %) |
Negative |
3282 (85.9%_) |
537 (14.1%) |
< 0.001* |
Positive |
5 (29.4%) |
12 (70.6%) |
|
Chest x-ray (n, %) |
Done |
3280 (86.2%) |
523 (13.8%) |
< 0.001* |
Not done |
7 (21.2%) |
26 (78.8%) |
|
*Significant at level 0.05 |
|
|
|
Table 7. Factors associated with sepsis risk assessment based on NEWS2
Reference Table 1. NEWS is a sum total scoring system derived from six physiologic parameters
Physiological parameter |
3 |
2 |
1 |
0 |
1 |
2 |
3 |
Respiratory rate (per minute) |
≤ 8 |
|
9-11 |
12-20 |
|
21-24 |
≥25 |
SpO2 scale 1 (%) |
≤ 91 |
92-93 |
94-95 |
≥96 |
|
|
|
SpO2 scale 2 (%) |
≤ 83 |
84-85 |
86-87 |
≥ 88-92
≥ 93 on air |
93-94 on oxygen |
95-96 on oxygen |
≥97 on oxygen |
Air or oxygen |
|
Oxygen |
|
Air |
|
|
|
Systolic blood pressure (mmHg) |
≤ 90 |
91-100 |
101-110 |
111-219 |
|
|
≥ 220 |
Pulse (per minute) |
≤ 40 |
|
41-50 |
51-90 |
93-110 |
111-130 |
≥131 |
Consciousness |
|
|
|
Alert |
|
|
CVPU |
Reference Table 2.
NEW score |
Clinical risk |
Response |
Aggregate score 0-4 |
Low |
Ward-based response |
Red score
Score of 3 in any individual parameter |
Low-Medium |
Urgent ward-based response |
Aggregate score 5-6 |
Medium |
Key threshold for urgent response |
Aggregate score 7 or more |
High |
Urgent or emergency responses |
Reference Table 3. qSOFA is the modified version of the Sequential Organ Assessment Score (SOFA)
qSOFA criteria |
qSOFA value point |
Respiratory rate >22 breaths per minute |
1 point |
Altered Mentation ≤14 |
1 point |
Systolic blood pressure <100 mmHg |
1 point |
Score >2 is associated with poor outcome due to sepsis |
Discussion
Sepsis is a time-sensitive condition that requires prompt diagnosis and management. For every hour of delay in commencing treatment, there is a 3-7% increase in the chance of a poor outcome [17]. The CTAS category allocated by the ED triage nurse plays a vital role in expediting management of sepsis [18]. Tertiary center nurses are accustomed to triaging a complex cohort of patients, which helps allocate appropriate triage categories [18,19]. This is comparable to the findings in a cohort study of 60 patients, where 63% of the sepsis patients were allocated CTAS category 2 [19].
It is recommended that sepsis patients receive antibiotics within one hour of arriving at the ED [20]. In our study, ED physicians seen time (door to doctor time) for 2,564 (66%) patients was between 1-2 hours, resulting in a relative delay in starting treatment for patients. A similar observational study conducted in Norway found only 44.9% were seen by a physician in line with the triage priority [21]. The delay in door to doctor time has been attributed to multiplicity of factors, including overcrowding within the ED [22].
A significant number of our study patients presented with undifferentiated symptoms. The heterogeneity in clinical presentation makes it difficult for physicians to diagnose sepsis, as was seen in a cohort study, where 56% of the patients had undifferentiated clinical presentations [21]. Another prospective cohort study of 551 ED ambulance patients with sepsis, had abnormal temperature (64.1.%), pain (38.4%), acute altered mental status (38.2%), weakness of the legs (35.1%), breathing difficulties (30.4%), loss of energy (26.2%) and gastrointestinal symptoms (24.0%) [23]. This further highlights the variability in the presentation of suspected sepsis patients.
Vital signs (HR, BP, RR, O2 sats, Temp, GCS) are primary components of qSOFA and NEWS2 criteria. In a cohort study conducted within the ambulance setting mentioned above, three components of the vital signs showed most significant association with sepsis; systolic blood pressure (BP) ≤ 100 mmHg, GCS < 15, and temperature > 38.5 °C [23]. In contrast, within our patient population, 52.9% were afebrile and 92.6% had a GCS score of 15. In addition, their mean systolic and diastolic BPs were 120.79 mmHg and 73.96 mmHg respectively. This emphasises the importance of clinical judgment to go hand in hand with predictive criteria. In addition, this also highlights the lack of sensitivity of qSOFA in certain patient populations (as in our tertiary care center), where patients with multiple comorbidities can have camouflaged presentations.
Our patients had a mean HR of 88.88/minute, which is similar to the findings of a retrospective cohort study that included 11,300 patients, who had a mean HR of 80.02 (14.33) [24]. One of the known clinical presentations of sepsis is altered mental status or sepsis-associated encephalopathy (SAE). In one study, >50% of patients showed features of SAE at initial presentation [25]. Another cohort study reported 67% of the patients with sepsis had altered mental status [26]. In contrast, 92.6% of our study population was alert on arrival to the ED. This discrepancy can be attributed to the fact that 52% of our patients were in SIRS, before progressing to sepsis.
A small group (0.4%) of our patients tested positive for COVID-19. A study comparing clinical characteristics and outcomes in critically ill septic patients found higher mortality (59%) in COVID-19, when compared to the non-COVID-19 group (29%) [27]. In our study, NEWS2 was more sensitive in identifying sepsis patients, when compared to qSOFA. Overall, NEWS2 identified 14.1% of the patients as high risk compared to 4.5% identified by qSOFA (Figure 2). This concurs with the findings of the systematic review that showed qSOFA to have a poor positive predictive value and low sensitivity in identifying septic patients [20].
NEWS2 sensitivity for detecting sepsis was 82.61% compared to qSOFA, which was 43.47%. The specificity of NEWS2 and qSOFA was observed to be 86.6% and 95.91% respectively. Our findings are similar to the study carried out in an urban tertiary-care center, where NEWS2 was found to be the most accurate scoring system for the detection of sepsis. qSOFA was found to be the least sensitive and less useful in the ED setting for sepsis screening [28].
Biomarkers like pro-calcitonin serial levels have been advocated for risk stratification, prognostication and shorter treatment duration of sepsis [29]. However in our patient group, we found no statistically significant association between increased procalcitonin levels and the risk of sepsis. The unreliability of pro-calcitonin as a prognostic indicator has been observed in various other studies, indicating its limited significance as an independent variable. Additionally, preexisting conditions like chronic kidney disease may affect pro-calcitonin levels, leading to higher values at the baseline. It is probable that underlying comorbidities in our patient group may have influenced procalcitonin levels [30].
The definition of septic shock includes lactate concentrations > 2 mmol/L (> 18 mg/dL) making it an early blood test for suspecting sepsis [31]. Patients with higher lactate levels had a higher risk of dying during their hospital stay [32]. In contrast, our study revealed, no significant correlation with lactate levels in patients suspected of sepsis. This could be attributed to a very immunocompromised patient cohort with poor physiological reserves.
C-reactive protein (CRP) has high sensitivity in detecting sepsis especially in neonates [33]. Moreover, higher CRP levels were shown to be directly correlated with poor prognosis and higher risk of death [34]. We found a statistically significant proportion of our patients with elevated CRP levels (median level 11.2). However, in a study investigating the discriminative ability to predict bloodstream bacterial infection in adult ED patients, procalcitonin and lactate levels were shown to have better discriminative power in detecting sepsis than CRP at a cutoff of ≥0.8 mg/dL [35].
Blood culture positivity in sepsis patients has mixed results. Some studies show no difference and others report lower mortality in culture-negative sepsis. One study found no significant difference between the culture negative and the culture positive groups in relation to clinical severity [36]. Another study found 64.5% of sepsis patients were culture positive, with most pathogens isolated in the blood (36.4%), and lesser in the urine (20.4%) [37]. Our patients’ cohort had a statistically significant correlation with blood culture positivity. Positive blood cultures help commence targeted antibiotic therapy, reducing the risk of developing microbial resistance and healthcare costs [29].
The role of platelets in the development and progression of sepsis has been the focus of some in-vivo studies. It was found that the severity and the duration of persistent thrombocytopenia is associated with worse outcomes. A study found 20%–58% of septic patients develop thrombocytopenia, denoting the importance of monitoring platelet levels in all septic patients. Thrombocytopenia has also been identified as a risk factor for mortality in sepsis; however, it is unknown whether low platelet count is the cause or consequence of sepsis severity [37,38]. Our study found a statistically significant proportion of sepsis suspected patients with reduced platelets levels.
The incidence of acute kidney injury in patients with septic shock is reported to be 40%–50% and is associated with an increase in mortality [39]. However, our study found a median creatinine levels of 75 mg/dL, which had no statistical significance.
Coagulopathy is a commonly reported complication of sepsis and plays a key role in multiple organ dysfunction. Studies also identified prothrombin time (PT) as a risk factor for 28-day sepsis mortality [40]. Our study did not reveal any significant correlation with PT or partial thromboplastin (PTT) time. We found that 0.4% of our study population was admitted to ICU and 0.1% of the patients were discharged. The remaining 99.5% of our patients were admitted to a standard hospital bed. In contrast, one study found that 13% of the admitted septic patients clinically deteriorated, necessitating ICU admission [41].
A study conducted in several hospitals in China found significant variability in different hospitals’ ICU admission rates among septic patients, ranging from 4.1% to 61.2% [42]. Another study found 16.1% of patients with clinical sepsis were discharged from the ED. These patients were deemed to be low risk.
Limitations of the study
Our study has been conducted in a single tertiary care hospital with a specific patient group, hence the results cannot be generalised. A multicentre study will allow for a more representative sample. Furthermore, the study relied mainly on retrospective data, which can be of limited value. The inclusion criteria used in our study could have overestimated the number of sepsis patients.
Future directions
The results of our study can be used as a foundation for other centers in Saudi Arabia and worldwide to establish standardized criteria for predicting sepsis syndrome within an ED setting. We recommend AI should be incorporated in the early detection of sepsis. Prediction criteria can be electronically embedded, to generate an automated alert for patients with a constellation of symptoms and vital signs. This automation can result in the reduction of human delays/errors and potentially speed up the process of early detection and treatment of sepsis.
Conclusion
NEWS2 criteria was more sensitive but less specific in detecting sepsis compared to qSOFA in our ED. This could be due to the larger number of parameters employed by NEWS2, namely O2 saturation, pulse rate, and temperature. Our study found a significant portion of sepsis patients presented with decreased O2 saturation levels, increased pulse rate and increased temperature. These parameters allowed NEWS2 to more accurately predict the risk of sepsis. Patients with several comorbidities and immunocompromised systems can manifest sepsis atypically, hence the importance of clinical judgment to be used alongside any predictive criteria.
Conflicts of interest
The authors declare no conflicts of interest.
References
- Rudd KE, Johnson SC, Agesa KM, Shackelford KA, Tsoi D, et al. (2020) Global, regional, and national sepsis incidence and mortality, 1990-2017: Analysis for the Global Burden of Disease Study. Lancet 395: 200-211. [Crossref]
- Vucelić V, Klobučar I, Đuras-Cuculić B, Gverić Grginić A, Prohaska-Potočnik C, et al. (2020) Sepsis and septic shock - an observational study of the incidence, management, and mortality predictors in a medical intensive care unit. Croat Med J 61: 429-439. [Crossref]
- Romero B, Fry M, Roche M (2017) The impact of evidence‐based sepsis guidelines on emergency department clinical practice: A pre‐post medical record audit. J Clin Nurs 26: 3588-3596. [Crossref]
- Singer M, Deutschman CS, Seymour CW, Shankar-Hari M, Annane D, et al. (2016) The third international consensus definitions for sepsis and septic shock (Sepsis-3). JAMA 315: 801-810. [Crossref]
- Ehrmann C, Engel J, Moritz A, Roscher K (2021) Assessment of platelet biology in equine patients with systemic inflammatory response syndrome. J Vet Diagn Invest 33: 300-307. [Crossref]
- Nieves Ortega R, Rosin C, Bingisser R, Nickel CH (2019) Clinical scores and formal triage for screening of sepsis and adverse outcomes on arrival in an emergency department all-comer cohort. J Emerg Med 57: 453-460.e2. [Crossref]
- Pepic I, Feldt R, Ljungström L, Torkar R, Dalevi D, et al. (2021) Early detection of sepsis using artificial intelligence: A scoping review protocol. Syst Rev 10: 28. [Crossref]
- Mellhammar L, Linder A, Tverring J, Christensson B, Boyd JH, et al. (2019) NEWS2 is superior to qSOFA in detecting sepsis with organ dysfunction in the emergency department. J Clin Med 29: 1128. [Crossref]
- Silcock DJ, Corfield AR, Gowens PA, Rooney KD (2015) Validation of the national early warning score in the prehospital setting. Resuscitation 89: 31-35. [Crossref]
- Goulden R, Hoyle MC, Monis J, Railton D, Riley V, et al. (2018) qSOFA, SIRS and NEWS for predicting inhospital mortality and ICU admission in emergency admissions treated as sepsis. Emerg Med J 35: 345-349. [Crossref]
- Haydar S, Spanier M, Weems P, Wood S, Strout T (2017) Comparison of QSOFA score and SIRS criteria as screening mechanisms for emergency department sepsis. Am J Emerg Med 35: 1730-1733. [Crossref]
- Oduncu AF, Kıyan GS, Yalçınlı S (2021) Comparison of qSOFA, SIRS, and NEWS scoring systems for diagnosis, mortality, and morbidity of sepsis in emergency department. Am J Emerg Med 48: 54-59. [Crossref]
- Mukherjee V, Evans L (2017) “Implementation of the surviving sepsis campaign guidelines.” Curr Opin Crit Care 23: 412-416. [Crossref]
- Alhazzani W, Evans L, Alshamsi F, Møller MH, Ostermann M, et al. (2021) Surviving sepsis campaign guidelines on the management of adults with coronavirus disease 2019 (COVID-19) in the ICU: First update. Crit Care Med 49: e219-e234. [Crossref]
- Litell JM, Guirgis F, Driver B, Jones AE, Puskarich MA (2021) Most emergency department patients meeting sepsis criteria are not diagnosed with sepsis at discharge. Acad Emerg Med 28: 745-752. [Crossref]
- Schinkel M, Paranjape K, Nannan Panday RS, Skyttberg N, Nanayakkara PWB (2019) Clinical applications of artificial intelligence in sepsis: A narrative review. Comput Biol Med 115: 103488. [Crossref]
- Seymour CW, Kahn JM, Martin-Gill C, Callaway CW, Yealy DM, et al. (2017) Delays from first medical contact to antibiotic administration for sepsis. Crit Care Med 45: 759-765. [Crossref]
- Nevill A, Kuhn L, Thompson J, Morphet J (2021) The influence of nurse allocated triage category on the care of patients with sepsis in the emergency department: A retrospective review. Australas Emerg Care 24: 121-126. [Crossref]
- Mitzkewich M (2019) Sepsis screening in triage to decrease door-to-antibiotic time. J Emerg Nurs 45: 254-256. [Crossref]
- Mok K, Christian MD, Nelson S, Burry L (2014) Time to administration of antibiotics among inpatients with severe sepsis or septic shock. Can J Hosp Pharm 67: 213-219. [Crossref]
- Husabø G, Nilsen RM, Flaatten H, Solligård E, Frich JC, et al. (2020) Early diagnosis of sepsis in emergency departments, time to treatment, and association with mortality: An observational study. PLoS One 22: e0227652. [Crossref]
- Wallgren UM, Bohm KEM, Kurland L (2017) Presentations of adult septic patients in the prehospital setting as recorded by emergency medical services: A mixed methods analysis. Scand J Trauma Resusc Emerg Med 25: 23. [Crossref]
- Lim WT, Fang AH, Loo CM, Wong KS, Balakrishnan T (2019) Use of the National Early Warning Score (NEWS) to identify acutely deteriorating patients with sepsis in acute medical ward. Ann Acad Med Singap 48: 145-149. [Crossref]
- Helbing DL, Böhm L, Witte OW (2018) Sepsis-associated encephalopathy. CMAJ 190: E1083. [Crossref]
- Wallgren UM, Sjölin J, Järnbert-Pettersson H, Kurland L (2020) The predictive value of variables measurable in the ambulance and the development of the predict sepsis screening tools: A prospective cohort study. Scand J Trauma Resusc Emerg Med 28: 59. [Crossref]
- Heubner L, Hattenhauer S, Güldner A, Petrick PL, Roessler M, et al. (2022) Characteristics and outcomes of sepsis patients with and without COVID-19. J Infect Public Health 15: 670-676. [Crossref]
- Usman OA, Usman AA, Ward MA (2019) Comparison of SIRS, qSOFA, and NEWS for the early identification of sepsis in the emergency department. Am J Emerg Med 37: 1490-1497. [Crossref]
- Gregoriano C, Heilmann E, Molitor A, Schuetz P (2020) Role of procalcitonin use in the management of sepsis. J Thorac Dis 12: S5-S15. [Crossref]
- Yunus I, Fasih A, Wang Y (2018) The use of procalcitonin in the determination of severity of sepsis, patient outcomes and infection characteristics. PLoS One 13: e0206527. [Crossref]
- Dugar S, Choudhary C, Duggal A (2020) Sepsis and septic shock: Guideline-based management. Cleve Clin J Med 87: 53-64. [Crossref]
- Liu Z, Meng Z, Li Y, Zhao J, Wu S, Gou S, et al. (2019) prognostic accuracy of the serum lactate level, the SOFA score and the qSOFA score for mortality among adults with sepsis. Scand J Trauma Resusc Emerg Med 27: 51. [Crossref]
- Kaur S, Singh K (2021) Early-onset neonatal sepsis: Role of C-reactive protein, micro-ESR, and gastric aspirate for polymorphs as screening markers. Int J Pediatr 2021: 1544553. [Crossref]
- Li Q, Gong X (2018) Clinical significance of the detection of procalcitonin and C-reactive protein in the intensive care unit. Exp Ther Med 15: 4265-4270. [Crossref]
- Lin CT, Lu JJ, Chen YC, Kok VC, Horng JT (2017) Diagnostic value of serum procalcitonin, lactate, and high-sensitivity C-reactive protein for predicting bacteremia in adult patients in the emergency department. PeerJ 5: e4094. [Crossref]
- Sigakis MJG, Jewell E, Maile MD, Cinti SK, Bateman BT, et al. (2019) Culture-negative and culture-positive sepsis: A comparison of characteristics and outcomes. Anesth Analg 129: 1300-1309. [Crossref]
- Kushwaha A, Krishnan A, Offor OL, Nair AS, Hanumanthu B, et al. (2020) Analysis of culture-positive VS culture-negative sepsis IN an urban ICU. Chest 158: A604-A605.
- Assinger A, Schrottmaier WC, Salzmann M, Rayes J (2019) Platelets in sepsis: An update on experimental models and clinical data. Front Immunol 10:1687. [Crossref]
- Peerapornratana S, Manrique-Caballero CL, Gómez H, Kellum JA (2019) Acute kidney injury from sepsis: Current concepts, epidemiology, pathophysiology, prevention and treatment. Kidney Int 96: 1083-1099. [Crossref]
- Li M, Huang P, Xu W, Zhou Z, Xie Y, Chen C, et al. (2022) Risk factors and a prediction model for sepsis: A multicenter retrospective study in China. J Intensive Med 2: 183-188. [Crossref]
- de Groot B, de Deckere E, Flameling R, Sandel M, Vis A (2011) 336 disposition of emergency department patients with severe sepsis and septic shock to ward or ICU: Performance of the Piro score compared to clinical judgment. Annal Emerg Med 58: S290-S291.
- Anesi GL, Dress E, Chowdhury M, Wang W, Small DS, et al. (2023) Hospital strain and variation in sepsis ICU admission practices and associated outcomes. Crit Care Explor 5: e0858. [Crossref]
- Peltan ID, McLean SR, Murnin E, Butler AM, Wilson EL, et al. (2022) Prevalence, characteristics, and outcomes of emergency department discharge among patients with sepsis. JAMA Netw Open 5: e2147882. [Crossref]