Abstract
The accuracy of Young's modulus of bone estimated from computed tomography (CT) values has not been evaluated by means of nano-indentation (NI) measurements. This study tested the validity of an equation for obtaining Young's modulus from CT-derived bone mineral density (BMD). Maxillary bones of 17-week-old male C57BL/6J mice (n=9) were scanned by micro-CT (µCT) after sacrifice, and subsequently subjected to NI (n=5) in wet conditions at two regions of interest (ROI). These ROIs were placed in the cortical bone of the hard palate on a section parallel to the frontal plane near the incisor teeth; one at the top of the palate close to the median (ROI-1), and the other approximately 500 µm outside of ROI-1 (ROI-2). The modulus of each indent was calculated using the method of Oliver and Pharr, while BMD was estimated from the CT number of each corresponding voxel. The average Young’s modulus for ROI-1 (19.38±3.49 GPa) was statistically significantly lower than that for ROI-2 (28.91±5.06 GPa) (p<0.05), while BMD did not differ significantly between ROI-1 (1.27±0.13 g/cm3) and ROI-2 (1.38±0.13 g/cm3). The Young’s modulus (E)-BMD (ρ) relationship was obtained as a power regression model for ROI-1 (E=16.748ρ0.662, R2=0.256, p=0.163) and ROI-2 (E=17.486ρ1.596, R2=0.661, p=0.013). The relatively weak correlation for ROI-1 was presumably in association with the limitation of current µCT resolution, which could not capture non-homogeneous microstructures. The results suggest that the potential for estimating Young's modulus in local bone structures is limited when based solely on the CT numbers.
Keywords
bone mineral density, micro-CT, nano-indentation, Young’s modulus
Introduction
The accuracy of clinical diagnosis and treatment planning in dental implant therapy, involving the implant design, number of implants, and placement sites, can be further improved by mechanical analyses of the stress and strain that are generated in the bone structures under mechanical loading [1-4]. The calculated magnitude and direction of stress in a local bone segment can enhance estimation of post-operative resorption of bone near the implants, as well as the loss of osseointegration at the bone-implant interface. For this purpose, the use of three-dimensional mathematical models that are constructed based on computed tomography (CT) images of the maxillary and mandibular bone morphology has been widely attempted [5,6]. In those models, mechanical properties, such as Young’s modulus, must be input into a computer program to calculate the stress and strain distributions within the model. To perform a valid stress analysis for bone structures, it is essential to input accurate location-dependent Young's modulus based on data of individual patients. However, non-invasive measurement of Young's modulus is currently not available for the bone structures in patients. Estimation of the bone modulus by means of CT images has recently been attempted in both humans and experimental animals. However, the validity and reliability of each method have not yet been established [7,8].
CT numbers represent a quantitative scale for describing radio density, which has recently been used to estimate local densitometric measures, such as bone mineral density (BMD) [9,10]. BMD has been correlated with bone strength and toughness [11,12], and is often employed for diagnosis and treatment of osteoporosis and multiple osteomyelitis [13,14]. To date, conversion of the CT number to estimate BMD by means of a hydroxyapatite phantom as a reference has been widely used and accepted for clinical diagnostic purposes [15,16]. Therefore, if there is an appropriate mathematical equation that can be used to convert a BMD value to the Young's modulus, it is plausible that it would be possible to predict the modulus based on CT data. Various potential equations have been proposed to this end; however, those equations were quite diverse, probably due to the wide variety of animals and experimental conditions used, as well as the methods for modulus measurement [8,17]. Nevertheless, the validity and reliability of CT-based Young's modulus values cannot be ensured unless the relationship between the CT-derived BMD and the real Young's modulus is confirmed at a local bone structure. To assess this relationship, it is necessary to measure Young’s modulus directly at one site on the bone surface, and to compare it with the CT-derived BMD of the same location.
The nano-indentation (NI) method has recently been introduced and employed in many animal studies as an effective method for measuring the mechanical properties of a narrow region in living tissues and biomaterials [18]. With this method, Young’s modulus and hardness are routinely obtained by continuously monitoring the load and displacement during the indentation process, and constructing a load-displacement curve [19]. The NI measurement of local bone tissue at a microscopic level is possible regardless of sample size and shape. Therefore, the method can allow determination of the mechanical properties of the bone that typically reveals inhomogeneous structures. The potential relationship between the CT-derived BMD and the NI-measured Young's modulus at a specific site of a bone specimen can be analyzed. Moreover, this relationship can potentially facilitate generation of an equation to obtain Young's modulus from CT numbers.
We hypothesized that CT-derived BMD and Young’s modulus would be positively correlated; this could further support the validity of the mathematical diagnostic models for the implant therapy based on CT-based Young's modulus. The purpose of this study was to assess the relationship between CT-derived BMD and Young's modulus of bone structures at the same location of the same sample. In this study, two regions of interests (ROIs) were defined at the cortical bone regions of the mouse maxillary palate. The BMD data derived from CT numbers were compared and analyzed with Young's modulus that was measured at the same bone regions of the same mouse by means of the NI method. A further objective was to explore the possibility of establishing a conversion equation that would obtain Young's modulus from CT numbers.
Material and methods
Sample preparation
For this study, 17-week-old male C57BL/6J mice (SLC, Tokyo, Japan) (n=9) were maintained in our animal care facility, as previously described [20]. Nine mice were anesthetized with medetomidine hydrochloride (0.7 mg/kg, Domitor; Zenoaq, Fukushima, Japan) and ketamine hydrochloride (50 mg/kg, Ketalar; Sankyo, Tokyo, Japan), and the mice were sacrificed by cervical dislocation. After gently removing the soft tissue surrounding the bone, the maxilla of each mouse was harvested. The dissected maxillae were sectioned parallel to the frontal plane for histological analysis, as described previously [21,22] (Figure 1). Each sample was sectioned with a low-speed diamond saw (BS-3000; EXAKT Apparatebau GmbH, Norderstedt, Germany) at a thickness of approximately 1-2 mm at a position 2-3 mm behind the tip of the nose. Each sample was embedded and fixed on an acrylic plate (thickness: 2 mm, Meiwafosis Corporation, Tokyo, Japan) with a light curing polymethylmethacrylate (PMMA) resin (Technovit 7210 VLC; Kulzer, Germany) using a light irradiator (Exakt MG-4230). To enhance the matching accuracy of the tissue photograph with the µCT image, four ivory triangular prisms were also embedded near the four corners of each sample.
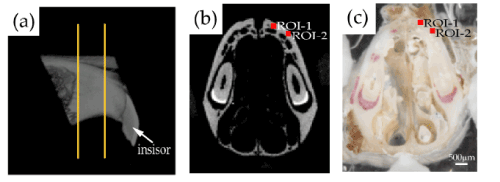
Figure 1. Preparation of bone samples. (a) A sagittal micro-computed tomography (µCT) image of the maxillary bone of a representative mouse. Two orange lines indicate the sectioning planes for sample preparation. (b) A µCT image at the sectioned plane corresponding to the indented surface. (c) The polished surface on the incisal side of a representative bone sample for indentation. The bone sample was embedded in the polymethylmethacrylate resin
All animal experimental procedures were reviewed and approved by the Animal Care and Use Committee of Tokyo Medical and Dental University (Tokyo, Japan; authorization numbers: 0150200C).
µCT scanning and imaging
Prior to imaging of each sample, a phantom block (Kyoto Kagaku, Kyoto, Japan) made from epoxy resin containing aluminum rod, which is equivalent to 1.5 g/cm3 hydroxy apatite, and 7 regions of different hydorxy apatite contents (0.8, 0.7, 0.6, 0.5, 0.4, 0.3 and 0.2 g/cm3), was scanned by using μCT (ScanXmate-E090; Comscan, Kanagawa, Japan). The BMD was calculated from CT number by linear regression derived from the data of both hydroxy apatite amounts of the phantom block and the respective CT numbers. The sample was placed on a table for µCT imaging such that the cross-section of the sample was as parallel as possible to the surface of the imaging table. The bone specimens and phantom were scanned by µCT at 65 kV and 124 µA, and 3D image data was constructed 1 hour after sacrifice. Each slice of scan data was preserved as 8-bit 506 TIFF files and imported into image processing software (Matlab 2010, Mathworks, Natick, MA, USA) to obtain the CT number distribution for each voxel in the imaging plane. The voxel size was 20.1 × 20.1 × 20.1 µm.
Regions of interest
Immediately after µCT imaging, the front surface of each sample was sequentially polished with silicon-carbide papers #500 (DCCS; Sankyo, Saitama, Japan) and with #400, #4000, and #15000 lapping film (Imperial; 3M, Tokyo, Japan) by hand-polishing under running water. The polishing was completed when the total thickness of the bone sample and the acrylic plate was 3 mm, with the bone thickness approximately 1 mm. The samples were kept at 23°C until NI measurement was performed.
Two regions of interest (ROIs) were defined on the cortical bone in the intermolar region of the hard palate on the right side of the polished surface that was parallel to the frontal plane (Figure 1). ROI-1 was defined at the cortical region of the palate, close to the median, approximately 500 µm away from the basis of the incisal tooth (Fujiki et al. 2013, Suzuki et al. 2016), while ROI-2 was also set at the cortical bone structure, approximately 500 µm outside of the ROI-1. Each ROI comprised an area of 0.7 × 0.7 mm.
NI test
NI tests were performed on the ROIs of all sample mice using a three-sided pyramid diamond Berkovich tip (ENT-1100a; Elionix, Tokyo, Japan) 4 hours after sacrifice. Fused quartz (hardness: 9.5±1.5 GPa, Young’s modulus: 7.3±7.0 GPa) was used as the standard calibration material to determine the effective measurement range of the diamond Berkovich tip, such that an almost-ideal pyramidal portion of the Berkovich indenter always dominated the contribution to the measured mechanical properties of each sample. The maximum force was 6.0 mN at a loading rate of 0.6 mN/s; to minimize the viscoelasticity effects on calculation of the Young’s modulus the holding time at the peak load was set to 10 s between the loading and unloading motions. All measurements were conducted at a chamber temperature of 27.0°C, with a room temperature of 22°C, and approximately 65% humidity. In order to minimize errors due to surface roughness, five smooth parts of the bone surface were chosen based on one view seen in the Charge Coupled Device camera, and to avoid any influence of the adjacent indentations, the distance between the indentations was set at greater than 25 µm.
Immediately after the measurement, the indentations were photographed under a microscope. The elastic modulus (E) was calculated from the unloading curve of the load-displacement curve using a standard unloading analysis procedure defined by the following equation
where S is the contact stiffness calculated as the slope of the unloading, and A is the projected area of the indenter tip as a function of the contact depth [19].
Based on the linear correlation obtained from the phantom calibration, the CT number (pixel intensity) of each pixel was converted to BMD, and a one-to-one relationship was established between each indentation and BMD.
Superimposing NI pictures on µCT images
One µCT image that matched with the optical microscopic photograph of the indented surface was selected. The surface photograph with indentations, improved in transparency using image processing software, was superimposed on the µCT image by means of the ivory references (Figure 2a). The µCT image was then replaced by a colored CT number map (Figure 2b), which could determine the CT number that was indicated for a voxel nearest to each indentation (Figure 2c). For each ROI of nine samples, a total of 90 indents were used for the analysis.
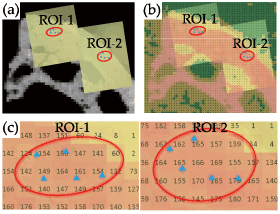
Figure 2. Microscopic and μCT images of an indented bone surface. (a) Optical microscopic images (yellow rectangles) of ROIs-1 and 2 (red circles) were superimposed on the μCT image of the same region. (b) The same microscopic images as shown in (a) were superimposed on a colored CT number map. (c) Enlarged view of (b). Each indent (blue dot) is represented by a nearest CT number that is contained in a pixel box
Laser microscope and scanning electron microscopy
After completing the NI test, all the indented surfaces were photographed using a laser microscope (LEXT OLS4000; Olympus, Tokyo, Japan). The specimens were sputter-coated with platinum by Ion Sputter (E102; Hitachi, Tokyo, Japan), and the microstructures of the indentations were observed by scanning electron microscopy (SEM) (S-4500; Hitachi, Tokyo, Japan) to confirm bone surface microstructures.
Statistical analyses
The correlation between BMD and Young's modulus was analyzed using regression analysis for each ROI of each mouse. The regression analysis was performed by the power function E=αρβ (E: Young's modulus [GPa], ρ: BMD [g/cm3]) [23-25]. To compare the differences in BMD and Young's modulus between the two ROIs, Mann-Whitney’s U-test was performed, with a significance level set at α=0.05. To compare the difference in BMD and the Young's modulus, the Kruskal-Wallis test was performed along with the Mann-Whitney U-test, with a significance level set at α=0.05. The data are presented as the averages±standard deviation (SPSS ver. 24 for Windows; IBM, Armonk, NY, USA).
Results
There was no significant difference in the average BMD between ROI-1 (1.27±0.13 g/cm3) and ROI-2 (1.38±0.13 g/cm3) for all mice, while the average Young's modulus of ROI-1 (19.38±3.49 GPa) was significantly lower than that of ROI-2 (28.91±5.06 GPa) (p<0.05) (Figure 3). In contrast to the homogeneous bone structures in ROI-2 (Figure 4), the Haversian system in the mouse maxillary bone [26] was used to categorize the bone structures of ROI-1 into three subgroups: surfaces containing Haversian lamella around a Haversian canal (Hav), surfaces featuring the interstitial lamella between Haversian lamellae (Int), or surfaces showing mixtures of Haversian and interstitial lamella (Mix). There was no significant difference in the average BMD among Hav (1.26±0.04 g/cm3), Int (1.27±0.04 g/cm3), and Mix (1.28±0.20 g/cm3) (p<0.05) (Figure 3). While, the average modulus was significantly higher in Hav (20.94±2.32 GPa) than in Int (17.16±1.96 GPa) (p<0.05) (Table 1).
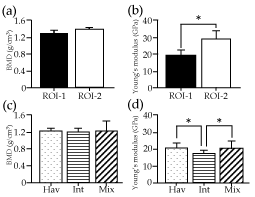
Figure 3. Bone mineral density (BMD) and Young's modulus. Average BMD in g/cm3 (a and c) derived from computed tomography (CT) numbers and Young's modulus in GPa (b and d) measured by the nano-indentation method are shown by ROIs (a and b) and subgroups of ROI-1 (c and d), with vertical bars indicating standard deviation. Asterisks represent statistically significant differences (p<0.05). Subgroups Hav, Int, Mix were categorized based on dominant bone structures observed around indentations of ROI-1
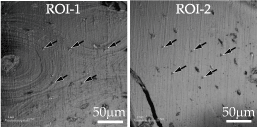
Figure 4. The bone surfaces. Laser micrographic images of ROI-1 (left) and ROI-2 (right), with arrows indicating the indentations
Table 1. Average Young's modulus (GPa) and BMD (g/cm3) for each mouse
Mouse number |
ROI-1 |
ROI-2 |
BMD (g/cm3) (SD) |
Young's modulus (GPa) (SD) |
BMD (g/cm3) (SD) |
Young's modulus (GPa) (SD) |
1 |
1.33 (0.04) |
20.16 (2.87) |
1.10 (0.05) |
18.31 (1.41) |
2 |
1.00 (0.11) |
16.45 (2.04) |
1.30 (0.04) |
29.97 (2.09) |
3 |
1.51 (0.04) |
22.64 (0.93) |
1.52 (0.03) |
28.26 (1.96) |
4 |
1.30 (0.03) |
16.41 (2.43) |
1.44 (0.09) |
28.38 (2.10) |
5 |
1.25 (0.04) |
18.26 (3.35) |
1.40 (0.06) |
32.10 (4.52) |
6 |
1.27 (0.04) |
24.86 (4.15) |
1.36 (0.06) |
29.76 (1.98) |
7 |
1.22 (0.02) |
21.46 (2.04) |
1.50 (0.03) |
32.49 (1.07) |
8 |
1.26 (0.01) |
18.69 (2.09) |
1.42 (0.02) |
37.29 (1.63) |
9 |
1.28 (0.02) |
18.55 (1.81) |
1.41 (0.04) |
30.40 (1.99) |
The relationship between BMD and Young’s modulus is shown for both ROIs of all samples in Figure 5. The power regression model fit relatively well for ROI-2 (R2=0.661, p=0.013), while the curve did not fit well for ROI-1 (R2=0.256, p=0.163). There were some lamellar structures centered on the Haversian canal at the indentation site of ROI-1 (Figure 4), while a relatively homogeneous surface was seen on the indentation sites of ROI-2 in laser microscope images (Figure 4). A representative SEM image of the indented bone surfaces is shown in Figure 6. The bone surface of ROI-2 (left) was structurally more homogeneous than that of ROI-1 (right), which contained pores on the surface. The SEM images indicated that the average diameter of the indents was larger in ROI-1 (approximately 4.57 µm±0.45 µm) than in ROI-2 (approximately 3.98 µm±0.35 µm).
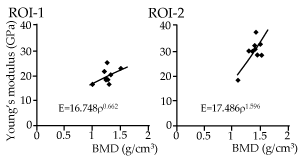
Figure 5. Relationship between average Young's modulus and BMD for all animals. Each dot represents average data for one animal sample, with a regression line for each ROI
Discussion
The BMD values obtained from the μCT images of the mouse maxilla ranged from 0.83 g/cm3 to 1.55 g/cm3, which were considerably larger than values of the previous data, which ranged from 0.12 g/cm3 to 1.00 g/cm3 for the same strain of mice, C57BL/6J mice [27-30]. This might be partly attributed to the difference in the targeted bones, which could be a key factor determining the BMD values in mice [31]. Spinal [29], tibia [28], and femoral bones [27,29,30] have been used in previous studies, while the maxillary bone was used in the present study. Technical factors, including the scanner type, voltage, and kernel [32], can also affect the magnitude of the CT numbers in μCT and quantitative computed tomography (QCT) images; thus, this could cause the large discrepancy in BMD values between the previous and present studies [8].
Young’s modulus, as measured by NI test in this study, was in the range of 13.32 GPa to 38.15 GPa, which was similar to or slightly higher than the moduli determined in previous NI studies that measured the tibia and femurs of mice [33-37] (Table 2). It has been indicated that the bone elastic modulus obtained from NI was generally lower under wet conditions than in the dry state [36,38-40]. However, in the previous studies, the samples were first dried, followed by rehydration, after at least 24 hours of immersion in various solutions, such as 3.7% formaldehyde, 4% paraformaldehyde, Ringer’s solution, and ethanol. In this study, the measurements were conducted 2 hours after sacrifice and stored without immersion in these solutions to minimize potential changes, such as degeneration and drying of the bone tissue. Because of the shorter storage time, the bone samples in this study were likely to be maintained in a relatively wet condition closer to the condition of living tissues. Previous data obtained from conventional three-point or four-point bending methods cannot be compared with the results of this study. Those test methods were used to measure the bulk bone, including the porous structure, resulting in a modulus approximately five times lower than the results obtained by NI [20,41].
Table 2. Young’s moduli measured by nano-indentation (NI) and experimental conditions in the present and previous studies
Study |
Modulus |
Condition |
Anatomical site |
Sex |
Age |
Jiao et al., 2007 |
21-32 GPa |
dry |
Tibia |
Female |
4 months |
Middleton et al., 2010 |
30-33 GPa |
dry |
Femur |
Not specified |
171-177 days |
Miller et al., 2007 |
> 20 GPa |
dry |
Tibia |
Female |
Not specified |
Rodriguez|-Florez et al., 2013 |
11.5 GPa |
wet |
Tibia |
Female |
9 weeks |
20.1-22.9 GPa |
dry |
Silva et al., 2004 |
29.5-32.1 GPa |
dry |
Femur |
Not specified |
4 month |
31.4-33.7 GPa |
dry |
Femur |
6 months |
27.8-29.9 GPa |
dry |
Tibia |
4 months |
30.8-33.1 GPa |
dry |
Tibia |
6 months |
Present study |
13.32-38.15 GPa |
wet |
Maxilla |
Male |
17 weeks |
The present study employed the method of Oliver and Pharr to calculate Young's modulus by using data obtained from NI measurements [19]. The method is suitable for determining the relative difference in elastic modulus between samples [36]. To enhance a model solution without errors and incomplete convergence, most of the mathematical models require a single number modulus for each model element without using a non-linear equation representing such as viscoelastic properties. Therefore, the use of the Oliver and Pharr to method was reasonable for the purpose of this study, as compared with other methods including viscoelasticity-plasticity analysis for estimating the elastic, plastic, and viscous properties, and that can be used to analyze the creep behavior of bone [36].
In our study, the average Young's modulus of ROI-1 was lower than that of ROI-2 (Figure 3), probably because the surface characteristics of the former were less homogeneous, with more defects, than the latter regions (Figure 6). In ROI-1, non-homogeneous surfaces with numerous small pores were observed in the Haversian lamella and interstitial lamella, but these were absent from ROI-2. The larger diameter of the indents measured in ROI-1, as compared to those in ROI-2, was in agreement with a previous study, which indicated that the pores in the indent-surface interaction zone softened the structure and decreased the indentation modulus [42].
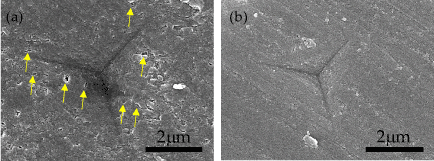
Figure 6. Indented bone surfaces. Scanning electron microscopy images were obtained from representative bone surfaces at ROI-1 (a) and ROI-2 (b). Yellow arrows indicate small pores
The relatively higher coefficient of determination (R2) for the relationship between the modulus and the BMD of ROI-2 might be more closely associated with homogeneous bone structures without the mixed appearance of the Haversian system and the interstitial lamella containing small pores, such as seen in ROI-1. The lower R2 of ROI-1 might also be attributed to the fact that Young’s modulus varied depending on the mixed micro-structures at each indentation, while these site-dependent characteristics were not reflected in the CT number that was averaged for each voxel. In fact, the three different surface appearances (Hav, Int, and Mix) in the sectioned surfaces of ROI-1 might have caused a relatively large SD for Young's modulus of ROI-1. The analysis of subgroups in ROI-1 indicated that the average modulus was higher in the area dominated by Haversian lamellae than in the area containing predominantly interstitial lamellae (Figure 3), which did not coincide with the result of a previous study of the horse femur bone [41]. Although the classification of this study was proposed to distinguish the Haversian lamellae from the interstitial lamellae, one indent was occasionally found to extend over several lamellae or was performed at a site between two lamellae, suggesting that it was not possible to compare Young's modulus of each bone lamellar structure with dimensions of less than 10 μm by the NI used in this study (with approximately 4-5 μm indent diameter). Also, like the structure of the Haversian lamellae, Young’s modulus might be affected by the bone anisotropy. In ROI-1, the larger SD values of the modulus might contribute to the relatively low R2 for the relationship between the modulus and BMD.
The result of this study indicated that there was no difference in the average BMD values among the three subgroups of ROI-1 (Figure 3). This was not expected, because there was clearly a hierarchical structure in the bone, with marked variation in scale, such as the Haversian lamella and Haversian canal of 100-200 µm, the bone lamella of 3-7 µm, and mineralized collagen fibrils of less than 1 µm [43,44]. Thus, the complex microstructures of the bone did not affect BMD magnitudes for small segments, because the effects of the bone lamella and the small porosities were not reflected by the partial volume effect of the 20.1-µm voxels in the CT numbers of this study. In future, increased image quality with smaller voxels for each image segment would make it possible to distinguish the CT numbers of different bone microstructures [45].
The relationship between Young's modulus and BMD has been proposed previously, although the proposed equations varied markedly [7,46]. The present study used a form of power function that had been proposed for estimating Young's modulus of the human femur and tibia [47,48], given its ability to reveal a higher coefficient of determination (R2) than linear functions [23]. Figure 7 shows the modulus as a function of the BMD based on ROI-2 of this study for a BMD range of 0.8 g/cm3 to 1.6 g/cm3, along with other curves that were created using conversion formulae proposed in previous studies [23-25] (Table 3). The coefficient α in an equation E=αρβ represents the site- and object-specific parameter, while β affects the curvature of the function. The parameter α of this study was relatively larger than those of the other studies, while the parameter β was smaller for the equation of this study compared with the previous studies. This means that the regression equation of the ROI-2 data estimates a higher Young's modulus than the previous equations in a relatively small BMD, while it estimates values closer to those obtained from the other previous formulas for a higher BMD. The differences in the α and β parameters between the previous studies and the current study might be attributed to the use of human [23-25] or bovine bones [24], rather than the mouse maxilla used in this study. The BMD values in some studies were not derived from CT data [23,24]. Other factors that could lead to differences are the spatial resolution of CT, which was considerably different from that of the current study [25]. Furthermore, the Young's moduli were measured using bone block specimens containing porous structures in the previous studies, which could lead to lower moduli compared to the NI measurements, resulting in the difference in the values of α and β between the present and previous studies. However, it was not possible to specify a clear reason for the inconsistency in the equations, because various methodological factors may act synergistically, confounding their effects [7].
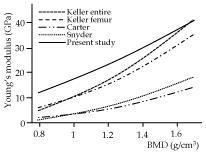
Figure 7. The relationship between bone mineral density (BMD) and Young’s modulus relationship of previous and present studies. Data of ROI-2 were used for the regression curve of the present study. The regression equations of the previous studies are also listed in Table 3
Table 3. Formula to estimate Young's modulus from BMD reported in previous and present studies
Source |
Equation |
Density |
R2 |
Bone |
Type of bone |
Carter and Hayes, 1977 |
E=3.79?0.06ρ3 |
0.07-2.00 |
NR |
Human tibia and bovine femoral condyle |
Cortical and trabecular |
Snyder and Schneider, 1991 |
E=3.891ρ2.39 |
1.748-1.952 |
r=0.75a |
Human tibial diaphysis |
Cortical |
Keller entire, 1994 |
E=10.5ρ2.57 |
0.028-1.221 |
0.965 |
Human femur |
Cortical and trabecular |
Keller femur, 1994 |
E=10.5ρ2.29 |
0.092-1.221 |
0.849 |
Human femur |
Cortical and trabecular |
Present study (ROI-2) |
E=17.486ρ1.596 |
1.027-1.559 |
0.611 |
Murine maxilla |
Cortical |
Young’s modulus (E) in GPa and BMD (ρ) in g/cm3; R2: Coefficient of determination; NR: Not reported; a: Pearson correlation coefficient, as reported in the original work; ??: a strain rate (per second)
The results of this study indicated a relatively low (ROI-1) or intermediate (ROI-2) correlation between the CT-derived BMD and Young's modulus as measured by the NI method at localized regions in the mouse maxilla, which was partly due to the low resolution of the current µCT technology, which does not capture non-homogeneous bone microstructures. On the other hand, the content of organic components of the bone, such as collagen fibers [14,49], in addition to the degree of bone mineralization and the mineral crystal properties of the bone could act as additional factors strongly influencing Young’s modulus of the bone [50,51]. Since all these factors are not included in the CT-based image data, in future, combined diagnostic image data and biological examination should be used to develop a precise estimation of Young's modulus in the clinical diagnosis for dental and craniofacial surgeries. The results of the present study suggested that estimation of Young's modulus by using CT-based BMD is limited when data are based solely on CT numbers.
Conclusion
A moderately high correlation was found between CT-derived BMD and NI-measured Young's modulus of homogeneous bone structures in the mouse maxillary bone; the correlation was weak at regions where the Haversian system was present in the non-homogeneous bone structures. The results indicated that the resolution capability of the current µCT could not reflect the non-homogeneous bone microstructures on the CT numbers, suggesting that a more precise estimation of Young's modulus at specific bone structure sites requires further technological improvements in addition to the biological information of the patients.
Acknowledgments
The authors would like to thank Shizuko Ichinose, Yusuke Tsutsumi, Masako Akiyama, Yo Shibata and Hidenori Hamba for their valuable comments and techniques regarding this study.
Funding
This work was supported by JSPS grants from KAKENHI to N.S. (No. 16K20486) and K.A. (Nos. 23659867 and 25293377). The co-authors affiliated with Brno University of Technology were funded by the Czech Science Foundation (grant No. 16-08944S).
Competing interest
All authors state that they have no conflicts of interest.
References
- Fu MW, Fu E, Lin FG, Chang WJ, Hsieh YD, et al. (2017) Correlation Between Resonance Frequency Analysis and Bone Quality Assessments at Dental Implant Recipient Sites. Int J Oral Maxillofac Implants 32: 180-187. [Crossref]
- Li K, Xin H, Zhao Y, Zhang Z, Wu Y (2016) Remodeling of the Mandibular Bone Induced by Overdentures Supported by Different Numbers of Implants. J Biomech Eng 138: 051003. [Crossref]
- Rakhmatia YD, Ayukawa Y, Jinno Y, Furuhashi A, Koyano K (2017) Micro-computed tomography analysis of early stage bone healing using micro-porous titanium mesh for guided bone regeneration: preliminary experiment in a canine model. Odontology 105: 408-417.
- Yoda N, Zheng K, Chen J, Li W, Swain M, et al. (2017) Bone morphological effects on post-implantation remodeling of maxillary anterior buccal bone: A clinical and biomechanical study. J Prosthodont Res 61: 393-402. [Crossref]
- Wen H, Guo W, Liang R, Xiang L, Long G, et al. (2014) Finite element analysis of three zygomatic implant techniques for the severely atrophic edentulous maxilla. J Prosthet Dent 111: 203-215.
- Miyamoto S, Ujigawa K, Kizu Y, Tonogi M, Yamane GY (2010) Biomechanical three-dimensional finite-element analysis of maxillary prostheses with implants. Design of number and position of implants for maxillary prostheses after hemimaxillectomy. Int J Oral Maxillofac Surg 39: 1120-1126.
- Helgason B, Perilli E, Schileo E, Taddei F, Brynjolfsson S, et al. (2008) Mathematical relationships between bone density and mechanical properties: a literature review. Clin Biomech (Bristol, Avon) 23: 135-146.
- Knowles NK, Reeves JM, Ferreira LM (2016) Quantitative computed tomography (QCT)-derived bone mineral density (BMD) in finite element studies: a review of the literature. J Exp Orthop 3: 36.
- Kim YJHenkin J (2015) Micro-computed tomography assessment of human alveolar bone: bone density and three-dimensional micro-architecture. Clin Implant Dent Relat Res 17: 307-313.
- Schreiber JJ, Anderson PA, Rosas HG, Buchholz AL, Au AG (2011) Hounsfield units for assessing bone mineral density and strength: a tool for osteoporosis management. J Bone Joint Surg Am 93: 1057-1063.
- Moro M, Hecker AT, Bouxsein ML, Myers ER (1995) Failure load of thoracic vertebrae correlates with lumbar bone mineral density measured by DXA. Calcif Tissue Int 56: 206-209.
- Tóth P, Horváth C, Ferencz V, Tóth B, Váradi A, et al. (2013) Bone mineral density (BMD) and computer tomographic measurements of the equine proximal phalanx in correlation with breaking strength. Pol J Vet Sci 16: 3-8. [Crossref]
- Burket JC, Brooks DJ, MacLeay JM, Baker SP, Boskey AL, et al. (2013) Variations in nanomechanical properties and tissue composition within trabeculae from an ovine model of osteoporosis and treatment. Bone 52: 326-336.
- Paschalis EP, Tatakis DN, Robins S, Fratzl P, Manjubala I, et al. (2011) Lathyrism-induced alterations in collagen cross-links influence the mechanical properties of bone material without affecting the mineral. Bone 49: 1232-1241.
- Engelke K, Libanati C, Fuerst T, Zysset P, Genant HK (2013) Advanced CT based in vivo methods for the assessment of bone density, structure, and strength. Curr Osteoporos Rep 11: 246-255. [Crossref]
- Poelert S, Valstar E, Weinans H, Zadpoor AA (2013) Patient-specific finite element modeling of bones. Proc Inst Mech Eng H 227: 464-478. [Crossref]
- Helgason B, Gilchrist S, Ariza O, Vogt P, Enns-Bray W, et al. (2016) The influence of the modulus-density relationship and the material mapping method on the simulated mechanical response of the proximal femur in side-ways fall loading configuration. Med Eng Phys 38: 679-689.
- Choi AH, Conway RC, Ben-Nissan B (2014) Finite-element modeling and analysis in nanomedicine and dentistry. Nanomedicine (Lond) 9: 1681-1695. [Crossref]
- Oliver WCPharr GM (1992) An improved technique for determining hardness and elastic modulus using load and displacement sensing indentation. J Mater Res 7: 1564-1583.
- Saito H, Kojima T, Takahashi M, Horne WC, Baron R, et al. (2007) A tumor necrosis factor receptor loop peptide mimic inhibits bone destruction to the same extent as anti-tumor necrosis factor monoclonal antibody in murine collagen-induced arthritis. Arthritis Rheum 56: 1164-1174.
- Fujiki K, Aoki K, Marcian P, Borak L, Hudieb M, et al. (2013) The influence of mechanical stimulation on osteoclast localization in the mouse maxilla: bone histomorphometry and finite element analysis. Biomech Model Mechanobiol 12: 325-333.
- Suzuki N, Aoki K, Marcian P, Borak L, Wakabayashi N (2016) A threshold of mechanical strain intensity for the direct activation of osteoblast function exists in a murine maxilla loading model. Biomech Model Mechanobiol 15: 1091-1100.
- Keller TS (1994) Predicting the compressive mechanical behavior of bone. J Biomech 27: 1159-1168. [Crossref]
- Carter DR, Hayes WC (1977) The compressive behavior of bone as a two-phase porous structure. J Bone Joint Surg Am 59: 954-962. [Crossref]
- Snyder SM, Schneider E (1991) Estimation of mechanical properties of cortical bone by computed tomography. J Orthop Res 9: 422-431. [Crossref]
- . Šarocká A, Ramona Babosová VK, Šranko P, Omelka R, Kapusta E, et al. (2016) The effect of subacute exposure to acrylamide on femoral bone microstructure in laboratory mice. Pol J Environ Stud 25: 2711-2715.
- Peng J, Lai ZG, Fang ZL, Xing S, Hui K, et al. (2014) Dimethyloxalylglycine prevents bone loss in ovariectomized C57BL/6J mice through enhanced angiogenesis and osteogenesis. PLoS One 9: e112744.
- Kang KY, Kang Y, Kim M, Kim Y, Yi H, et al. (2013) The effects of antihypertensive drugs on bone mineral density in ovariectomized mice. J Korean Med Sci 28: 1139-1144.
- Aslam MN, Bergin I, Jepsen K, Kreider JM, Graf KH, et al. (2013) Preservation of bone structure and function by Lithothamnion sp. derived minerals. Biol Trace Elem Res 156: 210-220. [Crossref]
- Chen SY, Yu HT, Kao JP, Yang CC, Chiang SS, et al. (2014) An NMR metabolomic study on the effect of alendronate in ovariectomized mice. PLoS One 9: e106559. [Crossref]
- Yang S, Hollister AM, Orchard EA, Chaudhery SI, Ostanin DV, et al. (2013) Quantification of bone changes in a collagen-induced arthritis mouse model by reconstructed three dimensional micro-CT. Biol Proced Online 15: 8.
- Giambini H, Dragomir-Daescu D, Huddleston PM, Camp JJ, An KN, et al. (2015) The effect of quantitative computed tomography acquisition protocols on bone mineral density estimation. J Biomech Eng 137: 114502.
- Jiao Y, Chiu H, Fan Z, Jiao F, Eckstein EC, et al. (2007) Quantitative trait loci that determine mouse tibial nanoindentation properties in an F2 population derived from C57BL/6J x C3H/HeJ. Calcif Tissue Int 80: 383-390.
- Miller LM, Little W, Schirmer A, Sheik F, Busa B, et al. (2007) Accretion of bone quantity and quality in the developing mouse skeleton. J Bone Miner Res 22: 1037-1045. [Crossref]
- Middleton KM, Goldstein BD, Guduru PR, Waters JF, Kelly SA, et al. (2010) Variation in within-bone stiffness measured by nanoindentation in mice bred for high levels of voluntary wheel running. J Anat 216: 121-131.
- Rodriguez-Florez N1, Oyen ML, Shefelbine SJ (2013) Insight into differences in nanoindentation properties of bone. J Mech Behav Biomed Mater 18: 90-99. [Crossref]
- Silva MJ, Brodt MD, Fan Z, Rho JY (2004) Nanoindentation and whole-bone bending estimates of material properties in bones from the senescence accelerated mouse SAMP6. J Biomech 37: 1639-1646.
- Wolfram U, Wilke HJ, Zysset PK (2010) Valid micro finite element models of vertebral trabecular bone can be obtained using tissue properties measured with nanoindentation under wet conditions. J Biomech 43: 1731-1737.
- Hoffler CE, Guo XE, Zysset PK, Goldstein SA (2005) An application of nanoindentation technique to measure bone tissue lamellae properties. J Biomech Eng 127: 1046-1053.
- Faingold A, Cohen SR, Shahar R, Weiner S, Rapoport L, et al. (2014) The effect of hydration on mechanical anisotropy, topography and fibril organization of the osteonal lamellae. J Biomech 47: 367-372.
- Rho JY, Currey JD, Zioupos P, Pharr GM (2001) The anisotropic Young's modulus of equine secondary osteones and interstitial bone determined by nanoindentation. J Exp Biol 204: 1775-1781.
- Spiesz EM, Reisinger AG, Kaminsky W, Roschger P, Pahr DH, et al. (2013) Computational and experimental methodology for site-matched investigations of the influence of mineral mass fraction and collagen orientation on the axial indentation modulus of lamellar bone. J Mech Behav Biomed Mater 28: 195-205.
- Zimmermann EA, Gludovatz B, Schaible E, Busse B, Ritchie RO (2014) Fracture resistance of human cortical bone across multiple length-scales at physiological strain rates. Biomaterials 35: 5472-5481.
- Poundarik AA, Diab T, Sroga GE, Ural A, Boskey AL, et al. (2012) Dilatational band formation in bone. Proc Natl Acad Sci U S A 109: 19178-19183. [Crossref]
- Mashiatulla M, Ross RD, Sumner DR (2017) Validation of cortical bone mineral density distribution using micro-computed tomography. Bone 99: 53-61.
- Morgan EF, Bayraktar HH, Keaveny TM (2003) Trabecular bone modulus-density relationships depend on anatomic site. J Biomech 36: 897-904. [Crossref]
- Eberle S, Göttlinger M, Augat P (2013) Individual density-elasticity relationships improve accuracy of subject-specific finite element models of human femurs. J Biomech 46: 2152-2157.
- Keyak JH, Rossi SA, Jones KA, Skinner HB (1998) Prediction of femoral fracture load using automated finite element modeling. J Biomech 31: 125-133.
- Alliston T (2014) Biological regulation of bone quality. Curr Osteoporos Rep 12: 366-375. [Crossref]
- Felsenberg DBoonen S (2005) The bone quality framework: determinants of bone strength and their interrelationships, and implications for osteoporosis management. Clin Ther 27: 1-11.
- Katsamenis OL, Chong HM, Andriotis OG, Thurner PJ (2013) Load-bearing in cortical bone microstructure: Selective stiffening and heterogeneous strain distribution at the lamellar level. J Mech Behav Biomed Mater 17: 152-165.


