Abstract
Background: In this retrospective study, we investigated nutritional status and liver steatosis after direct-acting antiviral (DAA) treatment for chronic hepatitis C virus (HCV) infection.
Methods: One-hundred six patients with chronic HCV infection underwent HCV-RNA testing 12 weeks after the end of treatment (EOT) with DAAs from September 2014 to August 2016. HCV genotype 1 patients received daclatasvir and asunaprevir (DCV/ASV, n=35) or sofosbuvir and ledipasvir (SOF/LDV, n=37); HCV genotype 2 patients received sofosbuvir and ribavirin (SOF/RBV, n=34). After DAA treatment, virologic response, biochemical and serological marker levels, and side effects were assessed. Nutritional status was evaluated using serum albumin (Alb), triglyceride (TG), total cholesterol (TC), and low-density lipoprotein cholesterol (LDL-C) levels. Liver stiffness (LS) and controlled attenuation parameter (CAP) values were measured for the diagnosis of liver fibrosis and steatosis using transient elastography.
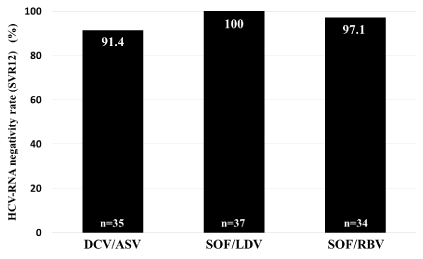
Results: HCV-RNA became undetectable in 32 patients who received DCV/ASV (91.4%), in 37 who received SOF/LDV (100%), and in 33 who received SOF/RBV (97.1%). Mild anemia was noted at EOT with SOF/RBV (from 13.6 ± 1.5 to 11.9 ± 1.3 g/dL, p<0.01), but it was improved 12 weeks after EOT (13.6 ± 1.6 g/dL). Alanine aminotransferase decreased from 64.0 ± 68.9 to 16.9 ± 8.3 IU/L, p<0.001; and alpha-fetoprotein from 20.0 ± 77.6 to 4.1 ± 5.2 ng/mL, p<0.001. Alb increased from 4.1 ± 0.5 to 4.3 ± 0.4 g/dL, p<0.001; TG from 111 ± 46 to 128 ± 66 mg/dL, p<0.05; TC from 158 ± 30 to 187 ± 35 mg/dL, p<0.001; and LDL-C from 82 ± 20 to 105 ± 30 mg/dL, p<0.001. LS values decreased from 10.4 ± 6.7 to 7.6 ± 5.0 kPa, p<0.01, and CAP values increased from 213 ± 60 to 226 ± 55 dB/m, p<0.01.
Conclusion: DAA treatment was useful for chronic HCV infection, and the nutritional status improved. However, CAP values increased; thus, long-term follow-up for liver steatosis is necessary.
Key words
direct-acting antiviral treatment, hepatitis C virus infection, liver steatosis, nutritional status
Introduction
Hepatitis C virus (HCV) was first detected in 1989 [1]. Currently, there are 170 million patients infected with HCV worldwide and most patients’ progress from chronic hepatitis to cirrhosis after 10-30 years. Liver cirrhosis evolves to hepatocellular carcinoma (HCC) at a high rate; therefore, it is important to develop effective therapy for HCV infection [2,3].
In Japan, for the treatment of chronic HCV genotype 1 infection, daclatasvir (DCV; NS5B polymerase inhibitor) and asunaprevir (ASV; NS3/4A protease inhibitor) have been suggested as possible interferon (IFN)-free regimens in 2014, and sofosbuvir (SOF; NS5B polymerase inhibitor) and ledipasvir (LDV; NS5A inhibitor) as the second-generation IFN-free regimen in 2015. Moreover, SOF and ribavirin (RBV) have been suggested for the treatment of genotype 2 infection in 2015. Thus, the progress of the treatment for chronic HCV has been remarkable and direct-acting antivirals (DAAs) have become the first-line treatment, because, with DAAs, there are expected sustained virologic response (SVR) rates of over 90%, few side effects, and a shorter treatment duration than with IFN-based treatment [4-6].
At first, HCV infected blood enters the non-infected person’s body; next, the HCV particles bind to low-density lipoprotein (LDL) receptors that are present on the hepatocytes’ surface, and invade the cell. Finally, a viral genome replicates, and a new infectious virion is released extracellularly [7-9].
Recently, two studies reported that a marked increase in serum LDL-cholesterol (LDL-C) occurred in HCV mono-infected or HCV/HIV co-infected patients treated with SOF/RBV or SOF/LDV [10,11]. Hashimoto et al. reported a rapid increase in the serum LDL-C levels during the IFN-free treatment of chronic HCV, and it was associated with the type of DAA treatment [12]. However, the change in LDL-C levels after SVR by DAA treatment for chronic HCV in the medium- or long-term is unclear.
Generally, the degree of liver fibrosis and steatosis have been evaluated by liver biopsy, an invasive method; thus, a noninvasive tool is still required. Recently, transient elastography was used as a noninvasive tool for the evaluation of liver fibrosis and steatosis [13-17].
Therefore, in this retrospective study, we investigated the change in nutritional status and liver steatosis after DAA treatment for chronic HCV infection.
Materials and methods
Patients
We retrospectively studied the data of a total of 106 patients with chronic HCV infection who underwent HCV-RNA testing 12 weeks after completing DAA treatment from September 2014 to August 2016 at the National Hospital Organization Nagoya Medical Center.
Treatment regimen
Among the 106 patients, HCV genotype 1 patients received the combination therapy of DCV/ASV (n=35) for 24 weeks, or SOF/LDV (n=37) for 12 weeks; HCV genotype 2 patients received the combination therapy of SOF/RBV (n=34) for 12 weeks.
Laboratory testing
Biochemical and serological markers and HCV-RNA levels were measured at the National Hospital Organization Nagoya Medical Center. Blood samples were evaluated at the initiation of DAA treatment, the end of treatment (EOT), and 12 weeks after EOT. Nutritional status was evaluated using serum albumin (Alb), triglyceride (TG), total cholesterol (TC), and LDL-C levels. HCV-RNA levels were detected by real-time reverse transcriptase PCR assay (COBASⓇ TaqManⓇ HCV Auto, Roche Diagnostics, Tokyo, Japan), with the measurement range of 1.2-7.8 log10 IU/mL. SVR was determined 12 weeks after EOT (SVR12). Ultrasonography, computed tomography, and/or magnetic resonance imaging of the abdomen were used for HCC surveillance.
Transient elastography
Liver stiffness (LS) and controlled attenuation parameter (CAP) were measured using transient elastography (FibroScan 502, Echosens, Paris, France) [15,16]. LS values were measured for diagnosis of liver fibrosis, and expressed in kilopascals (kPa). CAP values were measured for the diagnosis of liver steatosis, and expressed in dB/m [15]. LS and CAP values were measured more than ten times using transient elastography, and the median value was considered the elastic modulus of the liver. Advanced fibrosis was defined as LS value >9.5 kPa [16,17]. Liver steatosis was defined as CAP value ≥222 dB/m [15].
Statistical analysis
All data were expressed as the mean ± standard deviation. Differences were analyzed using Wilcoxon signed-ranks test, and one-way analysis of variance (ANOVA). P-values < 0.05 were considered statistically significant.
This study was approved by the ethical review board in the National Hospital Organization Nagoya Medical Center.
Results
Patient characteristics
The characteristics of the patients at baseline are summarized in Table 1. The mean age of all patients was 64.7 ± 14.1 years. There were 54 men and 52 women. The mean level of HCV-RNA was 5.9 ± 0.8 log10 IU/mL. The mean pretreatment value of TC was 158 ± 30 mg/dL, LDL-C was 82 ± 20 mg/dL, and CAP was 213 ± 60 dB/m.
Characteristics |
Total(n=106) |
DC/ASV(n=35) |
SOF/LDV(n=37) |
SOF/RBV(n=34) |
P-value |
Age |
years |
67.4 ± 14.1 |
65.2 ± 12.3 |
63.5 ± 15.6 |
65.4 ± 14.5 |
0.825 |
Gender |
male/female |
54/52 |
15/20 |
20/17 |
19/15 |
0.499 |
BMI |
kg/m2 |
22.7 ± 3.7 |
22.8 ± 3.0 |
22.5 ± 3.5 |
22.8 ± 4.4 |
0.896 |
HCV RNA |
log10IU/mL |
5.9 ± 0.8 |
6.1 ± 0.7 |
6.0 ± 0.6 |
5.7 ± 1.0 |
0.056 |
total bilirubin |
mg/dL |
0.82 ± 0.37 |
0.76 ± 0.33 |
0.80 ± 0.28 |
0.91 ± 0.46 |
0.223 |
Alb |
g/dL |
4.12 ± 0.46 |
41.3 ± 4.6 |
40.2 ± 0.51 |
4.22 ± 0.40 |
0.214 |
TLC |
/µL |
1710 ± 766 |
1682 ± 766 |
1629 ± 822 |
1827 ± 709 |
0.537 |
CHE |
IU/L |
268 ± 93 |
260 ± 84 |
273 ± 101 |
269 ± 94 |
0.836 |
TC |
mg/dL |
158 ± 30 |
160 ± 32 |
154 ± 28 |
160 ± 31 |
0.636 |
LDL-C |
mg/dL |
28 ± 20 |
83.5 ± 19.6 |
78.4 ± 18.6 |
86.3 ± 25.0 |
0.68 |
TG |
mg/dL |
111 ± 46 |
114 ± 46 |
103 ± 38 |
116 ± 54 |
0.514 |
AST |
IU/L |
58.9 ± 52.1 |
59.4 ± 44.7 |
53.7 ± 35.6 |
64.0 ± 71.8 |
0.707 |
ALT |
IU/L |
64.0 ± 68.9 |
65.5 ± 70.4 |
58.8 ± 49.1 |
68.1 ± 85.5 |
0.843 |
γ-GTP |
IU/L |
58.8 ± 145.8 |
85.9 ± 246.9 |
43.8 ± 38.6 |
47.1 ± 44.7 |
0.407 |
AFP |
ng/mL |
20.0 ± 77.6 |
23.4 ± 82.5 |
8.7 ± 8.7 |
29.1 ± 110.8 |
0.609 |
Hb |
g/dL |
13.6 ± 1.4 |
13.4 ± 1.5 |
13.7 ± 1.3 |
13.6 ± 1.5 |
0.69 |
Platelet |
X 104/mm3 |
17.9 ± 8.6 |
16.2 ± 5.7 |
17.6 ± 6.4 |
19.9 ± 12.3 |
0.193 |
LS |
kPa |
10.4 ± 6.7 |
11.3 ± 6.0 |
10.6 ± 7.90 |
9.3 ± 6.1 |
0.592 |
CAP |
dB/m |
213 ± 60 |
215 ± 50 |
205 ± 41 |
222 ± 85 |
0.617 |
Data are expressed as number or mean ± SD
BMI body mass index, Alb albumin, TLC total lymphocyte count, CHE cholinesterase, TC total cholesterol, LDL-C low-density lipoprotein cholesterol, TG triglyceride, AST aspartate aminotransferase, ALT alanine aminotransferase, γ-GTP gamma glutamyl transpeptidase, AFP alpha-fetoprotein, Hb hemoglobin, LS liver stiffness, CAP controlled attenuation parameter
Table 1. Baseline characteristics of patients
Changes in HCV-related markers
HCV-RNA became undetectable (SVR12) in 32 patients who received DCV/ASV (91.4%), in 37 who received SOF/LDV (100%), and in 33 who received SOF/RBV (97.1%) (Figure 1). Mild anemia was noted at EOT with SOF/RBV (from 13.6 ± 1.5 to 11.9 ± 1.3 g/dL, p<0.01) but the anemia improved 12 weeks after EOT (13.6 ± 1.6 g/dL). Alanine aminotransferase (ALT) levels decreased from 64.0 ± 68.9 to 16.9 ± 8.3 IU/L, p<0.001; gamma glutamyl transpeptidase levels from 58.8 ± 145.8 to 22.5 ± 16.7 IU/L, p<0.001; and alpha-fetoprotein (AFP) levels from 20.0 ± 77.6 to 4.1 ± 5.2 ng/mL, p<0.001.

Figure 1 HCV-RNA negativity rate (SVR12)
DCV/ASV; 91.4%, SOF/LDV; 100%, and SOF/RBV; 97.1%.
Changes in nutritional status
Serum Alb levels increased from 4.1 ± 0.5 to 4.3 ± 0.4 g/dL, p<0.001; TG levels from 111 ± 46 to 128 ± 66 mg/dL, p<0.05; TC levels from 158 ± 30 to 187 ± 35 mg/dL, p<0.001; and LDL-C levels from 82 ± 20 to 105 ± 30 mg/dL, p<0.001 (Table 2).
| |
|
Pre-Treatment |
Post-Treatment |
P-value |
Alb |
g/dL |
4.1*0.5 |
4.3*0.4 |
<0.001 |
TG |
mg/dL |
111*46 |
128*66 |
0.025 |
TC |
mg/dL |
158*30 |
187*35 |
<0.001 |
LDL-C |
mg/dL |
82*20 |
105*30 |
<0.001 |
Table 2. Changes in nutritional status
Changes in LDL-C levels among the DAA treatment
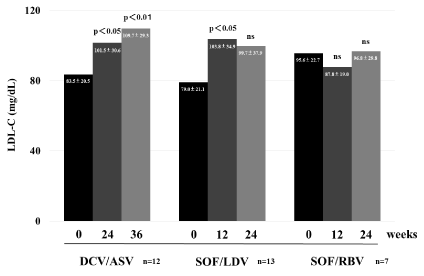
Serum LDL-C levels increased both at EOT with DCV/ASV and 12 weeks after EOT, and at EOT with SOF/LDV. LDL-C levels did not increase either at EOT with SOF/RBV or 12 weeks after EOT (Figure 2).

Figure 2. Changes in LDL-C levels after DAA treatment
Changes in liver fibrosis and steatosis
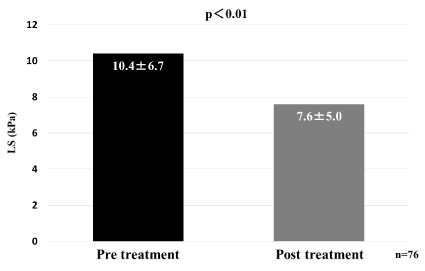
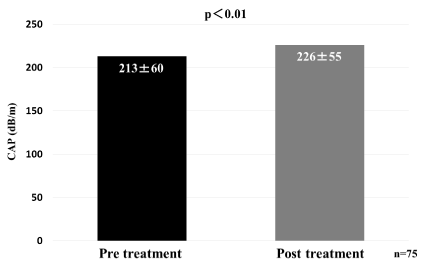
LS values decreased from 10.4 ± 6.7 to 7.6 ± 5.0 kPa, p<0.01 (Figure 3); and CAP values increased from 213 ± 60 to 226 ± 55 dB/m, p<0.01 (Figure 4).

Figure 3. Changes in liver fibrosis (liver stiffness; LS)

Figure 4. Changes in liver steatosis (controlled attenuation parameter; CAP)
Discussion
HCV is classified in genotypes 1-6. In Japan, approximately 70-80% are genotype 1, and 20-30% are genotype 2 [18]. Recently, with the exception of decompensated cirrhosis, DAA treatment has become the first choice of HCV treatment. It was reported that serum ALT and Alb levels improved, AFP levels decreased immediately, and fibrosis markers significantly decreased in SVR patients treated with DCV/ASV [19,20].
In this study, the SVR rate was high (DCV/ASV; 91.4%, SOF/LDV; 100%, and SOF/RBV; 97.1%), liver function showed improvement, and AFP levels decreased. Mild anemia was detected with SOF/RBV treatment at EOT, but it was improved 12 weeks after EOT. Patients did not experience any side effects other than the anemia after SOF/RBV treatment. In a phase III trial for SOF/RBV treatment in Japan, there were no grade 4 side effects, and there were no patient dropouts due to side effects. The frequency of anemia was 27% in the patients over 65 years old, and the decrease in hemoglobin (Hb) level was -1.7 g/dL. When Hb level decreases, appropriate adjustment of RBV dosage is necessary [21]. The -1.7 g/dL reduction in Hb level at EOT in this study was similar to a previous report [21]. There were no serious side effects, and no patient dropouts throughout the duration of DAA treatment. Therefore, DAA treatment was considered an effective and safe treatment for the patients with HCV infection.
HCV exclusion not only improves liver function, but also various kinds of extrahepatic lesions. Actually, nutritional status was improved by viral exclusion, and a decrease in fractures in postmenopausal women has been reported [22]. It was revealed that serum TC, LDL-C, and HDL-C levels were significantly increased considering the SVR of patients treated with DCV/ASV or SOF/LDV [23]. In this study, we focused on the change in the nutritional status after DAA treatment; each nutritional index such as serum Alb, TG, TC, and LDL-C levels were increased. Hashimoto et al. reported the increase of LDL-C and TC levels after DAA treatment for HCV infection in the short-term [12]; these results were similar to our results. Furthermore, they showed that if DAA treatment was different, the kinetics of the increase of LDL-C level was different [12]. In other words, DCV/ASV resulted in a weaker increase in the LDL-C level when compared to SOF/LDV at 28 days from the induction of treatment. They suggested that there are different mechanisms of anti-viral action between DCV/ASV and SOF/LDV. Both DCV and LDV are NS5A inhibitors, ASV is a protease inhibitor, and SOF is a polymerase inhibitor. These mechanisms make a difference in the effect of treatment [24,25]. Serum LDL-C level is directly, rapidly increased by SOF [12]. We evaluated the medium-term change in LDL-C levels; there were fewer changes at EOT with DCV/ASV than with SOF/LDV, but the LDL-C level had a greater increase 12 weeks after EOT with DCV/ASV. SOF/LDV resulted in a greater increased LDL-C level than DCV/ASV at EOT, but it was not increased 12 weeks after EOT. While the change in LDL-C level at EOT with SOF/RBV was decreased, it returned to the level before the treatment 12 weeks after EOT. It is suggested that the anemia due to RBV caused the temporary decrease of LDL-C, because the change in the anemia status and LDL-C level were parallel after the SOF/RBV treatment. We show that there were differences in the change in LDL-C levels when DAA treatment was different. In the future it will be necessary to study the long-term change in the LDL-C level according to the type of DAA treatment.
Liver biopsy has been the most widely used method for the evaluation of liver fibrosis and steatosis; however, it is invasive, and a noninvasive method remains desirable. Recently, transient elastography has been described as a noninvasive tool for the assessment of liver fibrosis and steatosis [13-17]. Transient elastography has been reported to be useful for the prediction of histological examination of the liver biopsy specimen considering the fibrosis stage and the degree of steatosis [26,27]. A meta-analysis concluded that if patients with SVR and higher ALT levels before treatment received DAA treatment rather than IFN-based treatment, the LS level after the treatment significantly decreased [28]. Significant decreases in LS and
ALT
levels after DAA treatment were demonstrated in this study. It was revealed that LS level decreased still more 6 months to 1 year after EOT [28]. This suggested that after inflammation of the liver disappeared, liver fibrosis was improved. Future detailed, long-term studies are anticipated. It was reported that serum TG, TC, and
LDL
-C levels were signific2021 Copyright OAT. All rights reserviver [29]. It was suggested that the increased
CAP
level, along with fatty change in the liver, was the cause of the increased serum TG, TC, and
LDL
-C levels after DAA treatment.
DAA treatment was effective; it improved inflammation, fibrosis, and nutritional status in the patients with HCV infection. However, the onset of non-alcoholic fatty liver disease (NAFLD) or non-alcoholic steatohepatitis (NASH) by increased fatty changes in the liver needs to be paid attention in the future. It is thought that nutritional education will be necessary even if the patients achieve SVR after DAA treatment.
This was a retrospective study at a single institution. In the future, a larger, multicenter prospective study should be performed to confirm our findings.
In conclusion, DAA treatment was useful and safe for patients with chronic HCV infection; furthermore, nutritional status improved. However, long-term follow-up will be necessary because medium-term liver steatosis was observed in this study.
Conflict of interest
The authors declare that they have no conflicts of interest.
References
- Choo QL, Kuo G, Weiner AJ, Overby LR, Bradley DW, et al. (1989) Isolation of a cDNA clone derived from a blood-borne non-A, non-B viral hepatitis genome. Science 244: 359-362. [Crossref]
- Saito I, Miyamura T, Ohbayashi A, Harada H, Katayama T, et al. (1990) Hepatitis C virus infection is associated with the development of hepatocellular carcinoma. Proc Natl Acad Sci U S A 87: 6547-6549. [Crossref]
- Hajarizadeh B, Grebely J, Dore GJ (2013) Epidemiology and natural history of HCV infection. Nat Rev Gastroenterol Hepatol 10: 553-562. [Crossref]
- Kumada H, Suzuki Y, Ikeda K, Toyota J, Karino Y, et al. (2014) Daclatasvir plus asunaprevir for chronic HCV genotype 1b infection. Hepatology 59: 2083-2091. [Crossref]
- Omata M, Nishiguchi S, Ueno Y, Mochizuki H, Izumi N, et al. (2014) Sofosbuvir plus ribavirin in Japanese patients with chronic genotype 2 HCV infection: an open-label, phase 3 trial. J Viral Hepat 21: 762-768. [Crossref]
- Mizokami M, Yokosuka O, Takehara T, Sakamoto N, Korenaga M, et al. (2015) Ledipasvir and sofosbuvir fixed-dose combination with and without ribavirin for 12 weeks in treatment-naïve and previously treated Jalanese patients with genotype 1 hepatitis C: an open-label, randomized, phase 3 trial. Lancet Infect Dis 15: 645-653. [Crossref]
- Agnello V, Abel G, Elfahal M, Knight GB, Zhang QX (1999) Hepatitis C virus and other flaviviridae viruses enter cells via low density lipoprotein receptor. Proc Natl Acad Sci USA 96: 12766-12771. [Crossref]
- André P, Komurian-Pradel F, Deforges S, Perret M, Berland JL, et al. (2002) Characterization of low- and very-low-density hepatitis C virus RNA-containing particles. J Virol 76: 6919-6928. [Crossref]
- Molina S, Castet V, Fournier-Wirth C, Pichard-Garcia L, Avner R, et al. (2007) The low-density lipoprotein receptor plays a role in the infection of primary human hepatocytes by hepatitis C virus. J Hepatol 46: 411-419. [Crossref]
- Meissner EG, Lee YJ, Osinusi A, Qin J, Sturdevant D, et al. (2015) Effect of sofosbuvir and ribavirin treatment on peripheral and hepatic lipid metabolism in chronic HCV, genotype-1 infected patients. Hepatology 61: 790–801. [Crossref]
- Townsend K, Meissner EG, Sidharthan S, Sampson M, Remaley AT, et al. (2016) Interferon-free treatment of hepatitis C virus in HIV/hepatitis C virus-coinfected subjects results in increased serum low-density lipoprotein concentration. AIDS Res Hum Retroviruses 32: 456-462. [Crossref]
- 12. Hashimoto S, Yatsuhashi H, Abiru S, Yamasaki K, Komori A, et al. (2016) Rapid increase in serum low-density lipoprotein cholesterol concentration during hepatitis C interferon-free treatment. PLoS One 11: e0163644. [Crossref]
- Ganne-Carrié N, Ziol M, de Ledinghen V, Douvin C, Marcellin P, et al. (2006) Accuracy of liver stiffness measurement for the diagnosis of cirrhosis in patients with chronic liver diseases. Hepatology 44: 1511-1517. [Crossref]
- Sasso M, Beaugrand M, de Ledinghen V, Douvin C, Marcellin P, et al. (2010) Controlled attenuation parameter (CAP): a novel VCTE guided ultrasonic attenuation measurement for the evaluation of hepatic steatosis: preliminary study and validation in a cohort of patients with chronic liver disease from various causes. Ultrasound Med Biol 36: 1825–1835. [Crossref]
- Sasso M, Tengher-Barna I, Ziol M, Miette V, Fournier C, et al. (2012) Novel controlled attenuation parameter for noninvasive assessment of steatosis using Fibroscan((R)): validation in chronic hepatitis C. J Viral Hepat 19: 244–253. [Crossref]
- Castera L, Vergniol J, Foucher J, Le Bail B, Chanteloup E, et al. (2005) Prospective comparison of transient elastography, Fibrotest, APRI, and liver biopsy for the assessment of fibrosis in chronic hepatitis C. Gastroenterology 128: 343–350. [Crossref]
- Tsochatzis EA, Gurusamy KS, Ntaoula S, Cholongitas E, Davidson BR, et al. (2011) Elastography for the diagnosis of severity of fibrosis in chronic liver disease: a meta-analysis of diagnostic accuracy. J Hepatol 54: 650-659. [Crossref]
- Sievert W, Altraif I, Razavi HA, Abdo A, Ahmed EA, et al. (2011) A systematic review of hepatitis C virus epidemiology in Asia, Australia and Egypt. Liver Int 31 Suppl 2: 61-80. [Crossref]
- Miyaki E, Imamura M, Hiraga N, Murakami E, Kawaoka T, et al. (2016) Daclatasvir and asunaprevir treatment improves liver function parameters and reduces liver fibrosis markers in chronic hepatitis C patients. Hepatol Res 46: 758-764. [Crossref]
- Ishigami M, Hayashi K, Honda T, Kuzuya T, Ishizu Y, et al. (2017) Daclatasvir and asunaprevir treatment in patients with severe liver fibrosis by HCV genotype 1b infection: Real world data. J Gastroenterol Hepatol . [Crossref]
- Omata M, Nishiguchi S, Ueno Y, Mochizuki H, Izumi N, et al. (2014) Sofosbuvir plus ribavirin in Japanese patients with chronic genotype 2 HCV infection: an open-label, phase 3 trial. J Viral Hepat 21: 762-768. [Crossref]
- Arase Y, Suzuki F, Suzuki Y, Akuta N, Kobayashi M, et al. (2010) Virus clearance reduces bone fracture in postmenopausal women with osteoporosis and chronic liver disease caused by hepatitis C virus. J Med Virol 82: 390-395. [Crossref]
- Endo D, Satoh K, Shimada N, Hokari A, Aizawa Y (2017) Impact of interferon-free antivirus therapy on lipid profiles in patients with chronic hepatitis C genotype 1b. World J Gastroenterol 23: 2355-2364. [Crossref]
- Kumada H, Suzuki Y, Ikeda K, Toyota J, Karino Y, et al. (2014) Daclatasvir plus asunaprevir for chronic HCV genotype 1b infection. Hepatology 59: 2083-2091. [Crossref]
- Mizokami M, Yokosuka O, Takehara T, Sakamoto N, Korenaga M, et al. (2015) Ledipasvir and sofosbuvir fixed-dose combination with and without ribavirin for 12 weeks in treatment-naive and previously treated Japanese patients with genotype 1 hepatitis C: an open-label, randomised, phase 3 trial. Lancet Infect Dis 15: 645-653. [Crossref]
- Kirk GD, Astemborski J, Mehta SH, Spoler C, Fisher C, et al. (2009) Assessment of liver fibrosis by transient elastography in persons with hepatitis C virus infection or HIV-hepatitis C virus coinfection. Clin Infect Dis 48: 963-972. [Crossref]
- Sheta T, Zalata K, El-Desoky AAE (2016) Noninvasive diagnosis of hepatic steatosis with controlled attenuation parameter (FibroScan) in chronic hepatitis C patients. Benha Medical Journal 33: 116-124.
- Singh S, Facciorusso A, Loomba R, Falck-Ytter YT (2017) Magnitude and kinetics of decrease in liver stiffness after anti-viral therapy in patients with chronic hepatitis C: a systematic review and meta-analysis. Clin Gastroenterol Hepatol S1542-3565: 30532-30533. [Crossref]
- Hosoyamada K, Uto H, Imamura Y, Hiramine Y, Toyokura E, et al. (2012) Fatty liver in men is associated with high serum levels of small, dense low-density lipoprotein cholesterol. Diabetol Metab Syndr 4: 34.


