Biofilm formation on the surfaces of biomaterials can cause severe infectious diseases due to of inefficiency of antibiotics against biofilm-protected pathogens. On one hand, the prevention of biofilm formation is a critical issue in the development of biomaterials. On the other hand, biomaterials require biological compatibility. To achieve these two goals without compromising the original features of the biomaterial, we proposed metal nanoparticle (NP)-dispersed alkylalkoxysilane (AAS) coatings. Here, we chose nickel, molybdenum, and tungsten, components of stainless steel and other alloys for biomaterials, as prospective metals that could regulate biofilm formation without harming human health. To the best of our knowledge, this is the first report to describe the effect of tungsten on biofilm formation. We performed a biofilm formation test using an open laboratory biofilm reactor that utilizes tap water and environmental bacteria from the laboratory air, and we also performed a cytotoxicity test on the human monocyte-derived U937 cell line. Compared with the AAS polymer alone, nickel NP-dispersed AAS polymer exhibited an inhibitory activity against biofilm formation whereas tungsten and molybdenum NP-dispersed AAS polymers facilitated biofilm formation. The effect of tungsten was dose-dependent. At a low metal concentration (0.1 mol%), the NP-dispersed AAS polymers did not affect cell survival. These results showed that for nickel, molybdenum, and tungsten, the NP-dispersed AAS polymers exhibited biosafety and that the nickel NP-dispersed AAS polymer is suitable for inhibiting biofilm formation. To determine whether molybdenum (or tungsten) NP-dispersed AAS polymer is suitable for biomaterial application, further evaluation in an environment that mimics the human body with clinically relevant pathogens is necessary.
biofilm, cytotoxicity, molybdenum, tungsten, nickel, silane-based polymer
Bacterial contamination sometimes causes severe infectious diseases when an invasive medical device, such as catheter or artificial bone, is inserted or transplanted into a patient. For example, 10-30% of patients with bladder catheters suffer from infection every year in the US [1]. Antibiotics and biocides are therapeutically used to inhibit bacterial growth; however, they are hardly effective against biofilms, thus presenting serious problems in the medical field [2].
A biofilm is defined as an architectural complex of aggregated microorganisms and extracellular polymeric substrates (EPSs) produced by the microorganisms [3]. Biofilm development can be divided into four processes: conditioning film formation, irreversible attachment of bacteria, growing bacteria and secreting EPSs, and dispersion (https://www.cs.montana.edu/webworks/projects/stevesbook/index.html). Conditioning film formation is the initial state of biofilm development and enhances bacterial attachment to the material surfaces. Bacteria usually exist in a planktonic state or attached sate, and the latter is the most relevant to biofilm formation. When bacteria irreversibly attach to the surface of materials, their metabolism changes to become more suitable for an aggregated community. Then, bacteria proliferate and secrete EPSs to form a mature biofilm. Some populations of bacteria forming a biofilm can detach from the biofilm, disperse, and swim, occasionally finding other environments where they can attach and grow.
In general, bacteria with biofilm phenotype are insensitive to antibiotics by 10- to 1,000-fold compared with planktonic ones [4]. Biofilm matrix is the key factor that leads to resistance to antibiotics. The biofilm matrix can not only interact with certain antibiotics directly but also delay the introduction of antibiotics. Hence, biofilm formation tends to cause severe and/or chronic infectious diseases. To inhibit biofilm formation on the surface of biomaterials, we propose a coating technique with metal nanoparticle (NP)-dispersed silane-based polymers.
Silane-based polymer is generally referred to as an organopolysiloxane, consisting of a siloxane bond as the main backbone and organic groups as side chains. In a previous study, we investigated an alkylalkoxysilane (AAS) polymer that consists of a siloxane bond as the main backbone, alkoxy groups, and partly methyl/ethyl groups as side chains [5]. This polymer is more adhesive and chemically stable than silicone, with a mild flexibility between that of silicone and silicate; this is likely due to the random location of side chains that creates free volume in which metal NPs are packed (Figure 1). Packed metal NPs leak out gradually from the site when the metal NP-dispersed AAS polymer is immersed in aqueous environments. Therefore, this polymer has some advantages: the effect of metal NPs can last longer than naked metal NPs, and its cytotoxic effect can also be suppressed. When we coated SUS304 stainless steel with silver (Ag) NP- or copper NP-dispersed AAS polymer before immersion in seawater, biofilm formation was significantly reduced compared with that of the control sample (AAS-coated SUS304) under the cooling water pipe model [6]. We found that both Ag NP- and copper NP-dispersed AAS polymer coating were effective in inhibiting biofilm formation.
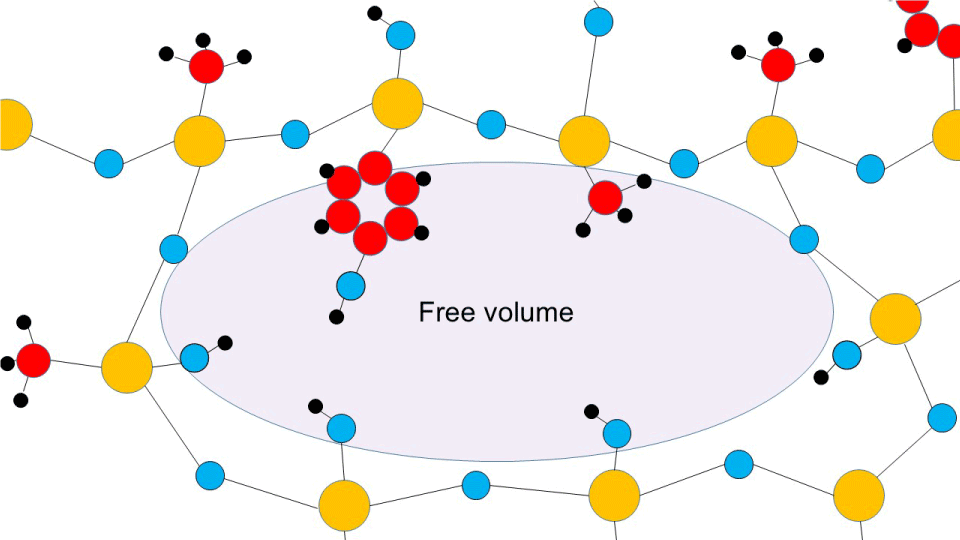
Figure 1. Presumed AAS polymer structure. Yellow circles represent silicon, red ones represent carbon, blue ones represent oxygen, and black ones represent hydrogen.
In this study, we investigated both antimicrobial and cytotoxic effects of several types of metal NP-dispersed AAS polymers for coating. We chose Ag, molybdenum (Mo), tungsten (W), and nickel (Ni) as metal NPs. Mo, W, and Ni are known as components of alloys used for biomaterials, and thus we tested our assumption that these metals might be biocompatible. We used Ag NPs as a positive control that inhibits biofilm formation.
Metal NP coating
Soda-lime glass was cut into 1 cm × 1 cm (1 mm of thickness) and used for a basal plate. Ag, Mo, W, and Ni NPs were purchased from Sigma-Aldrich (St. Louis, MO, USA). The concentration of dispersed NPs was 0.1 mol% (for W, 0.1 and 1 mol% were tested). The coating procedure described by Ogawa et al. [6] was used. Two oligomers, Permeate (MW 360, D & D Co., Yokkaichi, Japan) and KBM-603 (MW 222, Shin-Etsu chemical Co., Tokyo, Japan), were mixed in a 250-mL polypropylene bottle injected with nitrogen gas using an agitator (Toyobo, Osaka, Japan) for 30 min. Metal NPs were dispersed at the same time as mixing of the oligomers. After mixing, the adjusted coating solution was filtered through a nylon mesh #110 (NBC Meshtec Inc., Hino, Japan) then sprayed on the surface of each glass. Coated glasses were incubated at 20°C for 7 days to solidify the coating.
Biofilm formation
Biofilm formation was achieved using our in-house laboratory biofilm reactor (LBR). The LBR mainly consists of four parts: column, water bottle, pump, and fan (Figure 2). Coated samples were held on an acrylic board by an acrylic connecting pin, with the coated surface on the upper side. The acrylic board was inserted into acrylic column connected via vinyl chloride pipes. One side of the vinyl chloride pipes was joined to a rubber hose connected to a T-shaped vinyl chloride pipe holding two-tier holed plates, and the other one was connected to a water bottle. A fan was placed between the T-shaped vinyl chloride pipe and the water bottle, and wind blew down from the fan to the water contained in the water bottle, which resulted in efficient trapping of air microbes into the water. Tap water (1 L) circulated in the LBR at 6 L/min and kept at 25°C for 5 days. Fresh tap water (0.2 L) was added to the LBR every day.
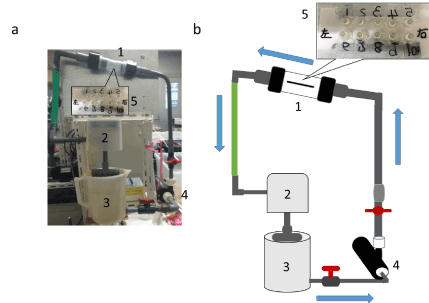
Figure 2. Open laboratory biofilm reactor. Outline of the laboratory biofilm reactor is shown as a photo (a) and illustration (b): a column (1) holding the sample (5); a fan (2); a water bottle (3); and a pump (4). Blue arrows indicate the water flow orientation.
Biofilm fixation
After 5 days of incubation in the LBR, each sample was ejected from the column and freeze-dried by the following steps: (1) Each sample was immersed in a 30% ethanol solution for 15 min at 25°C; (2) It was transferred into 50%, 60%, 70%, 80%, 90%, 95%, 98%, and 99.5% ethanol in sequence every 15 min; (3) The dehydrated sample was preserved in ethanol-t-butanol (7:3) solution for 15 min at 25°C; (4) It was transferred to 5:5 and 3:7 ethanol-t-butanol solutions in sequence every 15 min; (5) Each sample was soaked in t-butanol and preserved at 10°C overnight; and finally, (6) frozen samples were transferred to a desiccator and placed under vacuum until the frozen t-butanol disappeared completely.
Raman spectroscopy analysis
The freeze-dried samples were analyzed using a laser Raman spectroscopy (NRS-3100; JASCO Co., Tokyo, Japan). Five points (vicinity of center and vicinity of four corners) were randomly chosen in each sample, observed at a 100-fold magnitude by the attached microscope, and irradiated with a laser light, and the Raman reflection was measured at approximately 649 cm−1 (500-4000 cm−1) for 10 s. The procedure was repeated three times, and the data were combined. We confirmed that all Raman peaks from the same sample were similar in wavenumbers and that the trend of the relative intensity of each peak was comparable.
Quantitative analysis of biofilm formation
After Raman spectroscopy analysis, each sample was soaked in 0.1% crystal violet solution for 30 min at 25°C. Treated samples were washed with tap water to remove the nonspecifically absorbed dye from the surface. Following drying out for 10 min on a wipe paper, Scotch® mending tape (3M Japan, Tokyo, Japan) was affixed to the polymer-coated side. Thirty minutes later, the tape was removed and affixed to a glass slide. The stained area was measured using a color reader (CR-13; KONICA MINOLTA, Inc., Tokyo, Japan) from the opposite side of the tape-affixed glass. White paper was used for calibration. Measured data were described in L*a*b* color system: L* represents lightness (calibration value was 100); a*, the red/green coordinate (calibration value was zero); and b*, the yellow/blue coordinate (calibrator value was zero). If the color is violet, a* assumes a positive value and b* a negative value. First, we calculated  as the x-axis value and (100 - L*) as the y-axis one. Finally, we compared the vector values, i.e.,
 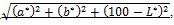 to infer the extent of biofilm formation.
Cytotoxicity assay
U937, a human monocyte precursor cell line, was kindly donated by Prof. Hidekazu Tamauchi of Ehime Prefectural University of Health Science. U937 cells were cultured in RPMI 1640 medium (Nissui Pharmaceutical, Tokyo, Japan) containing 0.1 M HEPES buffer, a 0.2% sodium hydrogencarbonate solution, 5 mM glutamine, and 5% fetal bovine serum. Upon reaching 80 to 90% confluence, U937 cells were transferred to fresh medium at 2-4 × 10⁵ cells/mL every third day. We used U937 cells cultured for 2 days (40-50% confluence) for the cytotoxicity assay. First, the coated samples were sterilized in a 70% ethanol solution overnight and then rinsed with the culture medium. Next, samples were transferred to a 12-well plate (Sumitomo Bakelite, Tokyo, Japan), and U937 cells were inoculated into each well at 4.11 × 10⁴ cells/mL (the culture volume was 2 mL/well) and incubated in a CO2 incubator under 5% CO2 and 36.5°C. After 46.6-hour culture, the cells were resuspended by pipetting, mixed with a 0.4% trypan blue solution (Nacalai Tesque, Kyoto, Japan) and transferred to an hemocytometer (Hirschmann Laborgeräte GmbH & Co, Eberstadt, Germany) to count the number of viable and dead cells under a phase-contrast microscope (Carl Zeiss, Oberkochen, Germany).
Crystal violet staining
We compared the amount of biofilm formation by crystal violet staining assay on Ag, Ni, Mo, and W NP-dispersed AAS polymers. To quantify the biofilm precisely, we measured the color and brightness of debris transferred onto Scotch® mending tape using a color reader. Because crystal violet pigment tends to nonspecifically remain on rough surfaces such as metal NP-dispersed AAS coating (with an estimated roughness of 0.1-1µm), some overestimation of biofilm was unavoidable. Compared with the AAS polymer coating, dispersion of Ni, Ag, and Mo NPs allowed a similar biofilm formation, but W NPs gave rise to a darker biofilm based on brightness. In addition, the biofilms formed on the Ni and Ag samples were fainter than the biofilms on AAS, whereas Mo and W samples were darker than those with AAS based on color (Figure 3). Table 1 shows the color and brightness data of all samples after treatment in the LBR. Integrating the results of color with that of brightness and arranging the value of the vectors in ascending order, we obtained the following order: Ni < Ag < AAS < Mo < W (0.1 mol%) < W (1 mol%).
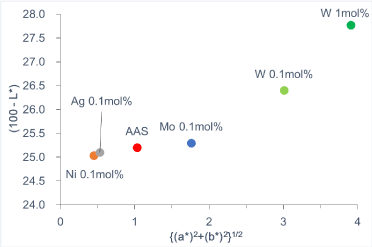
Figure 3. Comparison of color and brightness of biofilms formed on the surface of metal NP-dispersed AAS polymers.
Table 1. Comparison of the color and brightness among LBR-treated samples
Sample |
a* |
b* |
|
100 - L* |
|
AAS |
0.3 |
−1.0 |
1.03 |
25.2 |
25.2 |
Ni |
0.3 |
−0.3 |
0.45 |
25.0 |
25.0 |
Ag |
0.2 |
−0.5 |
0.53 |
25.1 |
25.1 |
Mo |
0.3 |
−1.7 |
1.76 |
25.3 |
25.4 |
W 0.1 mol% |
0.8 |
−2.9 |
3.01 |
26.4 |
26.6 |
W 1 mol% |
1.2 |
−3.7 |
3.91 |
27.8 |
28.0 |
Confirmation of biofilm formation by Raman spectroscopic analysis
We performed Raman spectroscopy to identify whether the sediments on the surface of samples were biofilms. Raman spectroscopic analysis has been applied to detect organic chemical bonds derived from EPSs such as C=O and C-N bonds of proteins, ribose ring of nucleic acids, and C-C bond of lipids. We inspected the debris accumulated at the points for each sample that had been treated in the LBR by microscopy and subjected it to Raman spectroscopic analysis. Figure 4a and Figure 4b show the images of analyzed spots in the LBR-untreated control and LBR-treated sample, respectively. About LBR-untreated controls, the surface of Ag was flat but other ones (AAS, Mo, Ni and W) were rough (Figure 4a). About LBR-treated samples, the surface of Ag was partly covered with rod shaped debris which would be microorganisms. The other surfaces (AAS, Mo, Ni and W) looked more uneven than LBR-untreated ones and they were filled with permeable debris which would be EPSs.
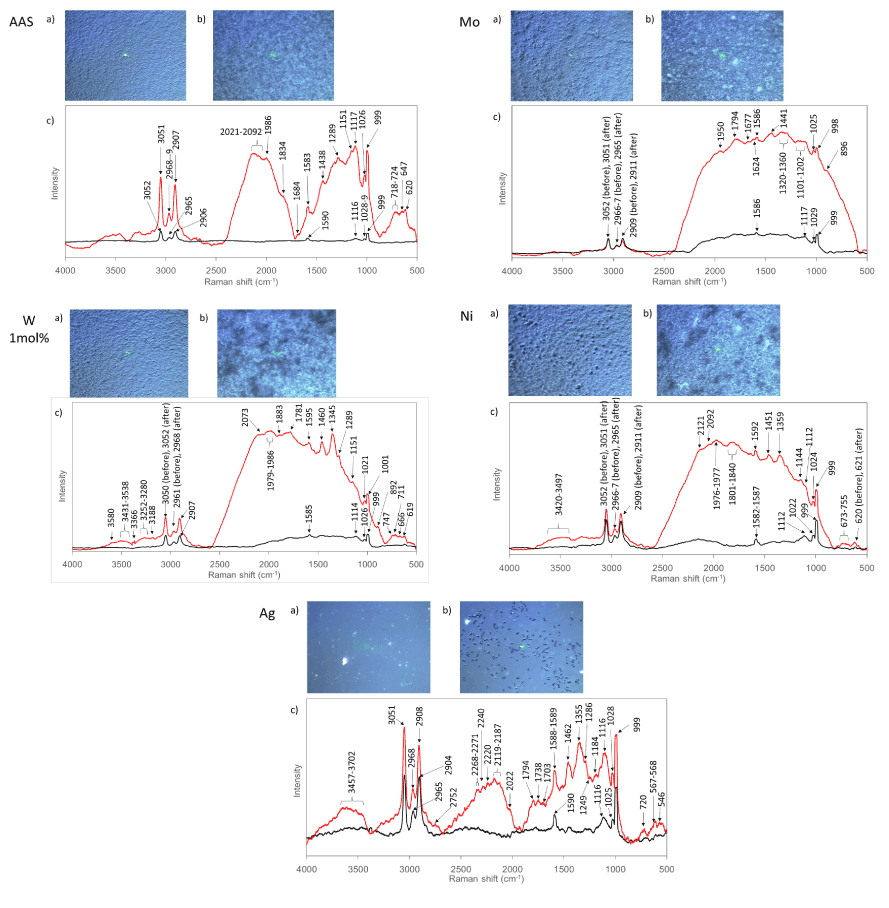
Figure 4. Raman spectroscopic analysis of metal NP-dispersed AAS polymers. In each panel, optical microscopic images are shown before (a) and after (b) treatment in the LBR. Green positions indicate the position of laser ablation. (c) Black and red lines indicate Raman peaks for LBR-untreated control (or 'before') and LBR-treated sample (or ‘after’), respectively.
The Raman shifts are summarized in Figure 4c. For the W samples, data of the 1 mol% sample are shown. Regardless of whether the sample was subjected to treatment in the LBR, several specific peaks were detected in all samples at 998-1001 cm−1 (strong peak), 1021-1029 cm−1 (weak peak), 1582-1595 cm−1 (weak peak), 2904-2911 cm−1 (strong peak), 2965-2969 cm−1 (medium peak) and 3051-3052 cm−1 (strong peak). The 998-1001 cm−1 peak and 1021-1029-cm−1 peak were assigned to the Si-O bond of the main structure of the silane coating [7-9]. The 1582-1592-cm−1 peak was assigned to the aromatic C-C stretching of the phenyl group of the silane coating. The following three peaks: 2904-2911 cm−1, 2965-2969 cm−1, and 3051-3052 cm−1 were attributed to the silane-based coating [6]. We thought that the three strong common Raman peaks derived from the AAS coating (998-1001, 2904-2911, and 3051-3052 cm−1) could be used to quantify biofilm formation, and we calculated the ratio of relative intensity of samples before and after treatment in the LBR. Unfortunately, we failed to quantify biofilm formation using these data because there was no correlation between the ratio of relative intensity among these three common Raman peaks. Therefore, we used crystal violet staining to quantify biofilm formation, while Raman spectroscopic data were used for identification of the biofilms. For the LBR-untreated Mo sample and LBR-treated W sample, one small peak was detected at 1112-1117 cm−1, which derived from the Si-O bond of the silane coating main structure [9]. Several other Raman peaks were detected in LBR-treated samples.
Several peaks were detected in LBR-treated AAS sample as follows: strong lipid-assigned peaks (at 1151 cm−1 related to C-C stretching vibration, 1289 cm−1 related to -CH3 scissoring and twisting vibration, and 1438 cm−1 related to -CH2 scissoring and twisting vibration) [10], some protein-assigned peaks (647 cm−1 peak related to C-S stretching with H and 1684-cm−1 peak related to C=O stretching vibration of peptide linkages) [11], and other peaks assigned to polysaccharides or lipids (620 cm−1 and 718-724 cm−1 peaks related to C-H wag vibration) [12] and cyclic carbonyl compounds (1834 cm−1 peak related to C=O out-of-phase stretch vibration) [12]. In addition, several cumulated double bond alkene compounds were detected (at 1986 cm−1 and 2021-2092 cm−1 related to >C=C=CH2 out-of-phase stretching and -N=C=S out-of-phase stretching, respectively) [12].
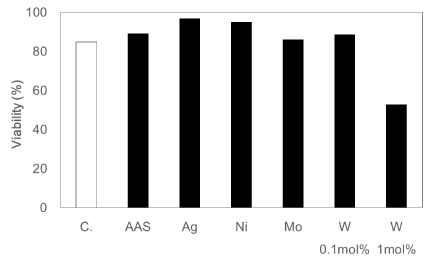
Figure 5. Cytotoxicity of metal NP-dispersed AAS polymers. U937 cells were cultured with or without metal NP-dispersed AAS polymers (C. indicates control culture condition without metal NP-dispersed AAS polymers). Viability was calculated using the formula: (viable cell density)/(total cell density)*100.
For the LBR-treated Mo sample, several lipid-assigned peaks were detected (at 1101-1202 cm−1 related to C-C stretching vibration and twisting vibration, and 1441 cm−1 related to -CH2 scissoring and twisting vibration). Two protein-assigned peaks were detected at 1624 cm−1 and 1677 cm−1 related to C=O stretching vibration of peptide linkages. At 1320-1360 cm−1, complex peaks were detected, which were a mixture of -CH3 scissoring and twisting vibration (assigned to lipid) and tryptophan (assigned to amino acid or part of protein) [10]. A γ-lactone-assigned peak was detected at 1794 cm−1 (related to C=O stretching). In addition, two cumulated double bond alkene compounds were detected at 896 cm−1 and 1950 cm−1 (related to =CH2 wag and >C=C=CH2 out-of-phase stretching, respectively) [12].
For the LBR-treated W sample, several lipid-assigned peaks were detected (at 1289 cm−1 related to -CH3 scissoring and twisting vibration, at 1460 cm−1 related to -CH2 scissoring and twisting vibration, and at 3252-3280, 3316, and 3580 cm−1 related to C-C stretching vibration and twisting vibration). Two small protein-assigned peaks were detected at 666 cm−1 and 747 cm−1 related to C-S with H and C-S with C, respectively. Amide A (part of protein main chain) assigned peaks were at 3366-3280 cm−1. DNA-derived C-O bond was at 711 cm−1, and polysaccharide or lipid-derived CH wag vibration was at 892 cm−1 [12]. The other peaks were related to γ-(CCC) of benzene (at 619 cm−1), semi-circle stretching of 2-substituted thiophene (at 619 cm−1), cyanuric acid (at 1781 cm−1), cyclic C=C stretching bond (at 1883 cm−1), >C=C=CH2 out-of-phase stretching of cumulated double bond alkene compounds (at 1979-1986 cm−1) and --N=C=S out-of-phase stretching of cumulated double bonds alkene compounds (at 2073 cm−1).
For the LBR-treated Ni sample, one small peak (at 1112 cm−1) and one medium peak (at 1356 cm−1) were assigned to C-C stretching vibration of lipids and -CH2 scissoring and twisting vibration of lipids, respectively. Protein-related peaks were detected at 673-755 cm−1 (mixture of C-S stretching with H, C-S stretching with C, and CH wag vibration) and at 3420-3497 cm−1 (amide A). Several other peaks were detected as follows: 1359 cm−1 peak was semi-circle ring stretching vibration, 1801-1840 cm−1 peaks were C=O in-phase stretching of R-CO-O-CO-R, 1976-1977 cm−1 peaks were >C=C=CH2 out-of-phase stretching of cumulated double bonds alkene compounds, 2092 cm−1 peak was -N=C=S out-of-phase stretching of cumulated double bond alkene compounds, and 2121 cm−1 peak was -OH stretching of phosphorus compounds. One unique sharp peak was detected both before (at 620 cm−1) and after (at 621 cm−1) LBR. That was assigned to Ni oxide (NiO) from dispersed Ni NPs because Larkin reported that various metal oxides have strong Raman bands from the metal-O-metal group at 200-800 cm−1 [12].
For the LBR-treated Ag sample, several lipid-derived peaks were detected at 1184 cm−1 (C-C stretching), at 1249 and 1286 cm−1 (-CH3 scissoring and twisting vibration), and at 1462 cm−1(-CH2 scissoring and twisting vibration). Amide A of protein-derived peaks was detected at 3457-3702 cm−1. C-H wag vibration from polysaccharides or lipids was detected at 720 cm−1. Other peaks were assigned as follows: 1355 cm−1 peak was attributed to semi-circle ring stretching, 1703 cm−1 and 1738 cm−1 to cyanuric acid, 1794 cm−1 to C=O stretching of g-lactones, 2022 cm−1 and 2119-2187 cm−1 to -N=C=S out-of-phase stretching of cumulated double bond alkene compounds, 2267-2271 cm−1 to P-H stretching of phosphorus compounds, 2220 cm−1 to C≡C stretching, 2240 cm−1 to C≡N stretching, and 2752 cm−1 to rock overtones. In addition, two peaks assigned to Ag oxide were detected at 546 cm−1 and 567-568 46 cm−1 both before and after LBR.
EPS components were detected on all LBR-treated samples; therefore, sediments on their surface were confirmed as biofilms. When the detected EPS components were compared among these samples, lipids were detected in all samples, suggesting that the outer domain of the biofilms mainly consisted of lipids. We reasoned that during the LBR treatment, the samples were exposed to water flow that could possibly have detached or flashed out the biofilm; however, lipids tended to remain on the surface of samples because of their hydrophobic feature. Some other complex compounds such as cumulated double bond alkene compounds and γ-lactones were also detected in the biofilms, quorum sensing-related compounds that are crucial factors contributing to the creation of biofilms [13].
Compared with AAS, Ag and Ni similarly inhibited biofilm formation, but Mo and W enhanced it. Several researchers reported that Ag NPs were effective anti-biofilm agents [6,14-16], thus supporting the results of the current study. In our previous study, we reported that organic Ni compound-conjugated AAS enhanced biofilm formation [17]. However, the current study showed contrasting results: Ni NP-dispersed AAS inhibited biofilm formation. We reasoned that these differences were caused by different concentrations of Ni leaked from the AAS polymer. It is presumed that organic Ni compounds are disassociated into Ni ions and anionic ions and held tightly in the free volume of AAS polymer, and that as a consequence, low concentration of Ni ion are leaked from the polymer. On the other hand, Ni NPs exist on the surface or in the free volume of AAS polymer that can permeate water [5], and therefore, more Ni ions will be leaked from the polymer compared with organic Ni compounds conjugated to the AAS polymer. Perrin et al. reported that at a moderate concentration (100 µM), Ni enhanced biofilm formation of E. coli K-12, and at a high Ni concentration (>200 µM), cell growth was inhibited [18]. These results indicate that Ni concentration influences bacterial proliferation and biofilm formation. In our current study, dispersed Ni NPs at 0.1 mol% corresponded to approximately 1 M, and Raman spectroscopic analysis showed that the surfaces of Ni NPs were oxidized partly/totally because a NiO-derived peak was detected (Figure 4c). Baek and An examined the microbial toxicity of NiO NPs against three different bacteria; they found that NiO NPs damaged the bacteria and that the dissolution rate of the NiO NP was 2-5% [19]. We estimated the amount of Ni ions leaking from the surface of Ni NP-dispersed AAS polymer based on these two reports to reach 20-50 mM if total Ni NPs were exposed to water, a concentration much higher (>100 fold) than the concentration that has a significant effect on biofilm formation. Even if only 1% of total Ni NP-dispersed AAS polymer was dissolved, the estimated Ni ion concentration is 200-500µM, which is equal to the Ni concentration that is sufficient to regulate cell growth.
The Mo NP-dispersed AAS polymer enhanced biofilm formation. Mo is known as a trace element for microbes, plants, and animals, and over 50 enzymes are Mo-dependent [20] to catalyze various redox reactions. In prokaryotes, there are four families of molybdoenzymes [21]. Some environmental bacteria are known to use Mo, such as Rhodopseudomonas palustris [22] and Azotobacter vinelandii [23]. Percival reported that Mo affected the growth rate of Acinetobacter sp. involved in initial biofilm formation in potable water [24]. In the present study, a biofilm formation test was performed using an open LBR system in which tap water and environmental bacteria from the laboratory were used. Therefore, we supposed that some Mo-using bacteria were present in the system and they would grow actively and be involved in biofilm formation, which is a powerful confirmation of our presumption.
2021 Copyright OAT. All rights reserv
We tested 0.1 and 1 mol% W NP-dispersed AAS polymers, both of which enhanced biofilm formation in a dose-dependent manner. To the best of our knowledge, this is the first study to report that W NPs are effective for biofilm formation. Syed et al. reported W NPs inhibited cell growth of two different species of bacteria (Staphylococcus aureus and antibiotic tolerant E. coli) [25]. Their results indicate a completely opposite physiological effect of W on microorganisms. We reasoned that this is due to the usage of different bacterial species; we used the environmental bacteria community, but Syed’s group used a pure culture of specific strains of bacteria. W has chemical properties very similar to those of Mo, and it works as an antagonist of Mo in most eukaryotes and prokaryotes [21,26]. Therefore, a similar presumption is considered, i.e., some W-using bacteria were in the LBR system, they grew actively, and were involved in biofilm formation.
Cytotoxicity assay of metal NP-dispersed AAS polymers
U937 cells were co-cultured with each metal NP-dispersed AAS polymer for 2 days. Compared with the cell viability in control culture condition (85%), AAS polymer and 0.1 mol% metal NP-dispersed AAS polymers influenced similar or higher cell viability; however, 1 mol% W NP-dispersed AAS polymer induced a much lower cell viability (53%). These results show that the AAS polymer and 0.1 mol% Ni, Ag, Mo, or W NP-dispersed AAS polymers do not cause acute cytotoxicity and further raised the possibility that the amount of W ions influences cellular functions and high ionic concentrations of W may be harmful to human cells. Assuming that the dissociation rate of W was the same, regardless of the concentration as a constituent, the concentration of leaked W ions from the 1-mol% W sample is estimated to be 10 times higher than that of the 0.1 mol% W sample. Peuster et al. examined W cytotoxicity on three types of human cells (pulmonary arterial endothelial cells, smooth muscle cells, and dermal fibroblasts) and found that at very high concentrations (>0.3 mM), W disabled the cells (of note, W concentration in normal serum is about 1 nM) [27]. This shows that control of W leakage is important to prevent cytotoxicity and that optimization of the percentage of metal NPs is needed.
We investigated the anti-microbial effects and cytotoxicity of Ag, Mo, Ni or W NP-dispersed AAS polymer coatings. Mo, Ni, and W are known components of some stainless steels such as SUS. Compared with AAS polymer coating, both Ni- and Ag-containing samples inhibited biofilm formation, but Mo- and W-containing samples facilitated biofilm formation. The effect of W on biofilm formation was dose-dependent. At 0.1 mol%, NP-dispersed AAS polymers did not damage the functions of U937 cells, but the W sample was toxic at 1 mol%. Metal NP-dispersed AAS polymer can prolong the effect of the metal on biofilm formation compared with that of naked metal NPs because water exchange speed inside a polymer is slower than that in normal solution, resulting in a decreased ionic dissociation of metal NPs. However, optimizing the concentration of metal NPs dispersed into polymers is needed to inhibit biofilm formation, as well as to prevent cytotoxicity against host cells.
- Stickler DJ (2014) Clinical complications of urinary catheters caused by crystalline biofilms: something needs to be done. J Intern Med 276: 120-129. [Crossref]
- von Eiff C, Jansen B, Kohnen W, Becker K (2005) Infections associated with medical devices: pathogenesis, management and prophylaxis. Drugs 65: 179-214. [Crossref]
- López D, Vlamakis H, Kolter R (2010) Biofilms. Cold Spring Harb Perspect Biol 2: a000398. [Crossref]
- Humphreys GJ, McBain A. J (2014) An introduction to the biology of biofilm recalcitrance. In: Percival SL, Williams D, Randle J (eds): Biofilms in infection prevention and control, Elsevier Academic Press, San Diego, USA, pp: 245-256.
- Sano K, Kanematsu H, Tanaka T (2016) Overview of silane-based polymer coatings and their applications. Industrial applications for intelligent polymers and coatings. Hosseini M and Makhlouf HAS (eds). Cham, Springer International Publishing, USA, pp. 493-509.
- Ogawa A, Kanematsu H, Sano K, Sakai Y, Ishida K, et al. (2016). Effect of silver or copper nanoparticle-dispersed silane coatings on biofilm formation in cooling water systems. Materials 9: 632.
- McMillan P, Putnis A, Carpenter MA (1984). A Raman spectroscopic study of Al-Si ordering in synthetic magnesium cordierite. Phys Chem Minerals 10: 256-260.
- Vien DL, Colthup NB, Fateley WG, Grasselli JG (1991) The Handbook of Infrared and Raman Characteristic Frequencies of Organic Molecules. (edn 1st) Elsevier, USA.
- Kalampounias AG (2011) IR and Raman spectroscopic studies of sol-gel derived alkaline-earth silicate glass. Bull Mater Sci 34: 299-303.
- Czamara K, Majzner K, Pacia MZ, Kochan K, Kaczor A, et al. (2015) Raman spectroscopy of lipids: a review. J Raman Spectrosc 46: 4-20.
- Rygula A, Majzner K, Marzec KM, Kaczor A, Pilarczyk M, et al. (2013) Raman spectroscopy of proteins: a review. J Raman Spectrosc 44: 1061-1076.
- Larkin P (2011) General Outline and Strategies for IR and Raman Spectral Interpretation. Infrared and Raman Spectroscopy. Oxford, Elsevier: Chapter 7, pp. 117-133.
- LaSarre B, Federle MJ (2013) Exploiting quorum sensing to confuse bacterial pathogens. Microbiol Mol Biol Rev 77: 73-111. [Crossref]
- Ruparelia JP, Chatterjee AK, Duttagupta SP, Mukherji S (2008) Strain specificity in antimicrobial activity of silver and copper nanoparticles. Acta Biomater 4: 707-716. [Crossref]
- Kalishwaralal K, BarathManiKanth S, Pandian SR, Deepak V, Gurunathan S (2010) Silver nanoparticles impede the biofilm formation by Pseudomonas aeruginosa and Staphylococcus epidermidis. Colloids Surf B Biointerfaces 79: 340-344. [Crossref]
- Gurunathan S, Han JW, Kwon DN, Kim JH (2014) Enhanced antibacterial and anti-biofilm activities of silver nanoparticles against Gram-negative and Gram-positive bacteria. Nanoscale Res Lett 9: 373. [Crossref]
- Ogawa A, Noda M, Kanematsu H, Sano K (2015) Application of bacterial16S rRNAgene analysis to a comparison of the degree of biofilm formation on the surface of metal coated glasses. Materials Technology 30: B61-B65.
- Perrin C, Briandet R, Jubelin G, Lejeune P, Mandrand-Berthelot MA, et al. (2009) Nickel promotes biofilm formation by Escherichia coli K-12 strains that produce curli. Appl Environ Microbiol 75: 1723-1733. [Crossref]
- Baek YW, An YJ (2011) Microbial toxicity of metal oxide nanoparticles (CuO, NiO, ZnO, and Sb2O3) to Escherichia coli, Bacillus subtilis, and Streptococcus aureus. Sci Total Environ 409: 1603-1608. [Crossref]
- Mendel RR (2013) The molybdenum cofactor. J Biol Chem 288: 13165-13172. [Crossref]
- Magalona A, Fedorb JG, Walburgera A, Weiner JH (2011) Molybdenum enzymes in bacteria and their maturation. Coord Chem Rev 255: 1159-1178.
- Naito T, Sachuronggui, Ueki M, Maeda I (2016) Light-enhanced bioaccumulation of molybdenum by nitrogen-deprived recombinant anoxygenic photosynthetic bacterium Rhodopseudomonas palustris. Biosci Biotechnol Biochem 80: 407-413. [Crossref]
- Luque F, Mitchenall LA, Chapman M, Christine R, Pau RN (1993) Characterization of genes involved in molybdenum transport in Azotobacter vinelandii. Mol Microbiol 7: 447-459. [Crossref]
- Percival S (1999) The effect of molybdenum on biofilm development. J Ind Microbiol Biotechnol 23: 112-117. [Crossref]
- Syed MA, Manzoor U, Shah I, Bukhari SH (2010) Antibacterial effects of Tungsten nanoparticles on the Escherichia coli strains isolated from catheterized urinary tract infection (UTI) cases and Staphylococcus aureus. New Microbiol 33: 329-335. [Crossref]
- L'vov NP, Nosikov AN, Antipov AN (2002) Tungsten-containing enzymes. Biochemistry (Mosc) 67: 196-200. [Crossref]
- Peuster M, Fink C, von Schnakenburg C (2003) Biocompatibility of corroding tungsten coils: in vitro assessment of degradation kinetics and cytotoxicity on human cells. Biomaterials 24: 4057-4061. [Crossref]