Abstract
Background: The real role of leptin on the vascular disease in end stage of renal disease patients is complicated rather than clear. We considered the relationship between leptin serum concentrations and manifested hypertension in non-obese patients in intermittent dialysis therapy.
Methods: We studied 76 patients in on-line hemodiafiltration. Dialysis adequacy was defined by Kt/V for urea. Leptin and i-parathormone (i-PTH) were measured by radioimmunoassay. Metabolic acidosis was determined by serum bicarbonate concentrations less than 22mmol/L. We recorded the home blood pressure according to a standard protocol and it was verified by 24-h monitoring. Antihypertensive treatment was noted. Chi-square tests and adjusted model were performed for the role of leptin on established hypertension.
Results: Chi-square tests showed significant association between hypertension and both, low leptin and low bicarbonate (x2=12.4, p=0.001 and x2=13.1, p=0.001 respectively) and it was supported by the built adjusted model. The patients with hypertension had significantly lower leptin, hemoglobin, normalized protein catabolic rate (nPCR) as a marker of protein intake and bicarbonate levels, but similar dialysis dose than the patients without hypertension. The patients with high leptin had significantly decreased blood pressure, but higher i-PTH, bicarbonate levels and liquids overload in combination with similar dialysis sufficiency comparatively to the patients with low leptin.
Conclusion: Hypertension was significantly associated with low leptin in non-obese dialysis patients. In spite of apparently adequate dialysis dose, the involved factors in this relationship may be malnutrition and uncontrolled metabolic acidosis state, although the usage of antihypertensive treatment may play an additional role.
Key words
leptin; hypertension; dialysis; metabolic acidosis; i-PTH; anti-hypertensive medications
Introduction
The end-stage of renal disease (ESRD) is characterized by increments of plasma concentrations of hormones produced by adipose tissue known as adipocytokines including leptin, resistin, tumor necrosis factor-alpha (TNF-α) and adiponectin, possibly caused by both, passive accumulation from reduced renal excretion and metabolic abnormalities induced by uremia [1].
Leptin, which belongs to IL-6 family of cytokines, plays an important role in the regulation of body weight through its central effects on appetite and peripheral effects on the regulation of energy expenditure [2]. Apart from metabolism, leptin has systemic effects including regulation of hematopoiesis, wound healing, lipolysis, blood pressure homeostasis, reproduction and immune function [3,4]. The receptor of leptin has been identified on endothelial cells, and leptin has been reported to promote both angiogenesis and inflammation [5]. Disorders associated with hyperleptinemia such as obesity and insulin resistance are major risk factors for cardiovascular disease, due to these factors define an established metabolic syndrome [6]. The current studies provide evidence that the real role of leptin on the vascular disease in end stage of renal disease patients is complicated rather than clear. In this study we considered the relationship between leptin serum concentrations and hypertension in non-obese patients in intermittent hemodiafiltration treatment.
Material and Methods
Subjects
This is a dual-center observational cross-sectional study of a cohort of 76 non-obese according to calculated BMI (<25 kg/m2) patients in permanent hemodiafiltration therapy. Patients < 18 years of age at initiation of dialysis treatment, those with less than 6 months of follow-up, autoimmune diseases, infections, malignancy and patients without regular vascular hemodialysis access and who had dialysis catheter were not included in the study.
We enrolled 47 males and 29 females, on mean age 62.2 ± 15 years old, permanently treated by on-line-predilution hemodiafiltration (on-l HDF). The median time in hemodiafiltration treatment was 5 ± interquartile range 3-10 years. The hemodiafiltration treatment was performed 3-times weekly with a dialysis time of 3.5-4 h per session, a filter of 1.5-2 m2 surface area by high-flux synthetic membrane, defined by a ultrafiltration coefficient >20 ml/h [7], using the same volume of replacement liquid equal to 20 liters and a blood flow of 350-400 ml/min.
A bicarbonate-based ultrapure buffer dialysis solution was used with a dialysate flow rate of 500-600ml/min, a calcium concentration of 1.50-1.75 mmol/L and a sodium concentration of 138-145 mmol/L. The final concentration of bicarbonate in dialysate was 32 mmol/L. Dialysis dose defined by Kt/V/day for urea, which was calculated according to the formula of Daugirdas [8]. Patients were excluded if they had Kt/V for urea <1.2.
The included patients were in a good status, on free regular diet, they had no interdialytic peripheral edema, interdialytic orthostatic hypotension or other characteristics of an inaccurate dry body weight. We also excluded the patients with multiple intradialytic hypotensive or hypertensive episodes, atrial fibrillation and those with interdialytic weight gain more than 5% of total body weight.
Nineteen of the studied patients were current smokers (a ratio of 25%). Twenty subjects disposed residual renal function defined by an interdialytic urine volume more than 100 ml (a ratio of 26.3%). Only calcium-free phosphate binders including sevelamer carbonate, lanthanium and/or aluminium hydroxide were prescribed in combination to D-vitamin administration for the regulation of bone disease (a ratio of 44.7%). Nobody of our patients was receiving NaHCO3 per os or warfarin therapy. The total of enrolled patients was treating by erythropoietin-α or –β agents.
In our data, the primary renal disease included hypertensive nephrosclerosis at a ratio of 32.9%, chronic glomerulonephritis at a ratio of 28.9%, polycystic disease at a ratio 11.8%, diabetic nephropathy at a ratio equal to 9.2% and other causes at a ratio 17.1%.
Approval and Consent
The study was approved by the ethics committee of the Hospitals “Laiko, University General Hospital of Athens” and Renal Unit of “Diagnostic and Therapeutic Center of Athens Hygeia SA”. Oral informed consent was obtained from all subjects.
Blood collection
In enrolled patients blood was drawn just before the start of the mean weekly dialysis session in a twelve hours fasting state from the vascular access. In the end of the treatment the blood pump speed was reduced to <80 ml/min and blood samples was obtained at 2 min post-dialysis from the arterial dialysis tubing for the calculation of the adequacy of dialysis by Kt/V for urea. Serum by obtained samples was separated and processed for various assays.
In each subject, three sequences of samples (every month within 3 months) were obtained for the serum bicarbonate measurements, and their average was used for statistical analysis, paying attention the low serum bicarbonate level to be in combination to low arterial pH (acidemia) and decreased PCO2.
Laboratory measurments
Albumin, glucose, calcium (Ca) corrected for the albumin levels, phosphate (P), high density lipoproteins (HDL) and low-density lipoproteins (LDL) were measured using spectrophotometric technique by Chemistry Analyzer (MINDRAY BS-200, Diamond Diagnostics, USA). The ratio of LDL/HDL was calculated. Hematological analyzer (Sysmex, xt-4000i, Roche, Hamburg, Germany) was used for hemoglobin (Hb) measurement.
High sensitivity C-reactive protein (hsCRP) and monocyte chemoattractant protein-1 (MCP-1) serum concentrations were measured using enzyme linked immunoabsorbed assays (ΕLISA, Immundiagnostik AG., Germany and Alpco Diagnostics, Anachem, USA, respectively) according to manufacturer’s specifications.
The concentrations of leptin, insulin and intact-parathormone (i-PTH) were measured by radioimmunoassays (Active Human Leptin IRMA DSL-23100i, Webster, USA, BioSource Europe S.A., Belgium, CIS bio international/France respectively). Insulin resistance was calculated using the homeostasis model assessment of insulin resistance (HOMA-IR) [9].
Metabolic acidosis was defined by serum bicarbonate concentrations less than 22.0 mmol/L, which were measured in gas machine (Roche, combas b 121) by an electrode-based method taking care of the blood specimens [10]. Normalized protein catabolic rate for dry body mass (nPCR) was calculated from the urea generation rate [11]. Body mass index (BMI) was obtained from height and post-dialysis body weight.
Blood pressure measurements
Home interdialytic peripheral systolic and diastolic blood pressure (SBP and DBP respectively) was calculated as the mean of measurements for 15-16 interdialytic days during a treatment month using an automatic sphygmomanometer OMRON M4-I (Co Ltd Kyoto Japan). The blood pressure was doubly measured for two times per day, in the morning after rising and in the evening in a fasting, calming and resting state and two means were recorded per day. Their average was used for statistical analysis. Mean peripheral blood pressure (MBP) was calculated as: MBP = DBP + 1/3 (SBP-DBP).
We also used a 24-h blood pressure monitor for verification of measurements and whether the means blood pressure values significantly differed from home recorded values, the means by 24-h monitoring were used for statistical analysis rather than the means by home measurements. Patients with mean blood pressure ³140/90 mmHg (n=29, a prevalence of 38.2%) assessed by 24-hour monitoring and/or home measured according to recommended standard protocol, or subjects with an old individual hypertension history were considered hypertensive and everyone of them was regularly receiving anti-hypertensive therapy including calcium channel blockers, beta-blockers, inhibitors of angiotensin II AT1 receptors or new central-acting medications.
Haemodynamic measurements
Hemodynamic measurements were performed before the mid-week dialysis session in all subjects after resting for at least 10 minutes. Arterial stiffness was measured as carotid-femoral pulse wave velocity (c-f PWV) and carotid augmentation index (AIx) using the SphygmoCor system® (AtCor Medical Pty.Ltd, Sydney, Australia) according to manufacturer’s specifications. In each subject two sequences of measurements were performed, and their mean was used for statistical analysis. Pulse pressure (PP) was derived.
Data analysis
Data were analyzed using SPSS 15.0 statistical package for Windows (SPSS Inc, Chicago, Illinois) and expressed as means ± SD or as median value (interquartile range) for data that showed skewed distribution; Differences between mean values were assessed by using unpaired t-test for two groups or Mann-Whitney U- test for data that showed skewed distributions and expressed as means ± SD or as means Rank.
Correlations between variables were defined by Spearman coefficient and the relationships between categorical variables were defined by chi-square tests. P values less than .05 were considered significant. We built a model using logistic regression analysis by enter method to investigate leptin serum concentration as a possible independent predictor for manifested hypertension adjusting to traditional and specific risk factors for dialysis patients, such as age, diabetes mellitus, smoking, dialysis vintage, dialysis sufficiency and bicarbonate serum concentrations. A control for multicollinearity was made.
Results
We divided the patients to two groups according to the found by ROC curve cut-off leptin value related to the establishment or not hypertension equal to7.3 ng/ml (Figure 1). Chi-square test showed significant association between the prevalence of hypertension and low leptin values (x2=12.4, p=0.001, Figure 2). We also observed significant association between high or low leptin values and antihypertensive treatment, as it is shown in Figure 3 (x2=7.3, p=0.02). The leptin serum concentrations were not associated with both, the underlying primary renal disease (hypertensive nephrosclerosis or other) or residual renal function preservation (x2=0.1, p=0.9 and x2=0.03, p=0.5 respectively). Moreover, the association between high or low leptin concentrations and bicarbonate serum concentrations higher or lower than 22mmol/L was found non-significant (x2=1.7, p=0.1).
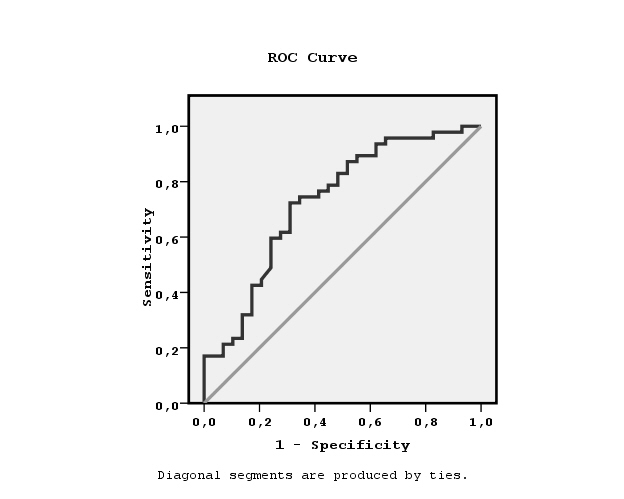
Figure 1. ROC curve showing the cut-off leptin value equal to7.3 ng/ml related to non-manifested hypertension.
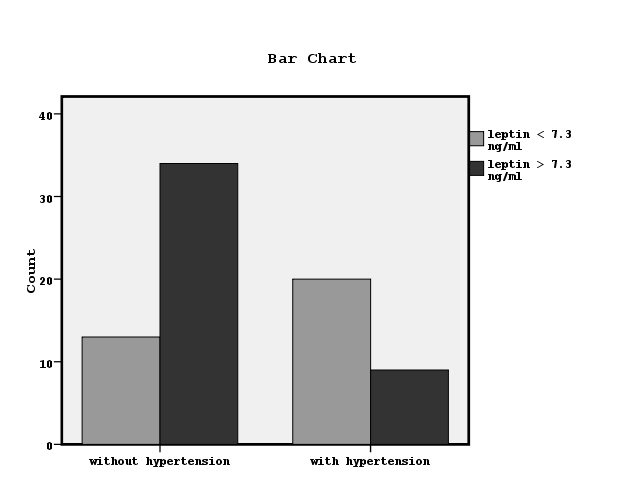
Figure 2. The association between established hypertension and leptin values lower or higher than 7.3 ng/ml by chi-square test (x2=12.4, p=0.001).
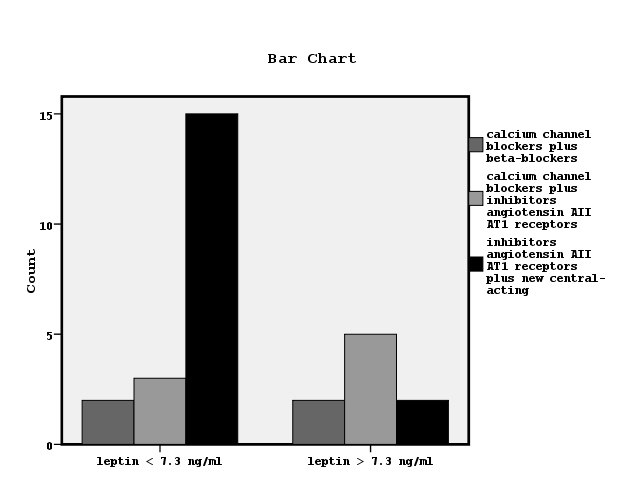
Figure 3. Bar chart showing the relationship between leptin serum concentrations and the used antihypertensive medications (x2=7.3, p=0.02).
In the adjusted model for the role of leptin on established hypertension the low leptin value in combination with low bicarbonate serum concentrations were found to be important factors adjusting to the age, diabetes mellitus, smoking, dialysis vintage and dialysis sufficiency without multicollinarity (Table 1).
Table 1. Logistic regression analysis showing the risk factors for the manifested hypertension in hemodiafiltration patients (n=76).
Characteristic |
p-value |
Odds ratio |
Confidence interval |
age |
0.5 |
1.02 |
0.9 – 1.06 |
Diabetes mellitus |
0.05 |
0.06 |
0.03 – 1.1 |
smoking |
0.7 |
0.8 |
0.2 – 3.4 |
Dialysis vintage |
0.5 |
0.9 |
0.9 – 1.07 |
spKt/V for urea |
0.07 |
0.03 |
0.01 – 1.4 |
Bicarbonate < 22 mmol/L |
0.001 |
11.7 |
2.8 – 48.8 |
Leptin serum levels > 7.3 ng/ml |
0.001 |
0.08 |
0.02 – 0.3 |
In table 2, the differences between the groups of patients with serum leptin levels more (n=43) or less (n=33) than 7.3 ng/ml are shown. We observed that the patients with high leptin values had significantly decreased SBP, DBP and MBP than the patients with low leptin levels. The patients with high leptin values had also significantly higher i-PTH, interdialytic weight gain and bicarbonate serum concentrations than the patients with low leptin values. Both groups of subjects had similar age, BMI, albumin, glucose, insulin, insulin resistance, hsCRP, MCP-1, dialysis sufficiency and dialysis vintage.
Table 2. Differences between groups of patients according to lower or higher than cut-off leptin value equal to 7.3 ng/ml related to hypertension defined by ROC curve in a total of 76 enrolled in the study patients (*: p≤0.05).
Characteristic |
Patients with leptin less than 7.3ng/ml (n=33)
mean±SD / mean Rank |
Patients with leptin more than 7.3ng/ml (n=43)
mean±SD/mean Rank |
P value |
Age (years) |
62.4 ± 15.3 |
62.09 ± 14.9 |
0.9 |
Dialysis vintage (years) |
/39.9 |
/37.4 |
0.6 |
Kt /V for urea |
/38.02 |
/38.8 |
0.8 |
nPCR (g /Kg /day) |
2.3 ± 0.4 |
2.5 ± 0.5 |
0.1 |
Interdialytic Urine volume (ml) |
168.9 ± 140.4 |
245.4 ± 142.2 |
0.2 |
BMI (Kg/m2) |
24.09 ± 3.4 |
24.7 ± 2.7 |
0.4 |
Hb (gr/dl) |
11.8 ± 1.6 |
11.9 ± 1.1 |
0.8 |
Albumin (gr / dl) |
/41.2 |
/36.3 |
0.3 |
LDL/HDL |
2.2 ± 0.7 |
2.4 ± 0.9 |
0.2 |
Glucose (mg / dl) |
97.1 ± 18.7 |
91.3 ± 20.5 |
0.2 |
Insulin (μU/ml) |
/37.5 |
/39.6 |
0.6 |
HOMA-IR (mmol/L) |
/39.8 |
/37.5 |
0.6 |
MCP-1 (pg/ml) |
/39.2 |
/38.02 |
0.8 |
HsCRP (mg /L) |
7.8 ± 5.9 |
8.1 ± 5.8 |
0.8 |
Leptin (ng/ml) |
3.5± 2.1* |
12.3 ± 4.9 |
0.001 |
SBP (mmHg) |
144.9 ± 20.6* |
130.3 ± 16 |
0.001 |
DBP (mmHg) |
84.5 ± 10.1* |
79.2 ± 9.4 |
0.02 |
MBP (mmHg) |
104.6 ± 12.7* |
96.2 ± 11.05 |
0.003 |
i-PTH (pg/ml) |
/30.9* |
/44.3 |
0.009 |
Ca corrected for albumin (mg/dL) |
9.6 ± 0.6 |
9.3± 0.8 |
0.07 |
P (mg/dL) |
5.1 ±1.5 |
5.6 ± 2.1 |
0.2 |
Ca x P |
49.2 ± 14.3 |
53.2 ± 20.2 |
0.3 |
c-fPWV (m/s) |
11.6 ± 2.1 |
11.07 ±1.5 |
0.2 |
Aix |
24.5 ± 2.4 |
23.9 ± 1.9 |
0.3 |
Serum bicarbonate (mmol /L) |
/32.09* |
/42.9 |
0.05 |
Interdialytic weight gain (lits) |
1.9 ± 0.8* |
2.4 ± 0.8 |
0.007 |
In table 3, the differences between the groups of patients with or without manifested hypertension are shown. We noted that the group of subjects with established hypertension had significantly lower leptin levels and significantly higher c-fPWV, Aix, SBP, DBP and MBP than the group of patients without established hypertension.
Table 3. Differences between groups of patients with and without hypertension in a total of 76 enrolled in the study patients (*: p ≤ 0.05).
Characteristic |
Patients with hypertension (n=29)
mean±SD / mean Rank |
Patients without hypertension (n=47)
mean±SD / mean Rank |
P value |
Age (years) |
65 ± 13.6 |
60.5 ± 15.7 |
0.2 |
Dialysis vintage (years) |
/34.7 |
/40.9 |
0.2 |
Kt/V for urea |
/35.2 |
/40.5 |
0.3 |
nPCR (g/Kg/day) |
2.1 ± 0.4* |
2.5 ± 0.5 |
0.002 |
Interdialytic Urine volume (ml) |
220 ± 161.9 |
202 ± 129.7 |
0.8 |
BMI (Kg/m2) |
23.9 ± 2.9 |
24.8 ± 3.1 |
0.2 |
Hb (gr/dl) |
11.5 ± 1.3* |
12.1 ± 1.2 |
0.04 |
Albumin (gr/dl) |
/ 39.4 |
/ 37.9 |
0.7 |
LDL/HDL |
2.1 ± 0.7 |
2.4 ± 0.9 |
0.1 |
Glucose (mg/dl) |
95.06 ± 18.7 |
93.04 ± 20.7 |
0.6 |
Insulin (μU/ml) |
/36.9 |
/39.5 |
0.6 |
HOMA-IR (mmol/L) |
/37.9 |
/38.8 |
0.8 |
MCP-1 (pg/ml) |
/40.03 |
/37.5 |
0.6 |
HsCRP (mg /L) |
9.04 ± 6.07 |
7.3 ± 5.6 |
0.2 |
Leptin (ng/ml) |
5.6± 4.4* |
10.3 ± 6.06 |
0.001 |
SBP (mmHg) |
157.06 ± 12.01* |
124.06 ± 10.2 |
0.001 |
DBP (mmHg) |
90.9 ± 3.9* |
75.7 ± 8.1 |
0.001 |
MBP (mmHg) |
112.9 ± 5.3* |
91.8 ± 7.9 |
0.001 |
i-PTH (pg/ml) |
/40.1 |
/37.6 |
0.6 |
Ca corrected for albumin (mg/dL) |
9.4 ± 0.8 |
9.5 ± 0.6 |
0.3 |
P (mg/dL) |
5.5 ± 1.6 |
5.4 ± 2.1 |
0.7 |
Ca x P |
51.9 ± 15.6 |
51.2 ± 19.3 |
0.8 |
c-fPWV (m/s) |
12.2 ± 1.9* |
10.7 ±1.5 |
0.001 |
Aix |
25.1 ± 2.1 |
23.6 ± 2.0 |
0.003 |
Serum bicarbonate (mmol/L) |
/28.2* |
/44.9 |
0.001 |
Interdialytic weight gain (lits) |
2.01 ± 0.8 |
2.3 ± 0.9 |
0.1 |
However, the subjects with hypertension had significantly lower Hb, nPCR and bicarbonate serum concentrations than the patients without hypertension. Both groups of patients had similar age, BMI, albumin, urine output, insulin, insulin resistance, hsCRP, MCP-1, dialysis sufficiency, dialysis vintage and interdialytic weight gain. Chi-square test showed significant association between the prevalence of hypertension and serum bicarbonate concentrations < 22mmol/L (x2=13.1, p=0.001, Figure 4).
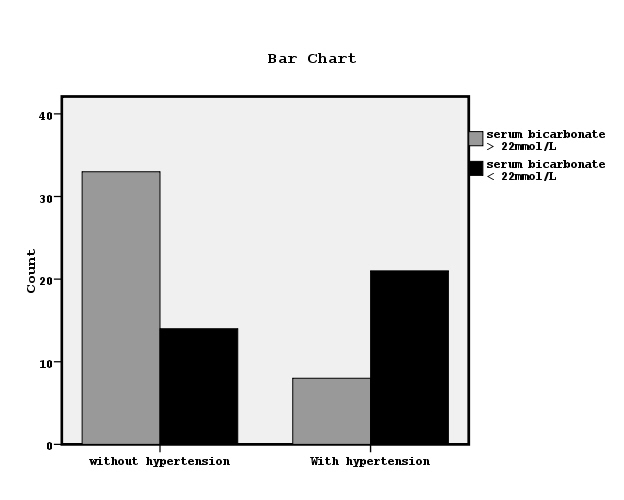
Figure 4. The relationship between manifested hypertension and bicarbonate serum concentrations lower or higher than 22mmol/L by chi-square test (x2=13.1, p=0.001).
Bivariate correlations showed significant association between leptin and both, i-PTH and interdialytic weight gain (r=0.383, p=0.01 and r=0.295, p=0.02 respectively). i-PTH values were also positively associated with c-fPWV (r=0.361, p=0.02).
Discussion
Strong evidence indicates an important role of leptin on hypertension mainly by increasing the activity of sympathetic nervous system [12], but there are no studies directly showing that the administration of leptin raises blood pressure in humans. Apart from the activation of central sympathetic nervous system, leptin actions are referred to the stimulation of endothelin-1 production, but also to blood pressure lowering mechanisms via vasodilation, by promoting nitric oxide release from the endothelium [13]. Moreover, leptin has been found to involve in elevated renal sodium reabsorption, due to increased renal sympathetic nerve activity resulting in high blood pressure [14,15].
Previous studies reported that hyperleptinemia in combination with reduced insulin sensitivity and enhanced chronic systemic inflammation contributes to cardiovascular morbidity and mortality in ESRD patients [16,17]. Controversially, there are reports which revealed that low serum leptin levels rather than high are independent predictors of mortality [16,18].
In this study, we obse2021 Copyright OAT. All rights reservtion between the prevalence of hypertension and both, low leptin serum concentration and low bicarbonate serum concentrations. This finding was supported by an adjusted model about the significant predictors for established hypertension, which showed the low leptin value and the low serum bicarbonate to be important factors adjusting to traditional and specific for dialysis patient’s covariates. Our patients with hypertension seemed to be in a worse nutritional and metabolic acidosis status defined by lower hemoglobin, lower nPCR as a marker of protein intake and lower bicarbonate serum concentrations in conjunction with lower leptin levels, in comparison to the patients without hypertension, although both groups of patients had similar dialysis sufficiency, dialysis vintage, age and markers of inflammation including hsCRP and MCP-1.
In agreement, previously, it has been already reported that leptin levels were elevated in advanced renal disease patients with normal and mild malnutrition, although leptin was found to be lower in severe and moderate category of malnutrition score [19]. In ESRD patients malnutrition and hypoalbuminemia are common and powerful predictors of morbidity and mortality of these patients [20]. The decreased serum levels of leptin in severe category of malnutrition group might be associated with acquired leptin receptor resistance [19]. Reversely, the lower leptin levels may be implicated to the pathways for hypertension and worsen nutritional and metabolic state in dialysis patients. However, such as conception for the role of low leptin in these patients needs more investigation.
On the other hand, it has been suggested that leptin mediates in the elevation of blood pressure in obese subjects by activation of central nervous system and by increased insulin resistance, due to the established metabolic syndrome during obesity [21]. It has been also supported that elevated leptin in dialysis patients may be attributed to Metabolic syndrome, rather than to chronic kidney disease pathogenesis alone [22]. In our data, obese subjects with a manifested metabolic syndrome were not enclosed. In the meantime, the advantages from the choice of antihypertensive medications have been suggested with an emphasis on metabolic properties [23]. Indeed, in this study we observed a significant association between low leptin and antihypertensive therapy including inhibitors of angiotensin AII AT1 receptors plus new central-acting medications, as it is shown in Figure 3.
Regarding with the role of metabolic acidosis on hypertension, previously, it has been reported the association of uremic acidosis with arterial pressure in hypertensive patients in consent with the finding of this study [24]. It has been shown that an increased ionized plasma calcium levels due to metabolic acidosis, leads to an increased blood pressure, due to ionized plasma calcium has the pivotal role for the regulation of blood pressure [25].
Furthermore, in this study, we observed that the patients with lower leptin had significantly lower serum bicarbonate levels in combination to low arterial pH and decreased PCO2 than the patients with higher leptin, despite the association between high or low leptin concentrations and bicarbonate serum concentrations higher or lower than 22mmol/L was found non-significant. In previous study, it has been suggested maintaining of serum bicarbonate >22mmol/L for all ESRD patients irrespectively of dialysis modality, that was considered a complete correction of metabolic acidosis [26]. In ESRD patients the low serum bicarbonate level must be considered in combination to low arterial pH (acidemia) and decreased PCO2, that defines the existence of metabolic acidosis, rather than respiratory alkalosis, which is another clinical condition that causes decreased bicarbonate level, but without acidemia.
Previous evidence concerning the relationship between leptin and metabolic acidosis is controversial. Metabolic acidosis has been shown to decrease serum leptin in uremic rats through suppression of leptin secretion from adipocytes [27], in agreement with our finding. In contrast, other previous studies reported that blood hydrogen ion concentration does not influence substantially or only moderately leptin serum concentrations, or the correction of metabolic acidosis in dialysis patients can decrease leptin [28,29].
The absence of established metabolic syndrome in our non-obese data in combination with a relative malnutrition, the usage of antihypertensive therapy and the influence of metabolic acidosis status may explain the found significant association between manifested hypertension and low leptin in this study. Moreover, in our data we observed that the patients with hypertension had significantly higher markers of arterial stiffness including c-fPWV and Aix in combination to mildly higher i-PTH, as a bone disease marker. c-fPWV was also positively associated with i-PTH. There is big evidence demonstrating the association between arterial stiffness and hypertension and cardiovascular disease, due to vascular calcification linked to bone disease in dialysis patients [30].
On the other hand, in our study we noted significantly higher i-PTH value in patients with higher leptin than the subjects with lower leptin, even though similar dialysis sufficiency between both of groups and the correlation between leptin and i-PTH was found significant. In agreement, serum leptin has been suggested as a bone density marker and previous experimental study supported that leptin regulates the osteoblastic differentiation and calcification of vascular cells and that the artery wall may be an important peripheral tissue target of leptin action [31]. Controversially, other studies found no association between leptin and i-PTH [32], or an inverse link between leptin, bone mass and i-PTH in dialysis patients suggesting that leptin may be implicated in low bone turnover in these patients, likely by a mechanism involving the central nervous system [33].
As an additional finding of this study, a positive correlation between leptin and liquids overload defined by increased interdialytic weight gain was noted and we observed significantly higher interdialytic weight gain in group of patients with higher leptin than the patients with lower leptin, despite similar dialysis adequacy in both groups. Fluid overload has been closely linked with outcomes in these patients. This has mainly been attributed to cardiac volume overload and its relation with markers of endothelial dysfunction including leptin. However, recently, it has been reported reduced leptin in overhydrated patients controversially to our finding [34].
By the findings of this study, we could quest that the predominant direct factors for manifested hypertension in apparently well-dialyzed patients may include an unregulated metabolic syndrome linked to stimulation of leptin, a malnutrition state accompanied by low leptin and an uncontrolled metabolic acidosis state, rather than the disorders of bone disease or liquids overload. Bone disease abnormalities and overhydration may act indirectly by an influence partly on leptin levels, even though hypertension is considered a volume dependent condition in these patients.
Conclusion
This study showed that hypertension was significantly associated with low leptin serum concentrations in non-obese in renal replacement therapy patients. In spite of apparently adequate dialysis dose, the involved factors in this relationship may be malnutrition and uncontrolled metabolic acidosis state, although the usage of antihypertensive treatment may play an additional role.
Limitations
The main limitation of this study is the small number of enclosed patients in combination with its cross-sectional nature. The measurements of EN1 and NO for the role of leptin on microvascular dysfunction were unavailable. The measurement of the total serum ions for metabolic acidosis definition was also unavailable.
Author’s contributions
Vaia DRaikou: research plan, statistics, data collection and manuscript writing.
Despina Kyriaki: biochemical analyses, ELISA and radioimmunoassays.
Compliance with Ethical Standards
Conflict of Interest
Author Vaia D Raikou declares that she has no conflict of interest. Author Despina Kyriaki declares that she has no conflict of interest.
Ethical approval
All procedures performed in studies involving human participants were in accordance with the ethical standards of the institutional and/or national research committee and with the 1964 Helsinki declaration and its later amendments or comparable ethical standards.
Informed consent
Oral informed consent was obtained from all individual participants included in the study.