The Lattice Boltzmann Method (LBM)-D2Q9 model is used to simulate velocity development and mass transfer of flows in casting. To quantify the basic flows in casting, stable flows in planes and pipes are simulated, which confirmed the LBM-D2Q9 model’s validation and numerical stability. Solute diffusion and vortex development are also investigated using LBM-D2Q9 model. The results show that the LBM model is capable to describe the velocity and solution field, which in a good match with the analytical calculations.
The ongoing demanding of advanced aero engines, which possess high thrust and lightweight, have caused a tremendous application of the near net shape forming technology of complex thin-wall superalloy casts [1]. During the casting, the solidification sequence, temperature and solute concentration distribution are affected by the complexity of geometry shape and thinness of the cast wall. These’re bringing a challenge for cast perfect forming and metallurgical quality improvement. It has been found that counter-gravity casting with additional pressure is more capable for complex thin wall cast near net shape forming than regular gravity casting [2-3].
During the pressured counter-gravity casting, forming and solidification are experiencing forced convection and constrained space condition. The mechanisms of melt flow and crystallization and the relation of microflows between dendrites and porosity suppression and microstructure evolution are complicated and have been a top focused area in the solidification researches [3-5]. Lattice Boltzmann method (LBM) has been proved that is an effective and powerful method to gain a numerical solution of Navier-Stokes equation [6], compared to other traditional numerical solutions of the Navier-Stokes equation, like Lax-Wendroff, MacCormack or SIMPLE method.
To reveal the solidification microstructure evolution of superalloy complex thin-wall casting under complex constrained space and forced convective condition, simulations of the mass and heat transfer and distribution in this complex constrained cast is needed to carry out to understand the solidification condition. In the first step, it’s our goal to verify the LBGK model for representing the basic thermo-flow in the casting.
In this work, Lattice Boltzmann Method (LBM) is adapted to simulate fluid flow, solute and heat transfer. The LBM is a discrete approximation of Boltzmann equation, based on gas kinetic theory. The BGK approximation, proposed by Bhatnagar, Gross and Krook who replaced the collision term J(ff1) by a single relaxation time Ωf [7], has been widely accepted and utilized to solve Boltzmann equation. The Lattice BGK (LBGK) evolution equation can be described as:
 (1)
(1)
where, fi (x,t) is the discrete-velocity distribution function, it describes the density of particle with velocity ci at position and time (x,t), ei represents the discrete velocity space {e1,e2,...ei}, Δt is the time step, t f is the relaxation time,  is the discrete equilibrium distribution function, Fi(x,t) is the force term caused by physical field.
The LBM also can be used to simulate the solute transport and heat transfer drive by a different mechanism such as diffusion and convection. Similar to the LBM for fluid flow, the solute distribution function  can be expressed as follow, using the passive scalar model [8].

Where σ represents solute,  is the relaxation time for the solute field,
  is the equilibrium distribution function for the solute field,
  is the solute source term.
The LBM for temperature is calculated using internal energy distribution function model . The internal energy distribution function hi (x,t) is coupled by velocity distribution function fi (x,t), which can be written as:

where  is the relaxation time for temperature field,
  is the equilibrium distribution function, Hi (x,t)is the temperature source term.
The two-dimensional D2Q9 model is chosen as the present discrete velocity model. Velocity space is discretized into a square lattice including nine discrete velocities ei, as shown as:

where  is the lattice speed, Δx is the lattice space, Δt is the time step. Related macroscopic variables such as density P, velocity u, concentration Cσ and temperature T, can be calculated from the relevant distribution functions as listed:

The equilibrium distribution functions, which is related to the discrete velocity model, are defined as:
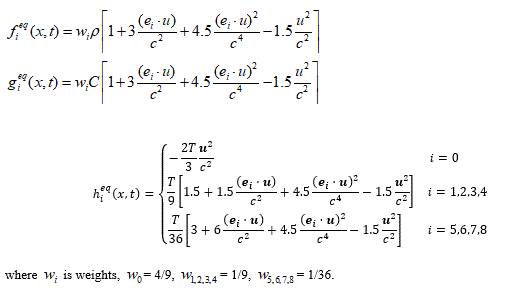
The relaxation time for velocity, solute and temperature field are related to kinematic viscosity v, solute diffusion coefficient D, and thermal diffusion coefficient α.

Boundary condition has a significant effect on the simulation results. It should be implemented accordingly to reflect its physical nature and without compromising its numerical stability. In the present simulation, the periodic boundary condition is implemented at left and right wall, while non-equilibrium extrapolation scheme is used at the top and bottom wall, assumed that there is no fluid flow over the top and bottom wall.
Stable flows in planes and pipes
When the melt forming in plane or pipe, stable flows can be achieved when casts are large enough. In present work, we simulated a typical plane flows by means of LBM and verified the results compared with an analytical solution and numerical stability in different meshes.
As shown in the Figure 1, alloy melt is forming between two planes with distance h, assumed two planes have infinite width and length and the melt is incompressible viscous fluid. The upper plane is a velocity boundary with velocity U and the bottom plate is fixed. In this circumstance, the governing equation and its analytical solution are:

Figure 1. A Plane Flow Geometry Illustration.

Using the LBGK-D2Q9 model, the streamwise velocity distribution of a stable plane flow is simulated as shown in the Figure 2. Reynolds number is set to 100 assuming there is a stable flow. Fluid density is set to unity and upper velocity U is 0.1 and the computation area are meshed by 156×156, 206×206 and 256×256 respectively. The colored velocity distribution suggested that the developed plane flow velocity differs in layers. The dimensionless velocity profile at the position of the middle x-axis is compared with the analytical solution, shown in the Figure 3a. The LBM results in a good agreement with the analytical solution, suggesting LBM is a validated model for simulating basic stable flows. In the Figure 3b, the results suggested that LBM in three different mesh have similar numerical stability. In the Figure 4, the velocity profile u = u(y) evolved from a shapely curve to a diagonal line as the timestep increased, suggesting the flow developed from unstable to stable flow. LBM is capable to simulate the dynamic process fluid flow in plane.
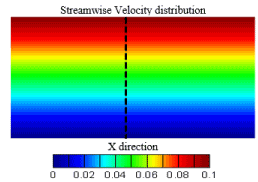
Figure 2. Velocity distribution in the plane flow using LBGK-D2Q9 model.
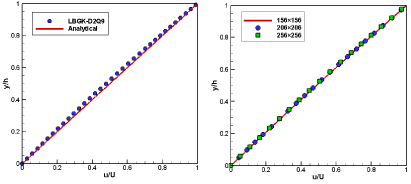
Figure 3. (a) the velocity profile u=u(y) at the middle plane flow simulated by LBM compared with analytical results (b) the velocity profile u=u(y) at the middle plane flow simulated by LBM with three different meshes, 156×156, 206×206 and 256×256.

Figure 4. The evolution of velocity profile u=u(y) as timestep n increasing, simulated by LBM, in the middle of the plane flow
Melt flows in the pipe is also a common circumstance in casting. A geometry illustration and physical description are given in Figure 5. Similar to the 2D-plane flow above, a fluid flowing between two planes, except both upper and bottom wall are fixed. In x-axis direction, there is pressure gradient  between inlet and outlet. The governing equation and analytical solution are:
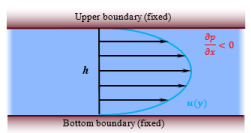
Figure 5. A Pipe Flow Geometry Illustration.
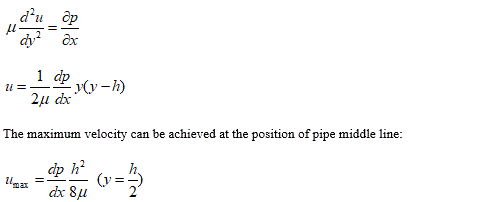
In order to investigate, LBM simulation is carried out using the LBGK-D2Q9 model as same as in plane flow. The streamwise velocity distribution of the LBM simulated pipe flow is shown in the Figure 6. The colored velocity distribution demonstrated that pipe flow velocity is zero at the upper and bottom wall because of the viscous stress while achieving maximum velocity at pipe middle line. The dimensionless velocity profile at the position of the middle x-axis is compared with the analytical solution, as shown in the Figure 7a. The LBM simulation and analytical solution in a good agreement. And also, LBM simulation shows a good numerical stability in different meshes as in Figure 7b. In the Figure 8, the velocity profile u = u(y) developed into a parabolic curve as the timestep increased.
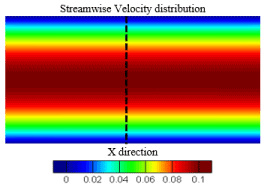
Figure 6. Velocity distribution in pipe flow using LBGK-D2Q9 model.

Figure 7. (a) the velocity profile u=u(y) at the middle pipe flow simulated by LBM compared with analytical results (b) the velocity profile u=u(y) at the middle pipe flow simulated by LBM with three different meshes, 156×156, 206×206 and 256×256.
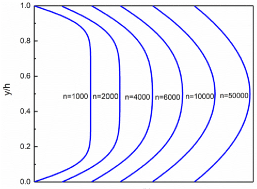
Figure 8. The evolution of velocity profile u=u(y) as timestep n increasing, simulated by LBM, at the middle of pipe flow.
Solute diffusion in flows
Solute distribution has a significant influence on dendrite growth and microstructure evolution. During the casting, solute diffusion is driven by both fluid and temperature fields. LBM Passive Scalar Model [8] has been proved that it’s an effective model for simulation of solute diffusion. In present simulation, we consider a solute diffusion from the plate while a stable flow passes by, as shown in Figure 9. A uniform flow pass with velocity u0 from left to right, while solute diffuses from the bottom wall with a concentration Cp. The left, right and upper boundaries are considered as an infinite wall. The left and bottom boundaries are the Dirichlet boundary with concentration  respectively, while the top and right boundaries are considered as the Neumann boundary with conditions and , respectively. When the flow is stable, the solute governing equation and analytical solution are (neglect solute diffusion along x-axis):
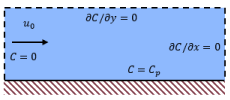
Figure 9. A Solute Diffusion in flows Geometry Illustration.
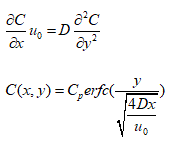
As shown in the Figure 10a, the LBM simulated concentration distribution of a concentration diffused from a plate with a flow are compared with the analytical results Figure 10b and a pure concentration diffusion without a flow Figure 10c. To verify the LBM simulation, the concentration profiles along the y-axis at three different x-axis positions, which have been nondimensionalized x/Ny=2.5, 5 and 7.5 are compared with the corresponding analytical concentration profiles in the Figure 11. The comparison shows that the good agreement between the LBM simulation and analytical solution. These results demonstrated the validation of LBM model to describe concentration evolution under a dynamic flow circumstance. This result could be a benchmark work for us to further investigate solute distribution in a more complicated fluid flow situation.
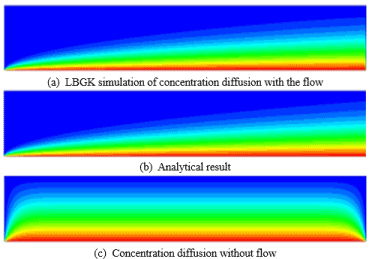
Figure 10. Concentration profile compared with analytical solution.
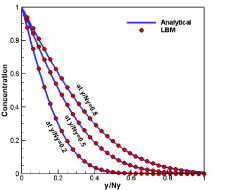
Figure 11. Concentration diffusion along with the y-axis at x/Ny=2.5, 5 and 7.5 position.
Vortexes in the casting cavity
Casting flow could be violent during molten metal pouring. It is common that molten metal has large initial flow velocity, unstable flow and vortexes, even turbulence. These unstable flows could also influence the casting quality [12-13]. In present work, we consider a simplified simulation to describe vortexes formation in casting cavity at different Reynolds number. As shown in Figure 12, in a closed square cavity, the right, left and bottom wall are fixed as the velocity boundaries are zero, while the upper wall is set to an initial velocity U from left to right. As the flow developed to stable flow, a primary vortex would exist in the cavity center and two little one in the lower left and lower right, respectively. By valuing Reynolds number Re=100, 1000, 10000 and 20000, two different relaxation time algorithms, Single-Relaxation Time (SRT) and Multi-Relaxation Time (MRT), are used to compare the numerical stability of these two algorithms in high Reynold number Re=10000 and 20000. The LBM simulation result was then compared with other results used different numerical method.
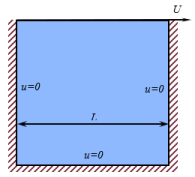
Figure 12. A Vortexes in Casting Cavity Geometry Illustration.
In the Figure 13, total velocity and streamline distribution in different Reynolds number 100, 1000, 10000 and 20000 are simulated using SRT-LBM. Especially, MRT-LBM simulations are implemented in high Reynolds number 10000 and 20000. As the Reynolds number increased, it is can be seen from the simulation results that Reynolds number controlling the flow mechanism. When , there are three vortexes in the cavity. One primary vortex in the center of the cavity and two secondary vortexes in the lower left and lower right. When Re increase to 10000, the third secondary vortex presents at the top left. When Re increase to 20000, a tertiary vortex appears at the lower right. As the Re increasing, the primary vortex moves to the center of cavity. Table 1 gives a quantitative measurement of each vortex position. The present simulation results are compared with the other simulation, which shows a good agreement.

Figure 13. Total velocity and streamline distribution in different Reynolds number 100, 1000, 10000 and 20000 using SRT and MRT algorithm.
Table 1. (a) Primary and bottom corner’s vortex position at different Reynolds number 100 and 1000 compared with other results.
Vortex Positions |
Method |
Mesh |
Primary Vortex |
Lower Left |
Lower Right |
Ref. |
x |
y |
x |
y |
x |
y |
Re=100 |
CFD |
129*129 |
0.6172 |
0.7344 |
0.0313 |
0.0391 |
0.9453 |
0.0625 |
[14] |
SRT-LB |
203*203 |
0.6109 |
0.7358 |
0.0341 |
0.0394 |
0.9461 |
0.0591 |
[15] |
SRT-LB |
257*257 |
0.6167 |
0.7392 |
0.0266 |
0.0425 |
0.9426 |
0.0602 |
This work |
Re=1000 |
CFD |
129*129 |
0.5313 |
0.5625 |
0.0859 |
0.0781 |
0.8594 |
0.1094 |
[14] |
MRT-LB |
203*203 |
0.5320 |
0.5616 |
0.0837 |
0.0788 |
0.8572 |
0.1083 |
[15] |
SRT-LB |
257*257 |
0.5324 |
0.5660 |
0.0818 |
0.0763 |
0.8648 |
0.1129 |
This work |
MRT-LB |
257*257 |
0.5328 |
0.5667 |
0.0820 |
0.0749 |
0.8648 |
0.1126 |
This work |
(b) Primary and bottom corner’s vortex position at Reynolds number 10000 compared with other results.
Vortex Positions |
Method |
Mesh |
Primary Vortex |
Lower Left |
Lower Right |
Ref. |
x |
y |
x |
y |
x |
y |
Re=10000 |
CFD |
257*257 |
0.5117 |
0.5333 |
0.0586 |
0.1641 |
0.7656 |
0.0586 |
[14] |
MRT-LB |
417*417 |
0.5156 |
0.5262 |
0.0795 |
0.1103 |
0.7681 |
0.0598 |
[15] |
SRT-LB |
257*257 |
0.5122 |
0.5305 |
0.0606 |
0.1583 |
0.7766 |
0.0613 |
This work |
MRT-LB |
257*257 |
0.5124 |
0.5291 |
|
|
0.7813 |
0.0591 |
This work |
Top Left |
2nd Lower Right |
|
|
x |
y |
x |
y |
0.0703 |
0.9141 |
0.9336 |
0.0625 |
|
|
[14] |
0.0887 |
0.9171 |
0.9328 |
0.0623 |
|
|
2021 Copyright OAT. All rights reserv
[15] |
0.0710 |
0.9095 |
0.9413 |
0.0563 |
|
|
This work |
0.0633 |
0.9202 |
0.9419 |
0.0545 |
|
|
This work |
LBGK-D2Q9 is an effective model to simulation 2D mass transfer problems, such as stable flow, solute diffusion and vortex in the casting. When the LBGK-D2Q9 model is used for simulating stable flow, it is capable have the good agreement with the analytical solution. When the LBGK-D2Q9 model is used for simulating vortex, it is capable to compete with traditional CFD method.
This work was supported by the national natural science foundation of china (Grant No. 51771118 and U1760110) and also Supported by the fund of the State Key Laboratory of Solidification Processing in NWPU.
- Liu L (2012) The progress of investment casting of nickel-based superalloys. Foundry 11: 1273-1285.
- Shendye S, King B, McQuay P (2005) Mechanical Properties of Counter-Gravity Cast IN718. TMS 124: 133.
- Reddy CA (2008) Counter-Gravity Casting of IN625 Alloy in Thin-walled Investment Shell Moulds. 6th National Conference on Materials and Manufacturing Processes, Hyderabad.
- Milenkovic S, Sabirov I, LLorca J (2012) Effect of the cooling rate on microstructure and hardness of MAR-M247 Ni-based superalloy. Materials Letters 73: 216-219.
- Nie P, Ojo OA, Li Z (2014) Numerical modeling of microstructure evolution during laser additive manufacturing of a nickel-based superalloy. Acta Materialia 77: 85-95.
- Raabe D (2004) Overview of the lattice Boltzmann method for nano-and microscale fluid dynamics in materials science and engineering. Model Simul Mater Sci Eng 12: R13.
- Bhatnagar PL, Gross EP, Krook M (1954) A model for collision processes in gases. I. Small amplitude processes in charged and neutral one-component systems. Phys Rev 94: 511.
- Shan X (1997) Simulation of Rayleigh-Bénard convection using a lattice Boltzmann method. Phys Rev 55: 2780.
- He X, Chen S, Doolen GD (1998) A novel thermal model for the lattice Boltzmann method in incompressible limit. J Comput Phys 146: 282-300.
- Maier RS, Bernard RS, Grunau DW (1996) Boundary conditions for the lattice Boltzmann method. Physics of Fluids 8: 1788-1801.
- Zhao-Li G, Chu-Guang Z, Bao-Chang S (2002) Non-equilibrium extrapolation method for velocity and pressure boundary conditions in the lattice Boltzmann method. Chinese Physics 11: 366.
- Li B, Tsukihashi F (2005) Vortexing flow patterns in a water model of slab continuous casting mold. ISIJ international 45: 30-36.
- He Q (1993) Observations of vortex formation in the mould of a continuous slab caster. ISIJ international 33: 343-345.
- Ghia U, Ghia KN, Shin C (1982) High-Re solutions for incompressible flow using the navier-stokes equations and a multigrid method. J Comput Phys 48: 387-411.
- Portinari M (2015) 2D and 3D Verification an Validation of the Lattice Boltzmann Method. Diss École Polytechnique de Montréal.

 (1)
(1) is the discrete equilibrium distribution function, Fi(x,t) is the force term caused by physical field.
 can be expressed as follow, using the passive scalar model [8].
 is the relaxation time for the solute field,
  is the equilibrium distribution function for the solute field,
  is the solute source term.
 is the relaxation time for temperature field,
  is the equilibrium distribution function, Hi (x,t)is the temperature source term.
 is the lattice speed, Δx is the lattice space, Δt is the time step. Related macroscopic variables such as density P, velocity u, concentration Cσ and temperature T, can be calculated from the relevant distribution functions as listed:


 between inlet and outlet. The governing equation and analytical solution are:


 respectively, while the top and right boundaries are considered as the Neumann boundary with conditions and , respectively. When the flow is stable, the solute governing equation and analytical solution are (neglect solute diffusion along x-axis):


