Abstract
Disinfectants have been highly used on surfaces in hospitals, medical and dental clinics, food-processing establishments, restaurants, schools, households, etc. because they are one of the most powerful weapons against virus, bacteria and in some cases spores. The necessity to kill microorganisms and control its growth on surfaces especially in hospitals is essential due to the raise number of nosocomial infections and bacterial resistance. However, the damaging effects of these disinfectants on surfaces such as the reduction of furniture’s life time have been ignored. In fact, these disinfectants generate on such surfaces hot spots to which promote bacterial growth, making it more difficult the battle against bacteria, virus, spores etc. In this study we present the effect of some of the most important disinfectants applied on the most common metallic and polymeric surfaces commonly found in hospitals and show graphically their effect on several surfaces like aluminum, stainless steel, galvanize steel, linoleum, PVC, Melamine and Vinyl.
Key words
Disinfectant effects; Metallic Surfaces; Polymeric surfaces; Surface analysis; Washing effect.
Abbreviations
ATR: Attenuated Total Reflectance; FTIR: Fourier transform infrared spectroscopy; H2O2: Hydrogen Peroxide; NaClO: Sodium Hypochlorite; PVC: Polyvinyl chloride; Quats: Quaternary Ammonium compounds; SEM: Scanning Electron Microscopy, XPS: X-ray Photoelectron Spectroscopy.
Introduction
The principal goal of disinfection is to stop the growth of pathogenic microorganisms on infected surfaces in order to protect the health of individuals nearby. The safety of our own health is continually exposed to wide variety of germs and microorganisms living on different surfaces causing infections. Several microorganisms are commonly found in hospitals, for example, bacteria such as: Escherichia coli, Clostridium difficile, Staphylococcus aureus, Pseudomonas aeruginosa, Mycobacteria, tuberculosis [1,2]. These kind of microorganisms are responsible of nosocomial infections achieving one of the principal causes of morbidity and producing huge increments in health-care costs annually [3-6].
Infection control in hospitals plays an important role preventing extra cost for patients, avoiding undesirable illness and in some cases reducing the mortality rate in patients by nosocomial infection [7]. This control of disinfection at hospitals includes: sterilization of chirurgical materials and disinfection of surfaces like furniture, beds, toilet, windows, removing or killing most possible microorganisms. The rate of microbial killing depends upon the type, exposure time and the concentration of the disinfecting agent [8-11].
Ideally disinfectant products should be: easy to use, effective with a fast mode of action, stable, nontoxic, odorless, with a long-lasting effect, degradable, guarantying user safety and they must be friendly on treated surfaces [12, 13]. It’s very common to test or evaluate the efficacy and activity against undesirable microorganisms in order to select an appropriate disinfectant. The disinfectant selection besides its efficacy, involves other factors such as toxicity, material compatibility and cost [12]. However, disinfectants sometimes produce some oxidation effects and cause damage on treated surfaces, creating hot spots inductive for microbial growth. These effects can be variable depending on the surface composition of each material exposed to a disinfection treatment, the concentration of the product and the type of the product used. Some damages are observed on the hospital furniture, surgery tools and equipment; thus, it is a necessity to keep an ecofriendly environment at hospitals safe of microorganisms and to know the effects produced by disinfectants used on the different hospital surfaces.
The main objective of the present article is to compare and evaluate the effects on different surfaces of some of the most important disinfecting agents as: Sodium Hypochlorite, Hydrogen Peroxide, Quaternary Ammonium compounds, in comparison with new commercial products Bioxy H and Bioxy + which each of them incorporates several disinfecting actives. These active compounds and products were evaluated against different metallic and polymeric surfaces commonly found in hospitals like: aluminum, stainless steel and galvanize steel, linoleum, PVC, Melamine and Vinyl. The comparison between the surfaces mentioned was done by the comparison using surface characterization techniques as Scanning Electron Microscopy (SEM), Fourier Transform Infrared Spectrometer - Attenuated Total Reflection (FTIR-ATR) and X-ray Photoelectron Spectroscopy (XPS).
Materials and methods
Disinfectants solution
100ml of solution are prepared on a beaker and mixed with a glass road during 10 minutes to ensure complete dilution, the concentrations used were: Sodium Hypochlorite (NaClO) at 10%, Hydrogen Peroxide (H2O2) at 30% active, Quaternary Ammonium at 10% active, Bioxy H at 1%, and 5% concentrations, Bioxy + at 1% and 5% concentrations.
Disinfection process
The solution was used during the next 5 hours after preparation. The surfaces: Aluminum, Stainless Steel, Galvanize Steel, Linoleum, PVC, Melamine and Vinyl (pieces of ~1cm x 1cm of each material) were treated with the fresh solutions. The pieces of surface were cleaned with a cotton pad that had been immersed in the prepared solution and rubbed 10 times following the same direction of movement. As soon as the surfaces were cleaned, they were introduced into the characterization equipment.
All the analyses were comparing with a control sample without treatment to identify the action of each disinfectant solution prepared.
Bioxy products
Bioxy H is synthetized by ATOMES F.D.’s and is composed of Sodium Carbonate peroxyhydrate (30-70%), ethyl-benzyl ammonium chloride (2%) and chloride (2%), along with other non-hazardous components. Once Bioxy H dissolves in water, it releases three active compounds; peracetic acid in-situ, hydrogen peroxide and poly-Quaternary ammonium chloride. Peracetic acid is a compound known to disinfect surfaces [14].
This product was chosen randomly from the market due to the engineered mixture of active compounds within the formulation, thus, the effects on the different surfaces were expected to be different due to the complexity of the product.
Surface characterizations
Scanning Electron Microscopy: Scanning Electron Microscopy (SEM) images were performed using a JEOL JSM-7600TFE Field Emission Scanning Electron Microscopy. The surfaces were disinfected and coated with a thin layer of gold to avoid charge on the surface the energy used was 15 kV.
X-ray photoelectron spectroscopy: X-ray photoelectron spectroscopy (XPS) was performed with a VG ESCALAB 3 MK II (Thermo VG Scientific), using non-monochromated Al Kα X-rays (hν = 1486.6 eV) at an instrument resolution of 0.85 eV and a perpendicular take-off angle. The analysis chamber pressure was < 10-9 torr. Following Shirley background removal, the component peaks were separated by the VG Avantage software. The energy was calibrated by setting the C1s C-C peaks of all the surfaces to 285 eV. FWHM values were those previously established in our laboratory. The samples were disinfected and kept on the desiccator 15 min to ensure be completely dry, and after were analyzed.
Transmission IR: Transmission IR Spectra were obtained, in the range 400 - 4000 cm-1, using a Thermo Scientific Nicolet 6700 Fourier transforms IR spectrometer, at a resolution of 4 cm-1; 96 co-additions were used to increase S/N. The samples were disinfected with fresh solution before each measurement, then the surfaces were deposited on a diamond plate and the spectra were obtained.
The characterization on each surface was repeated three times in order to determine the consistence on the results and the constant effect on each agent evaluated.
Results
SEM
Different characterization techniques were integrated to demonstrate the interaction of several disinfectant solutions, previously described in the methodology to prove its mode of action on different surfaces commonly found in hospital as subjects to daily disinfection due to its interaction with the infected environment rich in bacteria, virus, spores etc.
Metallic surfaces of Aluminum, Stainless steel and galvanized steel were compared on Table 1 after be cleaned with NaClO at 10%, H2O2 at 30%, Quats at 10%, Bioxy H at 1% and 5% and Bioxy + at 1% and 5% and analyzed by SEM.
Surface |
Atomic % of Elements |
Aluminium (Al) |
Aluminium |
Chlorine |
Carbon |
Calcium |
Nitrogen |
Oxygen |
Sodium |
Fluorine |
Phosphorus |
Al Bioxy+ 1% - Before |
17.7 |
|
37.2 |
0.6 |
3.1 |
40.8 |
0.6 |
|
|
Al Bioxy+ 1% - After |
14.2 |
|
46.8 |
|
1.4 |
35.8 |
1.7 |
|
|
Al Bioxy+ 5% - Before |
15.4 |
|
47.7 |
|
2.8 |
32.4 |
1.7 |
|
|
Al Bioxy+ 5% - After |
11.5 |
0.6 |
56.2 |
0.4 |
2.0 |
26.8 |
2.5 |
|
|
Al Bioxy H 1% - Before |
21.2 |
|
32.8 |
|
0.6 |
45.0 |
0.4 |
|
|
Al Bioxy H 1% - After |
17.9 |
1.0 |
42.5 |
0.9 |
1.7 |
34.7 |
1.3 |
|
|
Al Bioxy H 5% - Before |
18.3 |
|
43.5 |
|
0.9 |
37.2 |
|
|
|
Al Bioxy H 5% - After |
14.4 |
|
48.2 |
|
|
33.9 |
3.5 |
|
|
Al Sodium Hypochlorite - Before |
16.1 |
|
47.9 |
|
1.2 |
34.1 |
0.7 |
|
|
Al Sodium Hypochlorite - After |
15.7 |
1.0 |
43.1 |
1.0 |
3.4 |
32.4 |
3.5 |
|
|
Al Hydrogen Peroxide - Before |
19.9 |
|
45.2 |
|
1.0 |
33.9 |
|
|
|
Al Hydrogen Peroxide - After |
12.4 |
|
44.3 |
5.1 |
1.2 |
36.2 |
|
0.9 |
5.1 |
Al Quaternary Ammonium - Before |
16.6 |
|
47.4 |
|
1.6 |
33.9 |
0.5 |
|
|
Al Quaternary Ammonium - After |
7.7 |
2.0 |
70.3 |
|
2.2 |
15.8 |
1.8 |
|
|
Table 1: XPS Results of Aluminum before and after treatment with each disinfectant.
The topography of each metallic surface shows wholes, scratches and imperfections on them, due to unpolished surfaces as many furniture and material manufactured in constant use. The pictures reveal how the residue of product are remain in wholes and scratches and specially H2O2 produce blackest stains on the three different materials, probably as more aggressive product on metal surfaces; aluminum looks more resistant than stainless steel and galvanize steel showing a clean surface without black spots. The presence of this traces are not perceptible without SEM characterization.
In comparison with Table 2, the same surfaces were exposed to Bioxy H and Bioxy + solutions as was described in the methodology. Aluminum denotes a strong resistance without dark stains on the surface, and the highest concentration (5%) produce dark spots in stainless steel.
Surface |
Atomic % of Elements |
Stainless Steel (SS) |
Silicone |
Chlorine |
Carbon |
Calcium |
Nitrogen |
Oxygen |
Sodium |
Chromium |
Iron |
Fluorine |
P |
Mg |
Zinc |
SS Bioxy+ 1% - Before |
1.6 |
|
72.4 |
|
1.5 |
23.4 |
|
0.6 |
0.5 |
|
|
|
|
SS Bioxy+ 1% - After |
6.0 |
2.5 |
55.2 |
1.5 |
5.8 |
31.4 |
3.7 |
|
|
|
|
|
|
SS Bioxy+ 5% - Before |
2.0 |
|
75.2 |
|
0.7 |
20.9 |
|
0.8 |
0.3 |
|
|
|
|
SS Bioxy+ 5% - After |
|
2.1 |
55.9 |
|
|
30.8 |
11.2 |
|
|
|
|
|
|
SS Bioxy H 1% - Before |
0.8 |
|
79.2 |
|
1.2 |
18.0 |
|
0.2 |
0.2 |
0.4 |
|
|
|
SS Bioxy H 1% - After |
|
|
54.5 |
|
2.1 |
38.1 |
5.3 |
|
|
|
|
|
|
SS Bioxy H 5% - Before |
0.7 |
|
74.0 |
|
1.7 |
22.7 |
|
0.5 |
0.5 |
|
|
|
|
SS Bioxy H 5% - After |
0.3 |
0.6 |
85.9 |
|
3.1 |
8.9 |
1.1 |
|
|
|
|
|
|
SS Sodium Hypochlorite - Before |
2.5 |
|
81.1 |
|
0.9 |
14.8 |
0.7 |
|
|
|
|
|
|
SS Sodium Hypochlorite - After |
1.2 |
1.2 |
49.1 |
0.3 |
0.9 |
36.2 |
4.1 |
|
|
|
|
0.4 |
0.6 |
SS Hydrogen Peroxide - Before |
0.7 |
|
75.5 |
|
0.5 |
20.9 |
|
0.7 |
0.7 |
|
|
|
|
SS Hydrogen Peroxide - After |
2.2 |
|
55.9 |
|
1.8 |
34.5 |
|
2.2 |
2.2 |
|
4.8 |
|
|
SS Quaternary Ammonium - Before |
0.6 |
|
72.1 |
0.1 |
1.6 |
23.3 |
|
0.6 |
0.6 |
|
|
|
|
SS Quaternary Ammonium - After |
0.5 |
2.3 |
81.6 |
0.3 |
4.3 |
9.1 |
1.9 |
0.5 |
0.5 |
|
|
|
|
Table 2: XPS Results of Stainless Steel before and after treatment with each disinfectant.
The same procedure was done on polymeric surfaces Table 3 with active compounds and Table 4 with Bioxy products, and the difference in comparison with metal surfaces was huge, because apparently surfaces do not exhibit damages, however we are able to appreciate the porosity on each surface and some wholes especially on melamine.
Surface |
Atomic % of Elements |
Galvanized steel (G) |
Silicone |
Chlorine |
Carbon |
Calcium |
Nitrogen |
Oxygen |
Sodium |
Chromium |
Zinc |
Fluorine |
Phosphorus |
Sulfur |
G Bioxy+ 1% - Before |
2.1 |
|
81.4 |
0.9 |
|
14.5 |
|
|
0.9 |
|
|
|
G Bioxy+ 1% - After |
1.6 |
0.4 |
78.5 |
|
|
18.3 |
1.2 |
|
|
|
|
|
G Bioxy+ 5% - Before |
2.8 |
|
76.8 |
0.6 |
|
18.5 |
|
|
0.6 |
0.6 |
|
0.2 |
G Bioxy+ 5% - After |
|
0.8 |
67.2 |
0.2 |
|
27.7 |
2.0 |
1.2 |
0.2 |
|
0.8 |
|
G Bioxy H 1% - Before |
4.3 |
|
72.0 |
|
|
23.8 |
|
|
|
|
|
|
G Bioxy H 1% - After |
3.1 |
0.5 |
71.8 |
|
|
23.1 |
1.5 |
|
|
|
|
|
G Bioxy H 5% - Before |
3.2 |
|
75.8 |
0.3 |
2.3 |
17.8 |
|
|
0.6 |
|
|
|
G Bioxy H 5% - After |
1.9 |
0.3 |
76.1 |
0.4 |
1.7 |
19.1 |
0.5 |
|
|
|
|
|
G Sodium Hypochlorite - Before |
2.1 |
|
81.6 |
|
|
15.5 |
|
|
0.7 |
|
|
|
G Sodium Hypochlorite - After |
|
2.9 |
64.2 |
|
|
26.1 |
6.9 |
|
|
|
|
|
G Hydrogen Peroxide - Before |
2.8 |
|
79.1 |
0.4 |
|
16.0 |
|
|
0.9 |
0.7 |
|
|
G Hydrogen Peroxide - After |
1.6 |
|
72.4 |
|
|
24.4 |
|
|
|
|
1.5 |
|
G Quaternary Ammonium - Before |
3.4 |
|
77.6 |
|
|
18.0 |
|
|
1.1 |
|
|
|
G Quaternary Ammonium - After |
|
1.3 |
79.9 |
|
2.8 |
15.7 |
|
|
0.3 |
|
|
|
Table 3: XPS Results of Galvanized Steel before and after treatment with each disinfectant.
These images of polymeric structures make us to think into a possible absorption of disinfectants on the porous, probably eliminating bacteria on then but remain material producing damages in the future on this surfaces. Other hypothesis related to metallic surfaces is the product remainders on metallic the surface producing damages and future corrosion. To clarify these ideas, the samples were analyzed by XPS characterization in order to probe possible traces of elements on the surfaces.
XPS
XPS surveys determined the elemental composition of each surfaces to proving the presence of product traces, oxidation, corrosion or degradation on each material. Such analysis was done determining the differences on surfaces before and after treatment with each solution prepared.
The evidence of new species on the surface, like fluorine and phosphorus on aluminum, support strongly the hypothesis of traces of active compounds on surfaces, due to fluorine and phosphorus are used during the process of synthesis of H2O2 (Table 1). The reduction of the composition of the atomic percent of Aluminum supports strongly the presence of disinfectant layer on the surface. Increments on elements founds on active compounds as nitrogen part of Quats, represent another probe of the presence of a layer protecting the surface.
Stainless steel treated with NaClO at 10% shows the presence of Magnesium and Zinc (Table 2), added to the stainless steel but did not seems before treatment; probably because NaClO acts
more aggressive on stainless steel. The differences in atomic composition when H2O2, NaClO acts on metallic surfaces as aluminum (Table 1), stainless steel (Table 2) or galvanize steel (Table 3) are more significant especially on oxygen composition evidencing little principles of corrosion, and Quats acts more like a coating on surfaces, changing its composition. In comparison with Bioxy products, them looks more soft products adding a thin layer with traces of active compounds, but without suggestion of corrosion, however the highest concentrations (5%) acts more aggressive than concentrations on 1%.
On the other hand, the effect of disinfectants on polymeric surface seems softer (Table 4 to 7), Melamine (Table 6) is more resistant to Quats layer H2O2 carry several contaminants and Vinyl (Table 7) looks more resistant to all the disinfectants tested on it. In general all the polymeric surfaces denote less effects than metallic surfaces, and it result is correlate with SEM, nevertheless the information of resistance surfaces to disinfectants is not enough to determine the mode of action od disinfectant, and the use of other technique like FTIR its required.
Surface |
Atomic % of Elements |
Galvanized steel (G) |
Silicone |
Chlorine |
Carbon |
Calcium |
Nitrogen |
Oxygen |
Sodium |
Chromium |
Zinc |
Fluorine |
Phosphorus |
Sulfur |
G Bioxy+ 1% - Before |
2.1 |
|
81.4 |
0.9 |
|
14.5 |
|
|
0.9 |
|
|
|
G Bioxy+ 1% - After |
1.6 |
0.4 |
78.5 |
|
|
18.3 |
1.2 |
|
|
|
|
|
G Bioxy+ 5% - Before |
2.8 |
|
76.8 |
0.6 |
|
18.5 |
|
|
0.6 |
0.6 |
|
0.2 |
G Bioxy+ 5% - After |
|
0.8 |
67.2 |
0.2 |
|
27.7 |
2.0 |
1.2 |
0.2 |
|
0.8 |
|
G Bioxy H 1% - Before |
4.3 |
|
72.0 |
|
|
23.8 |
|
|
|
|
|
|
G Bioxy H 1% - After |
3.1 |
0.5 |
71.8 |
|
|
23.1 |
1.5 |
|
|
|
|
|
G Bioxy H 5% - Before |
3.2 |
|
75.8 |
0.3 |
2.3 |
17.8 |
|
|
0.6 |
|
|
|
G Bioxy H 5% - After |
1.9 |
0.3 |
76.1 |
0.4 |
1.7 |
19.1 |
0.5 |
|
|
|
|
|
G Sodium Hypochlorite - Before |
2.1 |
|
81.6 |
|
|
15.5 |
|
|
0.7 |
|
|
|
G Sodium Hypochlorite - After |
|
2.9 |
64.2 |
|
|
26.1 |
6.9 |
|
|
|
|
|
G Hydrogen Peroxide - Before |
2.8 |
|
79.1 |
0.4 |
|
16.0 |
|
|
0.9 |
0.7 |
|
|
G Hydrogen Peroxide - After |
1.6 |
|
72.4 |
|
|
24.4 |
|
|
|
|
1.5 |
|
G Quaternary Ammonium - Before |
3.4 |
|
77.6 |
|
|
18.0 |
|
|
1.1 |
|
|
|
G Quaternary Ammonium - After |
|
1.3 |
79.9 |
|
2.8 |
15.7 |
|
|
0.3 |
|
|
|
Table 3: XPS Results of Galvanized Steel before and after treatment with each disinfectant.
Surface |
Atomic % of Elements |
Linoleum (Li) |
Silicone |
Chlorine |
Carbon |
Calcium |
Nitrogen |
Oxygen |
Sodium |
Sulfur |
Fluorine |
Phosphorus |
Li Bioxy+ 1% - Before |
4.9 |
|
71.0 |
0.3 |
1.7 |
22.1 |
|
|
|
|
Li Bioxy+ 1% - After |
2.4 |
|
69.6 |
0.3 |
0.6 |
25.8 |
1.2 |
|
|
|
Li Bioxy+ 5% - Before |
4.7 |
|
71.8 |
0.6 |
1.0 |
20.9 |
1.0 |
|
|
|
Li Bioxy+ 5% - After |
2.9 |
|
73.0 |
0.5 |
0.5 |
21.9 |
1.2 |
|
|
|
Li Bioxy H 1% - Before |
3.8 |
|
75.0 |
0.4 |
0.9 |
19.9 |
|
|
|
|
Li Bioxy H 1% - After |
2.3 |
|
77.0 |
0.2 |
0.7 |
19.8 |
|
|
|
|
Li Bioxy H 5% - Before |
4.2 |
|
77.1 |
0.4 |
0.9 |
17.3 |
0.2 |
|
|
|
Li Bioxy H 5% - After |
1.4 |
0.3 |
75.2 |
|
20.0 |
19.6 |
1.4 |
|
|
|
Li Sodium Hypochlorite - Before |
4.3 |
0.2 |
70.5 |
0.4 |
1.3 |
22.6 |
0.4 |
|
0.4 |
|
Li Sodium Hypochlorite - After |
1.8 |
3.0 |
64.1 |
1.1 |
0.9 |
25.0 |
3.7 |
0.4 |
|
|
Li HydroLien Peroxide - Before |
4.2 |
|
68.6 |
0.2 |
1.1 |
25.0 |
0.2 |
0.4 |
0.4 |
|
Li HydroLien Peroxide - After |
2.8 |
|
71.1 |
0.2 |
1.8 |
22.8 |
|
0.4 |
|
0.9 |
Li Quaternary Ammonium - Before |
3.3 |
|
76.3 |
0.2 |
1.0 |
18.7 |
0.2 |
0.3 |
|
|
Li Quaternary Ammonium - After |
1.7 |
|
78.2 |
|
1.9 |
17.8 |
0.2 |
0.2 |
|
|
Table 4: XPS Results of Linoleum before and after treatment with each disinfectant.
FTIR
The absorption of disinfectant solution is a clue to get a relation with the layer of disinfectant solution traces and trapped water in the surfaces pores. FTIR technique had the finality to compare spectra and find differences of water absorption mainly by the comparison of the peak ratio of OH band in the range extended from 2750 to 3660 cm-1, considered as correlation with relative humidity. 16
Figure 5 shows the spectra of each metallic surface, when is appreciated the same chemical structure demonstrated by the same peak position due to it’s the same surface material but with differences between its peaks ratios; these differences are directly proportional with the increment of OH peak ratios.
The general comparison on metallic surfaces demonstrated that aluminum (Figure 5a) is the surface that remains less water on the surface, and Galvanized Steel (Figure 5d) keeps more quantity of water on the surface as XPS also demonstrate too.
On aluminum Bioxy + 1% and H2O2 do not have a notable OH peak at 2750 to 3660 cm- (Figure 5b) but the comparison with the spectra of aluminum without treatment suggest that Bioxy + 1% and H2O2 remove some impurities allowed to defined better the chemical structure on each material.
On the other hand, polymeric surfaces shows as metallic surfaces different peak ratios on chemicals bonds on the surface but consistent on each measurement. Bioxy H 5% has the highest peak ratio on Linoleum in comparison with other solutions. NaClO, H2O2 and Quats have the biggest peak ratios on the range of 800 to 1800 cm-1 proving as XPS those residues of products and suggesting being more aggressive removing organic components on the surface.
To promote air circulation in surfaces especially on porosity surfaces helps to avoid future injuries in polymeric surfaces. Active compound especially H2O2 and NaClO propose more adhesion in relation with the OH peak ratio. Aluminum (Figure 5a), PVC, Melamine, Vinyl shows highest absorption to H2O2, while stainless steel, galvanized steel and linoleum to NaClO.
Discussion
SEM images (Figure 1 to Figure 6) are correlated with XPS results (Table 1 to Table 7) showing consistence related to the black spots identified on metallic surfaces corresponding to traces of disinfectants, however black sports or other physical change are not present on polymeric surfaces, some effects of such disinfectants on polymeric surfaces were proving using FTIR characterization (Figure 5 and Figure 6). In general, were demonstrated that pure active compounds as H2O2, NaClO and Quats are more aggressive with metallic surfaces and produce future oxide formation 17, 18, an corrosion 19 in comparison with Bioxy products as a cocktail of active compounds which ones acts more soft on metallic surfaces. On metallic surfaces H2O2 was the most aggressive active compound while Quats shows always residues on the surfaces (Table 1 to Table 7) as other research teams have been reported 20, proposing the idea that create a protective thin layer on surfaces against microorganisms but producing damages after often applications, related to Bioxy products, Bioxy H 5% interacts with surfaces actively, especially with stainless steel (Figure 5c), galvanize steel (5d), linoleum (6a) and vinyl (6d) nevertheless we, recommended a future surface tension characterization, these results assume more resistance and surface integrity from polymeric surfaces 21 but is necessary to determine and understand adhesion, hydrophobic and hydrophilic behavior on each surface and each solution, as complementary information to describe how the surface absorbs or kept water on surface in order to suggest the disinfectant profile with less damage and efficacy.
Surface |
Atomic % of Elements |
PVC |
Silicone |
Chlorine |
Carbon |
Calcium |
Nitrogen |
Oxygen |
Sodium |
Phosphorus |
PVC Bioxy+ 1% - Before |
2.6 |
0.5 |
84.6 |
|
|
12.3 |
|
|
PVC Bioxy+ 1% - After |
1.2 |
2.3 |
80.9 |
|
|
14.6 |
1.0 |
|
PVC Bioxy+ 5% - Before |
2.7 |
0.5 |
83.0 |
|
|
13.8 |
|
|
PVC Bioxy+ 5% - After |
0.5 |
6.3 |
76.0 |
|
|
14.7 |
2.5 |
|
PVC Bioxy H 1% - Before |
3.7 |
0.4 |
82.0 |
|
|
13.9 |
|
|
PVC Bioxy H 1% - After |
1.1 |
3.0 |
76.8 |
|
1.6 |
15.5 |
2.1 |
|
PVC Bioxy H 5% - Before |
1.3 |
1.3 |
86.3 |
0.8 |
|
10.1 |
0.2 |
|
PVC Bioxy H 5% - After |
0.6 |
4.5 |
81.5 |
|
1.8 |
9.3 |
2.3 |
|
PVC Sodium Hypochlorite - Before |
3.5 |
0.6 |
82.3 |
|
|
13.3 |
0.3 |
|
PVC Sodium Hypochlorite - After |
0.9 |
3.7 |
80.7 |
0.6 |
|
12.9 |
1.2 |
|
PVC HydroPVCen Peroxide - Before |
3.6 |
1.8 |
80.3 |
0.3 |
|
13.8 |
0.2 |
|
PVC HydroPVCen Peroxide - After |
0.5 |
|
44.3 |
0.6 |
0.9 |
43.9 |
0.2 |
9.6 |
PVC Quaternary Ammonium - Before |
3.6 |
0.5 |
81.9 |
0.2 |
|
13.8 |
|
|
PVC Quaternary Ammonium - After |
0.8 |
3.1 |
85.3 |
0.2 |
2.9 |
5.7 |
2.0 |
|
Table 5: XPS Results of PVC before and after treatment with each disinfectant.
Surface |
Atomic % of Elements |
Melamine (Me) |
Silicone |
Chlorine |
Carbon |
Calcium |
Nitrogen |
Oxygen |
Sodium |
Sulfur |
Phosphorus |
Me Bioxy+ 1% - Before |
1.6 |
|
81.0 |
|
3.7 |
12.9 |
0.6 |
0.2 |
|
Me Bioxy+ 1% - After |
1.2 |
|
69.4 |
|
10.5 |
17.9 |
0.6 |
0.3 |
|
Me Bioxy+ 5% - Before |
1.2 |
|
80.3 |
|
4.1 |
13.1 |
1.0 |
0.2 |
|
Me Bioxy+ 5% - After |
0.9 |
|
70.7 |
|
9.6 |
17.1 |
1.4 |
0.4 |
|
Me Bioxy H 1% - Before |
1.7 |
|
78.4 |
|
4.9 |
14.7 |
0.1 |
0.3 |
|
Me Bioxy H 1% - After |
0.9 |
|
82.2 |
|
3.3 |
12.6 |
0.4 |
0.6 |
|
Me Bioxy H 5% - Before |
1.6 |
|
78.4 |
|
5.5 |
14.1 |
0.2 |
0.2 |
|
Me Bioxy H 5% - After |
0.5 |
0.3 |
78.7 |
|
4.9 |
12.5 |
1.5 |
1.6 |
|
Me Sodium Hypochlorite - Before |
1.6 |
|
77.8 |
|
5.6 |
14.3 |
0.4 |
0.2 |
|
Me Sodium Hypochlorite - After |
1.2 |
0.3 |
73.0 |
|
6.6 |
16.9 |
1.4 |
0.5 |
|
Me HydroMeen Peroxide - Before |
1.7 |
|
79.1 |
0.1 |
4.5 |
14.2 |
0.1 |
0.2 |
|
Me HydroMeen Peroxide - After |
1.5 |
|
76.0 |
|
3.5 |
17.7 |
|
0.2 |
1.1 |
Me Quaternary Ammonium - Before |
1.9 |
|
78.8 |
|
4.5 |
14.3 |
0.2 |
0.3 |
|
Me Quaternary Ammonium - After |
0.8 |
0.3 |
81.6 |
|
3.6 |
12.3 |
|
1.5 |
|
Table 6: XPS Results of melamine before and after treatment with each disinfectant.
Surface |
Atomic % of Elements |
Vinyl (V) |
Silicone |
Chlorine |
Carbon |
Calcium |
Nitrogen |
Oxygen |
Sodium |
V Bioxy+ 1% - Before |
2.9 |
5.2 |
73.8 |
1.4 |
|
15.0 |
1.8 |
V Bioxy+ 1% - After |
1.7 |
3.8 |
76.7 |
1.2 |
|
15.1 |
1.7 |
V Bioxy+ 5% - Before |
2.0 |
1.9 |
76.5 |
3.0 |
1.2 |
14.3 |
1.2 |
V Bioxy+ 5% - After |
0.9 |
2.3 |
76.4 |
0.4 |
1.6 |
16.7 |
1.7 |
V Bioxy H 1% - Before |
1.7 |
3.8 |
76.3 |
2.6 |
|
13.8 |
1.9 |
V Bioxy H 1% - After |
1.3 |
4.9 |
75.7 |
0.8 |
|
15.7 |
1.6 |
V Bioxy H 5% - Before |
2.1 |
5.2 |
72.9 |
2.2 |
1.5 |
14.3 |
1.7 |
V Bioxy H 5% - After |
1.4 |
3.4 |
76.9 |
0.3 |
2.2 |
14.0 |
1.8 |
V Sodium Hypochlorite - Before |
2.1 |
2.4 |
78.2 |
1.4 |
1.4 |
13.5 |
1.1 |
V Sodium Hypochlorite - After |
2.0 |
6.6 |
74.6 |
0.6 |
0.5 |
13.6 |
2.0 |
V Hydrogen Peroxide - Before |
1.9 |
5.2 |
72.5 |
1.7 |
1.7 |
14.7 |
2.2 |
V Hydrogen Peroxide - After |
2.4 |
5.1 |
74.4 |
0.4 |
1.7 |
14.5 |
1.5 |
V Quaternary Ammonium - Before |
1.9 |
4.8 |
76.1 |
1.4 |
|
13.9 |
2.0 |
V Quaternary Ammonium - After |
2.1 |
4.5 |
74.5 |
0.9 |
1.5 |
14.0 |
2.5 |
Table 7: XPS Results of Vinyl before and after treatment with each disinfectant.
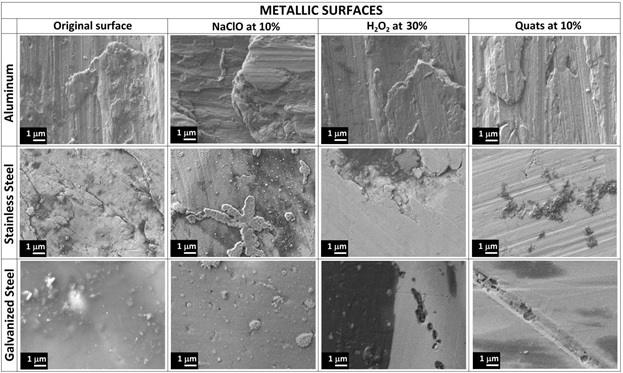
Figure 1: SEM of metallic surfaces treated with primary active compounds in comparison with the original surface without treatment (Magnification: 10000X).
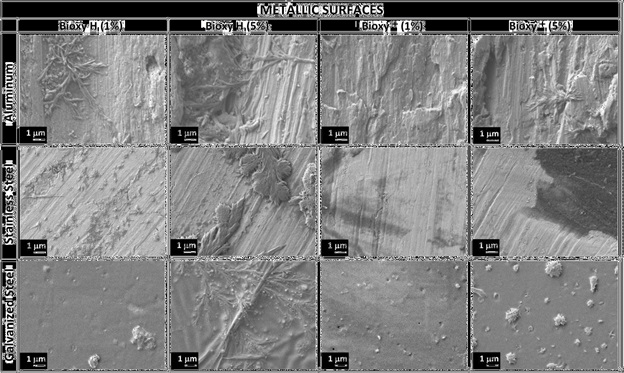
Figure 2: SEM of metallic surfaces treated with Bioxy H and Bioxy + at 1% and 5% (Magnification: 10000X).
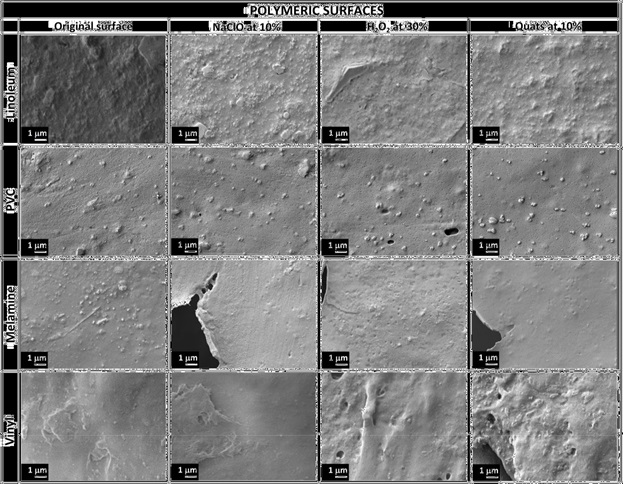
Figure 3: SEM of polymeric surfaces treated with primary active compounds in comparison with the original surface without treatment (Magnification: 10000X).
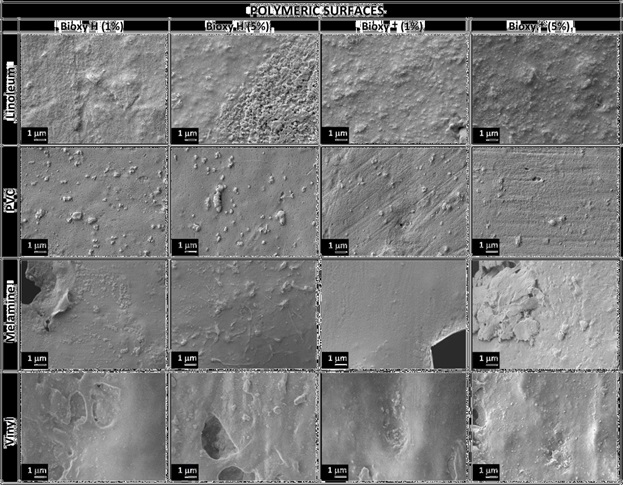
Figure 4: SEM of polymeric surfaces treated with Bioxy H and Bioxy + at 1% and 5% (Magnification: 10000X).
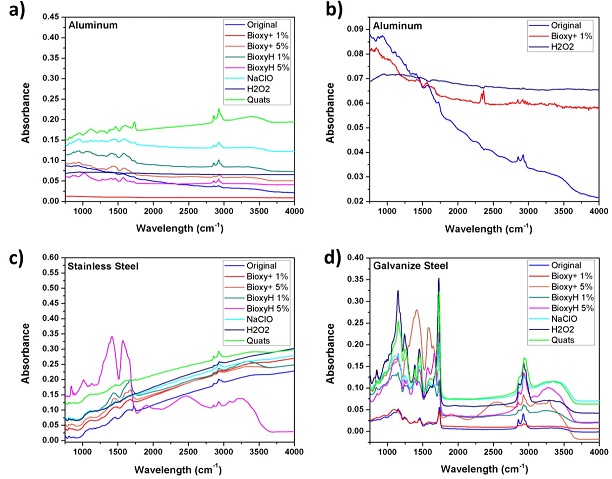
Figure 5: FTIR spectra after applied disinfectants solution on metal surfaces compared with the original surface untreated, a) Aluminum, b) comparison of Bioxy + 1% and H2O2 with the original surface withouth treatment, showing the reduction of impurities on the surface, and a flat spectra in comparison with the other solutions (5a), c) Stainless Steel and d) Galvanize Steel.
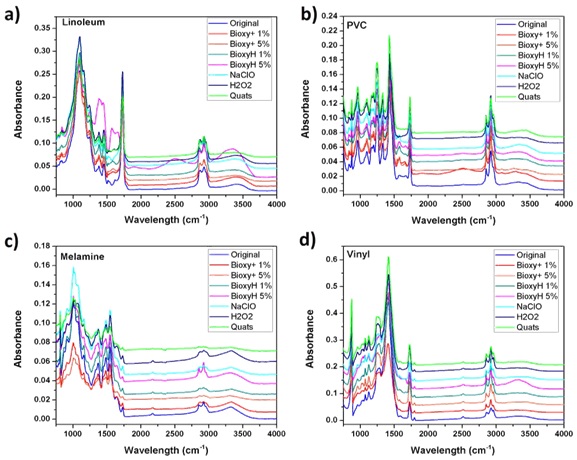
Figure 6: FTIR spectra after applied disinfectants solution on polymeric surfaces compared with the original surface untreated, a) Linoleum, b) PVC, c) Melamine and d) Vinyl.
This study probes that the concentration of disinfectants plays an important role in relation with damages on surfaces, more concentrated solutions denote more traces that trough the time produce corrosion or interaction with the chemical structure on different materials. Also we recommend strongly to dry surfaces especially porous surfaces to prevent damages and create environments appropriate to hydrophilic microorganisms.
Conclusions
- Black spots were identified since the first application of disinfectant on metallic surfaces, showing that traces of disinfectants kept on wholes and scratches decreasing the quality on materials.
- Active compounds like H2O2 and NaClO seems to be aggressive disinfectants, especially when are applied on surfaces like stainless steel and galvanize steel in comparison with aluminum, while Quats were found to be less aggressive on metallic surfaces, as well as Bioxy products which were also much less aggressive and more softer on surfaces.
- Some active compounds and Bioxy products seems to create a layer on surfaces, protecting them to microorganism, such layers are corrosive through the time, even when apparently (by SEM image) polymeric surfaces looks more resistant the absorption of aqueous solutions damage the surface due to humidity.
- The concentration, time of exposition and frequent uses of disinfectant are proportional with the damages on surfaces, however Bioxy disinfectants act efficiently and reduce the damages in comparison with the direct use of active compounds.
- Hydrophobic and hydrophilic plays an important roll protecting the time life of polymeric surfaces, avoiding the absorption on them, reducing humidity and generating air circulation on porous.
- Future surface tension characterization integrate to this study more information to understand physical properties of disinfectant solutions, how they vary and propose to the industries accurate characteristics and profiles of disinfectants that protects surfaces and kill microorganisms effectively.
Acknowledgements
All the authors thank the Fonds de recherche du Québec (FQRNT), NSERC engage grant and the groupe de recherche en sciences et technologies biomédicales (GRSTB) for support.
References
- Mims C, Dockrel HM, Goering RV, Roitt I, Wakelin D, et al. (2004) Medical Microbiology 3rd edition: Mosby. Edinburgh, London, New York
- Turnidge JD, Kotsanas D, Munckhof W, Roberts S, Bennett CM, et al. (2009) Staphylococcus aureus bacterimia: A major cause of mortality in Australia and New Zealand. Med J Aust 191: 368-373.
- Massicotte, Richard (2011) Comparative study from a chemical perspective of two-and three-step disinfection techniques to control Clostridium difficile spores. International Journal of Infection Control 7.4
- Gradinger R, Graf R, Grifka J, Lohr J (2008) Das infizierte implantat Der Orthopade 3: 257-269.
- Hellmann M, Mehta SD, Bishai DM, Mears SC, Zenilman JM (2010) The estimated magnitude and direct hospital costs of prosthetic joint infections in the United States, 1997 to 2004. J Athroplasty 25: 766-771.
- Sampedro MF, Patel R (2007) Infections associated with long-term prosthetic devices. Infect Dis Clin North Am 21: 785-819. [crossref]
- Larson EL (2016) APIC guideline for hand washing and hand antisepsis in health care settings. 1995 American Journal of Infection Control 23: 251-269.
- Rutala WA, Barbee SL, Aguiar NC, Sobsey MD, Weber DJ (2000) Antimicrobial activity of home disinfectants and natural products against potential human pathogens. Infection control and hospital epidemiology 21: 33-38.
- Brady MJ, Lisay CM, Yurkovetskiy AV, Sawan SP (2003) Persistent silver disinfectant for the environmental control of pathogenic bacteria. Am J Infect Control 31: 208-214. [crossref]
- Raffo P, Salliez AC, Collignon C, Clementi M (2007) Antimicrobial activity of a formulation for the low temperature disinfection of critical and semi-critical medical equipment and surfaces. New Microbiolology 30: 463-469.
- Taylor JH, Rogers SJ, Holah JT (1999) A comparison of the bactericidal efficacy of 18 disinfectants used in the food industry against Escherichia coli 0157:H7 and Pseudomonas aeruginosa at 10 and 20 degrees centigrade. Journal of Applied Microbiology 87: 718-725.
- Fraise AP (1999) Choosing disinfectants. J Hosp Infect 43: 255-264. [crossref]
- Ziembinska A, Szpindor M (2013) Comparison of the effectiveness of antibacterial effect of disinfectants on microorganisms isolated from the epidermis. CHEMIK. 67: 127-132.
- Bioxy Afd Inc (2008) Powdered Composition For The Generation Of Peracetic Acid And Use Thereof To Sanitize Surfaces' n. pag.
- Feng G, Cheng Y, Wang SY, Borca Tasciuc DA, Worobo RW, et al. (2015) Bacterial attachment and biofilm formation on surfaces are reduced by small-diameter nanoscale pores: how small is small enough? npj Biofilms and Microbiomes.
- Al-Abadleh HA, Grassian VH (2002) FT-IR Study of Water Adsorption on Aluminum Oxide Surfaces. Langmuir 19: 341-347.
- Austin EN, Austin HC, McKechnie TN (1993) The effect of disinfectants on 2024-T3 aluminum in the air medical helicopter. Air Med J 1: 59-62. [crossref]
- Castle JE (2008) The Composition of Metal Surfaces after Atmospheric Exposure: An Historical Perspective. The Journal of Adhesion 84: 368-388.
- Hollands W, Postlewaite J (2014) Are Your Stainless Steel Surfaces Being Corroded by Repeated Bleach Use? Controlled Environments pp: 1-4.
- Kreminski BA (2016) Comparison of commonly used surface disinfectants. Informa Exhibitions.
- Amin WM, Al-Ali MH, Al Tarawneh SK, Taha ST, Saleh MW, et al. (2009) The effects of disinfectants on dimensional accuracy and surface quality of impression materials and gypsum casts. J Clin Med Res 1: 81-89. [crossref]