Abstract
This study evaluated the effects of two lion’s mane (Hericium erinaceus) formulations, a mushroom with potential neuroprotective properties, on cognitive performance, subjective affect, serum biomarkers, and select gut microbiota in healthy adults. In a randomized, double-blind, placebo-controlled study design, 87 healthy men and women were assigned to one of three groups: 1 gram/day of MycothriveTM Nordic origin fruiting body lion’s mane (M-LM), a commercially available mycelium and fruiting body lion’s mane (MFB-LM), or placebo (PL). Blood and fecal samples, as well as measures of cognitive performance (CNS Vital Signs) and subjective affect (visual analog scales), were collected at baseline and again after 45 days. Serum biomarkers (BDNF, TNF-α, IL-6, and CRP) and gut microbiota were assessed. No outcomes in the present study were significantly altered by either LM formulation beyond changes observed in the placebo group, although some within-group changes were observed. Compared to baseline, both M-LM and MFB-LM demonstrated significant increases in focus (p=0.045 and p<0.001, respectively) and concentration (p=0.013 and p=0.003, respectively). M-LM also demonstrated significant within-group improvements in memory (p=0.004) and mental clarity (p=0.019), while MFB-LM demonstrated a trend toward improved mental clarity compared to baseline (p=0.086). M-LM also demonstrated a trend toward improved verbal memory compared to baseline (p=0.067). No meaningful changes were detected in serum biomarkers, while only the M-LM group demonstrated a significant increase in Faecalibacterium prausnitzii relative to baseline (p=0.018). Collectively, neither LM formulation produced significant effects beyond those observed in the placebo group across the primary cognitive, physiological, and microbiota-related outcomes assessed in the present study. Several aspects of cognition and subjective mental states, as well as F. prausnitzii, a butyrate-producing species linked to gut and neural health, were altered in the LM groups, however, these observations should be interpreted with caution, and future research is warranted.
Keywords
hericium erinaceus, mushroom supplement, cognition, gut-brain axis, microbiome
Introduction
Lion’s mane (LM; Hericium erinaceus) is an edible culinary and medicinal mushroom native to North America, Europe, and Asia with a long history of use in Chinese medicine for its potential neuroprotective and immune-boosting properties [1,2]. LM contains a range of bioactive compounds within its fruiting bodies and mycelia, including hericenones, erinacines, ergosterols, and β-glucan polysaccharides, all of which exhibit promising neuro-stimulatory effects [3]. Specifically, these bioactive compounds exhibit a range of pharmacological effects, including neurotrophic, antibiotic, anticarcinogenic, antidiabetic, antioxidant, immunomodulatory, and anti-neuroinflammatory activities [3-5]. In vitro studies have demonstrated that LM can stimulate the production of neurotrophins such as nerve growth factor and brain-derived neurotrophic factor (BDNF), which are essential for the growth, maintenance, and survival of neurons within the central nervous system [6,7]. Collectively, LM may be a beneficial supplement for enhancing cognitive function and reducing symptoms of neurodegenerative and mood-related disorders [1,2,8]. LM has also been shown to enhance gut microbiota diversity by increasing short-chain fatty acids (SCFA)-producing bacteria and reducing harmful species, thereby lowering inflammation, supporting gut health, and helping preserve the gut–brain axis integrity through its anti-inflammatory effects [2]. Yet, human evidence remains limited, with only a single 7-day pilot study demonstrating that 3 g/day of LM increased SCFA-producing bacterial genera [9].
Few randomized controlled trials have evaluated the acute and chronic effects of LM supplementation on cognitive function and physiological outcomes. La Monica et al. [10], recently demonstrated that an acute 1-gram dose of Nordic-grown LM improved working memory, complex attention, reaction time, and perceptions of happiness within two hours of ingestion in healthy adults. Supplementation with 1.8 g lion’s mane has also shown to acutely enhance speed performance on the Stroop task and reduce subjective stress following 28 days of supplementation [11]. Similarly, Saitsu et al. [12], reported enhanced recognition function following 12 weeks of LM supplementation (800 mg/day fruiting body extract) in healthy older adults, and Nagano et al. [13], found that 4 weeks of LM supplementation (500 mg/day fruiting body extract) reduced symptoms of depression and anxiety in women. In adults with mild cognitive impairment, Mori et al. [14], observed that 16 weeks of LM supplementation (750 mg/day) significantly improved cognitive function scores. Vigna et al. [15], further showed that 8 weeks of supplementation with a combined mycelium and fruiting body LM extract improved mood and sleep quality in adults with obesity and mood disorders, alongside an elevation in circulating pro-BDNF levels without any significant change in BDNF levels. In contrast, Grozier et al. [16], found no improvements in metabolic flexibility or cognitive performance following 4 weeks of high-dose LM supplementation (10 g/day) in healthy college-aged adults. Collectively, although initial findings from randomized controlled trials are encouraging, additional research is needed to clarify the physiological and cognitive effects of LM supplementation across diverse populations and dosing regimens.
The purpose of this investigation was to determine whether two distinct LM compositions – a Nordic origin fruiting body LM versus a combined mycelium and fruiting body LM – could positively influence cognitive performance, subjective affect, serum biomarkers, and gut microbiota in healthy adults. We hypothesized that both LM compositions would produce measurable benefits across these domains, with the Nordic origin fruiting body LM eliciting greater improvements due to its bioactive compounds.
Materials and methods
Experimental design
In a randomized, double-blind, placebo-controlled, parallel-arm study design, this study evaluated the effect of LM supplementation on cognitive performance, subjective affect, serum biomarkers, and relative abundance of select gut microbiota in healthy adults. During a screening visit, height and weight were measured using a stadiometer (Seca, Hamburg, Germany), body composition was assessed using a multifrequency bioelectrical impedance analyzer (InBody 570; InBody Co., Ltd., Seoul, South Korea), and participants underwent familiarization of the cognitive testing battery (CNS Vital Signs). Seated blood pressure and resting heart rate were assessed using an automated blood pressure analyzer (OMRON HEM-907XL). Participants then supplemented daily with one of two different LM extract supplements or placebo for 45 days. Fecal and blood samples, as well as measures of cognitive performance and subjective affect, were collected at baseline (BL) and again after 45 days (POST). All participants were instructed to maintain their usual dietary and exercise habits throughout the study and to arrive for the BL and POST visits after a normal night’s sleep and a 10-hour fast (water permitted). Participants were also asked to avoid caffeine for 12 hours, abstain from alcohol for 24 hours, and refrain from exercise for 24 hours prior to each visit. Additionally, participants were instructed to record their dietary intake for the 24 hours preceding the screening visit and to replicate this intake during the 24 hours prior to the BL and POST visits. Adherence to these instructions were verbally confirmed at the beginning of each testing visit.
Participants
An a priori power analysis was conducted using a power of 0.8, an α level of 0.05, and a moderate effect size (f = 0.25). The analysis indicated that a minimum of 42 participants would be required to detect a statistically significant effect in a design involving 3 groups and 2 time points. Ninety healthy men and women between 40 and 65 years of age were recruited to participate in the study at a single investigational site (The Center for Applied Health Sciences) between February 11 and June 25, 2025. Inclusion criteria required participants to be in good health, have a body mass index of 18.5-39.9 kg/m2, weigh at least 50 kg, and be normotensive (resting systolic blood pressure <140 mm Hg and diastolic blood pressure <90 mm Hg) with a resting heart rate <90 beats per minute. Participants were excluded if they were smokers, had any chronic illness that required continuous medical care, or were currently taking any medication. Participants were randomized based on biological sex and balanced with a Latin square design into one of three groups: MycothriveTM (a Nordic origin fruiting body lion’s mane) group (M-LM), a commercially available mycelium and fruiting body group (MFB-LM), or a placebo group (PL). Eighty-seven participants (51 women and 36 men) were included in the final analysis following the ineligibility of three individuals who did not meet the inclusion criteria. Two individuals withdrew for reasons unrelated to the study (scheduling conflict and surgery) and one individual was excluded due to supplementation non-compliance (see Figure 1 for CONSORT flow diagram). Baseline characteristics are depicted in Table 1. All procedures were approved by the Advarra IRB (Pro00083830) and registered on ClinicalTrials.gov (NCT07405957). All participants provided written informed consent prior to enrollment. The study was conducted in accordance with International Council for Harmonisation's Good Clinical Practice (ICH-GCP) guidelines.
Table 1. Baseline demographic (mean ± SD)
|
|
MFB-LM
|
M-LM
|
PL
|
Age (y) |
50.0 ± 7.3 |
48.3 ± 6.5* |
53.3 ± 7.8 |
Men (n) |
12 (40%) |
12 (42.9%) |
12 (41.4%) |
Women (n) |
18 (60%) |
16 (57.1%) |
17 (58.6%) |
Height, cm |
169.2 ± 10.6 |
172.2 ± 10.1 |
171.2 ± 7.1 |
Weight, kg |
78.6 ± 18.9 |
81.9 ± 17.0 |
78.4 ± 15.8 |
BMI (kg/m2) |
27.2 ± 5.0 |
27.5 ± 4.2 |
26.5 ± 4.3 |
Body fat (%) |
29.1 ± 9.4 |
29.1 ± 8.8 |
29.3 ± 7.7 |
Systolic BP (mm Hg) |
118.9 ± 10.4 |
116.7 ± 12.2 |
117.8 ± 11.2 |
Diastolic BP (mm Hg) |
77.1 ± 7.8 |
77.7 ± 7.6 |
76.1 ± 8.2 |
Resting Heart Rate |
67.4 ± 10.1 |
70.0 ± 8.6 |
73.4 ± 10.9 |
Note: BMI = Body mass index; BP = Blood pressure; M-LM = MycoThrive™ Lion’s Mane; MFB-LM = Mycelium and Fruiting Body Lion’s Mane; PL = Placebo; SD = Standard deviation; * = Statistically different than MFB-LM and PL |
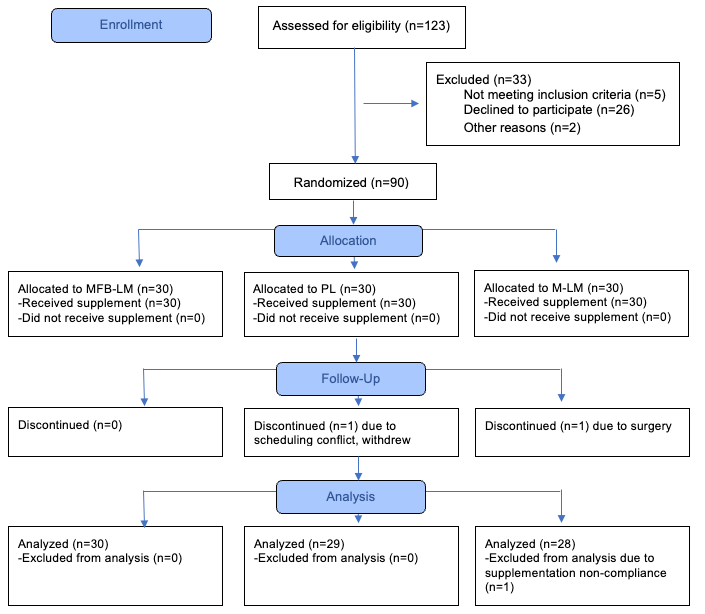
Figure 1. CONSORT flow diagram. M-LM = MycoThriveTM Lion’s Mane; MFB-LM = Mycelium and Fruiting Body Lion’s Mane; PL = Placebo
Supplementation
All supplements were prepared and packaged in coded bottles for consumption throughout the study protocol to blind both the researchers and participants. Participants were instructed to take the supplement daily with water in the morning for 45 days. Each daily serving consisted of 2 capsules identical in size and color between groups. The M-LM group supplemented with 1 gram/day of a Nordic origin fruiting body lion’s mane, which was standardized for β-Glucans and total hericenones (MycothriveTM, Applied Food Sciences, Kerrville, TX, USA). The MFB-LM group supplemented with 1 gram/day of a commercially available mycelium and fruiting body lion’s mane product and the PL group supplemented with 1 gram/day of maltodextrin. Third party testing confirmed the presence of total hericenones, erinacines, ergosterols, and β-Glucans in the study products using an analytical (U)HPLC method, and the compositional profile is displayed in Table 2. To monitor compliance, participants completed a daily check-off sheet and were required to return their capsule bottles at the POST visit for a capsule count (initial count – remaining count).
Table 2. Composition of study supplements
|
|
Total Hericenones [Hericenone+Hericene] (%)
|
Total Erinacines (%)
|
Total Ergosterols (%)
|
Total β-Glucans (%)
|
M-LM |
0.19% |
0 |
0.22% |
34% |
MFB-LM |
0.10% |
0.20% |
0.15% |
26% |
Note: M-LM = MycoThrive™ Lion’s Mane; MFB-LM = Mycelium and Fruiting Body Lion’s Mane |
Dietary intake assessment
Participants were advised to maintain their normal diet and to avoid starting any additional supplements other than those provided in the study. To characterize the participants’ diets, self-reported food records were collected before the supplementation period and during the final week of the 45-day supplementation period. Participants were instructed on how to accurately complete a 3-day dietary recall, including all food items consumed and their corresponding portion sizes. Participants were asked to document two weekdays and one weekend day within the week prior to BL and POST visits. Dietary recalls were analyzed using the Practice Better application (Green Patch Inc.) to evaluate potential differences in total energy and macronutrient intake over time. Dietary intake is reported as the average daily intake across the three recorded days.
Subjective affect
Subjective assessments of mood, focus, mental clarity, concentration (ability to concentrate), and memory (ability to remember day-to-day events) were assessed using a 10-cm visual analog scale. Scales were anchored by “Worst or Lowest Possible/Very Poor” and “Best or Highest Possible/Excellent”, and participants were asked to rate their feelings during BL and POST visits by marking on the corresponding line. The validity and reliability of the visual analog scale have been previously established [17]. Additionally, a quality-of-life questionnaire (SF-36) [18] was completed at BL and POST. This questionnaire includes 36 questions that relate to overall well-being and provides 9 separate domains (with higher scores indicating greater positive outcomes in each domain): physical functioning, role limitations due to physical health, role limitations due to emotional health, energy/fatigue, emotional well-being, social functioning, pain, general health, and health change.
Cognitive performance
Cognitive performance was assessed using CNS Vital Signs, a computerized neurocognitive testing platform that provides a validated assessment of cognitive function [19]. The assessment yields 11 standardized domain scores, including composite memory, visual memory, verbal memory (the ability to recognize, remember, and retrieve words and geometric figures), reaction time (the ability to react to a simple and increasingly complex direction set), cognitive flexibility (the ability to adapt to rapidly changing and increasingly complex set of directions), executive function (the ability to recognize rules and categories, and manage or navigate rapid decision making), motor speed (the ability to perform movements to produce and satisfy an intention towards a manual action and goal), psychomotor speed (the ability to perceive and respond to visual-perceptual information and perform motor speed and fine motor coordination), complex attention (the ability to track and respond to a variety of stimuli over lengthy periods of time and/or perform mental tasks requiring vigilance quickly and accurately), processing speed (the ability to recognize and process information), and simple attention (the ability to track and respond to a single defined stimulus over lengthy periods of time while performing vigilance and response inhibition quickly and accurately). All testing procedures were conducted in accordance with standardized administration guidelines.
Blood sampling and serum biomarker analysis
During BL and POST visits, blood samples were obtained from a superficial forearm vein using a 23G Vacutainer system and collected in 5 mL serum-separating tubes (BD Vacutainer SST; Plymouth, UK) using standard procedures following a 15-min equilibration period whereby participants were instructed to sit in a relaxed position. Blood samples were gently agitated as per manufacturer guidance, allowed to clot for 30-min, and subsequently centrifuged (Labofuge 400R, Thermo Electron Corporation) at 1500 rpm for 10-min. Thereafter, samples were checked for inadequate separation, clots, or other abnormalities and transferred by pipette for prompt storage at -80°C.
Serum concentrations of BDNF, tumor necrosis factor alpha (TNF-α), and interleukin-6 (IL-6) were later quantified by a third-party laboratory (Auburn University technicians) using commercially available ELISA kits (Abcam, Cambridge, UK; kits ab202166, ab181421, ab178013) following the manufacturers’ instructions. Analysis yielded coefficient of variation (CV) for BDNF (CV=4.6%), TNF-α (CV=17.8%), and IL-6 (CV=8.2%). C-reactive protein (CRP) was measured by LabCorp (Dublin, OH).
Safety blood work and adverse events monitoring
BL and POST serum analyses also included a lipid panel, comprehensive metabolic panel and complete blood counts to assess the safety of supplementation (LabCorp, Dulin, OH). Adverse events were monitored throughout the study, and participants were asked to report any side effects they experienced.
Fecal sample collection and microbial analysis
Fecal collection kits (Diagnostic Solutions Laboratory Alpharetta, GA) were provided to each participant. Each kit supplied a collection tube with an integrated spoon and detailed instructions for collection. Participants were asked to collect fecal samples at BL (prior to beginning the intervention) and POST (within the last 3 days of the 45-day intervention). Fecal samples were placed in a pre-labeled mailer and shipped within 24 hours of collection to a third-party laboratory for microbial analysis (Diagnostic Solutions Laboratory Alpharetta, GA). Stool from 85 individuals were analyzed. A total of 68 taxa were quantified by Diagnostic Solutions Laboratory Alpharetta. Quantification of microbial populations were conducted using quantitative polymerase chain reaction (qPCR).
Statistical analysis
A significance level of p≤0.05 was accepted as statistically significant, while p-values >0.05 to ≤0.10 were interpreted as indicating a statistical trend. The normality of all frequency distributions was assessed using the Shapiro-Wilk test. To evaluate group, time, and group × time interaction effects, 2 (Time: BL, POST) × 3 (Supplement: M-LM, MFB-LM, PL) mixed factorial analysis of variance (ANOVAs) was performed for all outcome variables. For variables demonstrating baseline differences between groups, analysis of covariance (ANCOVA) was performed using baseline values as covariates. When the assumption of sphericity was violated, Greenhouse-Geisser corrections were applied to interpret main effects and interactions. For outcomes with missing data, a mixed-effects model was implemented in GraphPad Prism. Tukey or Sidak post-hoc tests were conducted to examine pairwise comparisons between groups and/or time points. Post hoc results indicating either statistical significance (p≤0.05) or a trend (p>0.05 to ≤0.10) were noted. Cohen’s d effect sizes were calculated to determine the magnitude of differences between groups, with values ≥0.2 considered small, ≥0.5 medium, and ≥0.8 large. Differences in the incidence of adverse events between groups were analyzed using a chi-square test of association. Values exceeding ±3 standard deviations or 1.5 times the IQR (for microbiome analysis) were identified as potential outliers and were removed on a case-by-case basis following review (before statistical analyses). All statistical analyses were performed using GraphPad Prism version 10.5.0.
Results
Supplementation compliance, safety and adverse events
Overall, participants were >93% compliant with daily supplementation (except for one participant that was 50% compliant and thus removed from the analysis) with no significant difference between groups (p=0.647). There were no significant group x time differences for the lipid panel, comprehensive metabolic panel, and complete blood counts. There were also no significant differences over time or between groups for systolic blood pressure (Time: p=0.388; Group: p=0.736; Group x Time: p=0.437), diastolic blood pressure (Time: p=0.357; Group: p=0.887; Group x Time: p=0.788), resting heart rate (Time: p=0.811; Group: p=0.205; Group x Time: p=0.884), or body mass (Time: p=0.582; Group: p=0.635; Group x Time: p=0.714). Additionally, there were no significant differences between groups for reports of adverse events (X2 = 0.84, p=0.656). A total of four participants in the MFB-LM group reported six adverse events (e.g., flatulence, loose stool, frequent bowel movements, abdominal cramping, intermittent dizziness, vertigo). In the PL group, two participants reported four adverse events (e.g., constipation, difficulty concentrating, lightheadedness, body aches), and in the M-LM group, two participants reported two adverse events (e.g., abdominal pain and headache). All adverse events were mild in nature and were deemed unrelated to the study product or study procedures.
Dietary recalls
There were no differences over time or between groups for average total calories (BL: MFB-LM=1670 ± 349 kcal/day, M-LM=1637 ± 401 kcal/day, PL=1614 ± 386 kcal/day; POST: MFB-LM=1698 ± 420 kcal/day, M-LM=1716 ± 463 kcal/day, PL=1547 ± 457 kcal/day; Time: p=0.765; Group: p=0.513; Group x Time: p=0.235), carbohydrate intake (BL: MFB-LM=168.4 ± 57.9 g/day, M-LM=153.3 ± 60.4 g/day, PL=158.4 ± 58.1 g/day; POST: MFB-LM=171.0 ± 64.7 g/day, M-LM=160.0 ± 60.5 g/day, PL=159.4 ± 73.7 g/day; Time: p=0.610; Group: p=0.598; Group x Time: p=0.770), fat intake (BL: MFB-LM=73.8 ± 19.9 g/day, M-LM=71.6 ± 25.8 g/day, PL=71.8 ± 19.4 g/day; POST: MFB-LM=71.0 ± 17.7 g/day, M-LM=73.0 ± 25.6 g/day, PL=67.4 ± 21.4 g/day; Time: p=0.513; Group: p=0.820; Group x Time: p=0.614), or protein intake (BL: MFB-LM=88.7 ± 30.1 g/day, M-LM=90.5 ± 29.2 g/day, PL=80.3 ± 25.8 g/day; POST: MFB-LM=84.0 ± 29.3 g/day, M-LM=93.8 ± 33.9 g/day, PL=75.1 ± 26.4 g/day; Time: p=0.402; Group: p=0.144; Group x Time: p=0.269).
Subjective affect
Subjective affect outcomes are depicted in Table 3. There were no significant group differences for Focus (Group: p=0.513; Group x Time: p=0.135), but there was a significant main effect of time (p<0.001). Post hoc analysis indicated that MFB-LM and M-LM were significantly greater at POST compared to BL (MFB-LM: p=0.045, d=0.45; M-LM: p<0.001, d=0.75). There were no significant group differences for Mental Clarity (Group: p=0.390; Group x Time: p=0.473), but there was a significant main effect of time (p<0.001). Post hoc analysis indicated that M-LM was significantly greater at POST compared to BL (p=0.019, d=0.53) while MFB-LM trended towards being greater at POST compared to BL (p=0.086, d=0.40). There were no significant group differences for Concentration (Group: p=0.391; Group x Time: p=0.110), but there was a significant main effect of time (p<0.001). Post hoc analysis indicated that MFB-LM and M-LM were significantly greater at POST compared to BL (MFB-LM: p=0.003, d=0.62; M-LM: p=0.013, d=0.55). There were no significant group differences for Memory (Group: p=0.264; Group x Time: p=0.348), but there was a significant main effect of time (p<0.001). Post hoc analysis indicated that M-LM was significantly greater at POST compared to BL (p=0.004, d=0.62). Lastly, there were no significant differences over time or between groups for Mood (Time: p=0.116; Group: p=0.792; Group x Time: p=0.291).
Table 3. Composition of study supplements
|
BL |
POST |
Time
p-value |
Group x time
p-value |
Mood (cm) |
|
|
|
|
MFB-LM |
7.3 ± 1.3 |
7.5 ± 1.0 |
0.116 |
0.291 |
M-LM |
7.0 ± 1.4 |
7.5 ± 0.8 |
PL |
7.4 ± 1.3 |
7.4 ± 1.5 |
Focus (cm) |
|
|
|
|
MFB-LM |
6.6 ± 1.5 |
7.2 ± 1.2* |
<0.001 |
0.135 |
M-LM |
6.2 ± 1.5 |
7.2 ± 1.0* |
PL |
6.9 ± 1.5 |
7.2 ± 1.3 |
Mental clarity (cm) |
|
|
|
MFB-LM |
6.7 ± 1.5 |
7.3 ± 1.5# |
<0.001 |
0.473 |
M-LM |
6.4 ± 1.4 |
7.1 ± 1.4* |
PL |
7.1 ± 1.5 |
7.4 ± 1.4 |
Concentration (cm) |
|
|
|
MFB-LM |
6.4 ± 1.7 |
7.3 ± 1.0* |
<0.001 |
0.110 |
M-LM |
6.5 ± 1.5 |
7.3 ± 1.2* |
PL |
7.2 ± 1.5 |
7.3 ± 1.3 |
Memory (cm) |
|
|
|
|
MFB-LM |
6.9 ± 1.8 |
7.4 ± 1.2 |
<0.001 |
0.348 |
M-LM |
6.3 ± 1.9 |
7.3 ± 1.4* |
PL |
7.2 ± 1.8 |
7.6 ± 1.3 |
Note: BL = Baseline timepoint; M-LM = MycoThrive™ Lion’s Mane; MFB-LM = Mycelium and Fruiting Body Lion’s Mane; POST = End of the 45-day intervention; * = Significant difference (p<0.05) from BL; # = Trend for difference (p<0.10) from BL |
CNS vital signs
CNS Vital Signs outcomes are depicted in Table 4. There was a trend for an interaction for Visual Memory (Group x Time: p=0.054) and a significant main effect of time (p=0.028). Post hoc analysis between groups indicated that M-LM had a significantly greater score at BL compared to PL (p=0.035, d=0.71). Therefore, an ANCOVA was performed with baseline values entered as covariates. Following adjustment, no significant between-group differences were observed (p=0.308, η²=0.022). Post hoc analysis over time showed that M-LM had a significantly lower score at POST compared to BL (p=0.020, d=0.53). There were no significant group differences for Verbal Memory (Group: p=0.920; Group x Time: p=0.411), but there was a significant main effect of time (p=0.014). Post hoc analysis indicated a trend that M-LM was significantly greater at POST compared to BL (p=0.067, d=0.44). There was a significant group difference for Complex Attention (p=0.040), but no significant main effect of time or interaction (Time; p=0.594; Group x Time: p=0.751). Post hoc analysis indicated that PL had a significantly lower score at POST compared to M-LM (p=0.033, d=0.67). There was a group trend for Cognitive Flexibility (p=0.076), but there were no significant differences over time or between groups (Time: p=0.374; Group x Time: p=0.722). Post hoc analysis indicated a trend for greater PL scores compared to M-LM at POST (p=0.089, d=0.52). There were no significant differences over time or between groups for Composite Memory (Time: p=0.959; Group: p=0.563; Group x Time: p=0.153), Reaction Time (Time: p=0.727; Group: p=0.697; Group x Time: p=0.655), Executive Function (Time: p=0.356; Group: p=0.172; Group x Time: p=0.749), Motor Speed (Time: p=0.198; Group: p=0.515; Group x Time: p=0.978), Psychomotor Speed (Time: p=0.247; Group: p=0.598; Group x Time: p=0.935), Processing Speed (Time: p=0.956; Group: p=0.184; Group x Time: p=0.950), or Simple Attention (Time: p=0.495; Group: p=0.675; Group x Time: p=0.697).
Table 4. Cognitive performance assessment using CNS Vital Signs
|
BL |
POST |
Time
p-value |
Group x time
p-value |
Composite memory (au) |
|
|
|
MFB-LM |
97.7 ± 8.1 |
96.4 ± 9.5 |
0.959 |
0.153 |
M-LM |
99.2 ± 7.2 |
98.3 ± 7.5 |
PL |
95.5 ± 10.1 |
97.6 ± 10.1 |
Visual memory (au) |
|
|
|
MFB-LM |
45.5 ± 5.4 |
43.8 ± 5.7 |
0.028 |
0.054 |
M-LM |
47.8 ± 4.3 |
45.0 ± 5.6* |
PL |
44.2 ± 5.8⸸ |
44.9 ± 5.4 |
Verbal memory (au) |
|
|
|
MFB-LM |
52.2 ± 4.6 |
52.6 ± 5.1 |
0.014 |
0.411 |
M-LM |
51.4 ± 5.4 |
53.4 ± 4.4# |
PL |
51.3 ± 5.5 |
52.6 ± 5.8 |
Reaction time (ms) |
|
|
|
MFB-LM |
651 ± 64 |
651 ± 68 |
0.727 |
0.655 |
M-LM |
663 ± 85 |
672 ± 89 |
PL |
667 ± 95 |
663 ± 96 |
Cognitive flexibility (au) |
|
|
|
MFB-LM |
50.9 ± 6.7 |
51.0 ± 6.6 |
0.374 |
0.722 |
M-LM |
46.9 ± 10.0 |
47.3 ± 10.0 |
PL |
50.6 ± 7.5 |
52.0 ± 7.8$ |
Executive function (au) |
|
|
|
MFB-LM |
51.8 ± 6.6 |
51.9 ± 6.7 |
0.356 |
0.749 |
M-LM |
47.9 ± 9.8 |
48.4 ± 9.7 |
PL |
51.2 ± 7.6 |
51.8 ± 8.9 |
Motor speed (au) |
|
|
|
|
MFB-LM |
111.7 ± 11.7 |
110.7 ± 12.0 |
0.198 |
0.978 |
M-LM |
108.9 ± 13.8 |
107.6 ± 13.6 |
PL |
111.1 ± 10.5 |
111.3 ± 13.9 |
Psychomotor speed (au) |
|
|
|
MFB-LM |
172.9 ± 15.0 |
172.1 ± 15.6 |
0.247 |
0.935 |
M-LM |
168.9 ± 19.2 |
167.6 ± 19.0 |
PL |
170.3 ± 17.1 |
168.4 ± 18.3 |
Complex attention (au) |
|
|
|
MFB-LM |
3.8 ± 2.6 |
3.7 ± 2.3 |
0.594 |
0.751 |
M-LM |
4.9 ± 3.1 |
5.0 ± 3.2 |
PL |
3.6 ± 2.9 |
3.1 ± 2.4⸸ |
Processing speed (au) |
|
|
|
MFB-LM |
60.4 ± 7.6 |
60.6 ± 8.0 |
0.956 |
0.950 |
M-LM |
59.0 ± 11.2 |
59.1 ± 9.0 |
PL |
56.5 ± 9.3 |
56.2 ± 9.6 |
Simple attention (au) |
|
|
|
MFB-LM |
39.7 ± 0.7 |
39.8 ± 0.5 |
0.495 |
0.697 |
M-LM |
39.7 ± 0.5 |
39.6 ± 0.7 |
PL |
39.7 ± 0.6 |
39.8 ± 0.5 |
Note: au = Arbitrary units; BL = Baseline timepoint; M-LM = MycoThrive™ Lion’s Mane; MFB-LM = Mycelium and Fruiting Body Lion’s Mane; ms = Milliseconds; POST = End of the 45-day intervention; * = Significant difference (p<0.05) from BL; # = Trend for difference (p<0.10) from BL; ⸸ = Significant difference (p<0.05) from M-LM; $ = Trend for difference (p<0.10) from M-LM |
Quality-of-life questionnaire
Quality-of-life (SF-36) outcomes are depicted in Table 5. There was a trend for time (p=0.086) and group (p=0.100) for Energy/Fatigue, but no significant interaction (Group x Time: p=0.354). Post hoc analysis between groups indicated that PL was significantly greater than M-LM at BL (p=0.033, d=0.65). Therefore, an ANCOVA was performed with baseline values entered as covariates. Following adjustment, no significant between-group differences were observed (p=0.925, η²=0.001). There were no post hoc differences over time for Energy/Fatigue. There was a trend for time (p=0.054) for Emotional Well-being, but no significant group differences (Group: p=0.104; Group x Time: p=0.998). However, there were no post hoc differences over time for Emotional Well-being. There were no differences over time or between groups for Physical Functioning (Time: p=0.759; Group: p=0.837; Group x Time: p=0.900), Role Limitations due to Physical (Time: p=0.354; Group: p=0.170; Group x Time: p=0.670), Role Limitations due to Emotional (Time: p=0.178; Group: p=0.910; Group x Time: p=0.980), Social Functioning (Time: p=0.580; Group: p=0.994; Group x Time: p=0.604), Pain (Time: p=0.515; Group: p=0.588; Group x Time: p=0.657), General Health (Time: p=0.488; Group: p=0.168; Group x Time: p=0.724), or Health Change (Time: p=0.753; Group: p=0.628; Group x Time: p=0.250).
Table 5. Quality-of-life questionnaire
|
BL |
POST |
Time
p-value |
Group x time
p-value |
Physical functioning (%) |
|
|
MFB-LM |
96.7 ± 6.4 |
96.5 ± 6.2 |
0.759 |
0.900 |
M-LM |
96.4 ± 6.4 |
96.6 ± 6.9 |
PL |
97.5 ± 3.5 |
97.1 ± 5.5 |
Role limitations due to physical health (%) |
|
|
MFB-LM |
99.2 ± 4.6 |
98.3 ± 6.3 |
0.354 |
0.670 |
M-LM |
94.6 ± 15.7 |
91.7 ± 21.9 |
PL |
96.4 ± 11.2 |
96.4 ± 8.9 |
Role limitations due to emotional health (%) |
|
|
MFB-LM |
93.3 ± 18.4 |
96.7 ± 10.2 |
0.178 |
0.980 |
M-LM |
92.6 ± 19.2 |
95.2 ± 14.9 |
PL |
94.1 ± 15.9 |
96.4 ± 10.5 |
Energy/Fatigue (%) |
|
|
|
MFB-LM |
69.7 ± 18.4 |
72.7 ± 13.0 |
0.086 |
0.254 |
M-LM |
67.1 ± 18.6 |
72.0 ± 16.4 |
PL |
78.0 ± 14.9⸸ |
77.3 ± 14.6 |
Emotional well-being (%) |
|
|
|
MFB-LM |
83.6 ± 11.0 |
85.6 ± 10.1 |
0.054 |
0.998 |
M-LM |
83.1 ± 13.5 |
85.3 ± 9.0 |
PL |
88.0 ± 11.3 |
90.1 ± 8.2 |
Social functioning (%) |
|
|
|
MFB-LM |
95.0 ± 8.4 |
96.3 ± 8.1 |
0.580 |
0.604 |
M-LM |
96.0 ± 10.2 |
95.1 ± 10.4 |
PL |
95.1 ± 9.2 |
96.4 ± 7.5 |
Pain (%) |
|
|
|
|
MFB-LM |
86.7 ± 14.2 |
89.4 ± 10.3 |
0.515 |
0.657 |
M-LM |
85.2 ± 13.5 |
84.8 ± 17.5 |
PL |
87.4 ± 13.1 |
87.9 ± 13.3 |
General health (%) |
|
|
|
MFB-LM |
84.0 ± 10.7 |
84.2 ± 11.9 |
0.488 |
0.724 |
M-LM |
80.5 ± 16.2 |
80.0 ± 16.0 |
PL |
87.7 ± 11.7 |
85.5 ± 15.0 |
Health change (%) |
|
|
|
MFB-LM |
63.3 ± 20.5 |
60.0 ± 16.9 |
0.753 |
0.250 |
M-LM |
60.7 ± 18.5 |
66.1 ± 21.7 |
PL |
66.1 ± 21.7 |
66.1 ± 20.7 |
Note: BL = Baseline timepoint; M-LM = MycoThrive™ Lion’s Mane; MFB-LM = Mycelium and Fruiting Body Lion’s Mane; POST = End of the 45-day intervention; ⸸ = Significant difference (p<0.05) from M-LM |
Serum biomarkers
Serum biomarkers are depicted in Table 6. There was a significant main effect of time for BDNF (p=0.001), but no group differences (Group: p=0.666; Group x Time: p=0.685). Post hoc analysis indicated that BDNF levels were significantly lower at POST compared to BL in M-LM (p=0.045, d=0.47). However, this was likely due to a low outlier (<3SDs) in the M-LM group. There were no differences over time or between groups for TNF-α (Time: p=0.239; Group: p=0.619; Group x Time: p=0.532), IL-6 (Time: p=0.934; Group: p=0.540; Group x Time: p=0.717), or CRP (Time: p=0.161; Group: p=0.171; Group x Time: p=0.269).
Table 6. Serum biomarkers
|
BL |
POST |
Time
p-value |
Group x time
p-value |
TNF-α (ng/mL) |
|
|
|
|
MFB-LM |
0.120 ± 0.060 |
0.118 ± 0.041 |
0.239 |
0.532 |
M-LM |
0.117 ± 0.047 |
0.127 ± 0.050 |
PL |
0.126 ± 0.059 |
0.138 ± 0.083 |
IL-6 (pg/mL) |
|
|
|
|
MFB-LM |
40.29 ± 3.99 |
40.06 ± 5.25 |
0.934 |
0.717 |
M-LM |
40.97 ± 5.84 |
40.39 ± 5.90 |
PL |
41.41 ± 6.73 |
42.06 ± 8.33 |
BDNF (ng/mL) |
|
|
|
|
MFB-LM |
2.886 ± 0.438 |
2.818 ± 0.406 |
0.001 |
0.685 |
M-LM |
2.992 ± 0.503 |
2.909 ± 0.468* |
PL |
2.886 ± 0.452 |
2.844 ± 0.454 |
CRP (mg/L) |
|
|
|
|
MFB-LM |
1.2 ± 1.5 |
1.0 ± 1.2 |
0.161 |
0.269 |
M-LM |
1.1 ± 0.9 |
1.3 ± 1.3 |
PL |
2.1 ± 2.5 |
1.4 ± 1.6 |
Note: BDNF = Brain-derived neurotrophic factor; BL = Baseline timepoint; CRP = C-reactive protein; IL-6 = Interleukin-6; M-LM = MycoThrive™ Lion’s Mane; MFB-LM = Mycelium and Fruiting Body Lion’s Mane; POST = End of the 45-day intervention; TNF-α = Tumor necrosis factor alpha; * = Significant difference (p<0.05) from BL |
Microbial analysis
Largely, there were no major effects observed for the microbial taxa measured, except for Faecalibacterium prausnitzii. There was a significant main effect of time for F. prausnitzii (p=0.018), but no group differences (Group: p=0.680; Group x Time: p=0.344). Post hoc analysis showed that a significant increase was observed only within the M-LM group (p = 0.015; Figure 2).
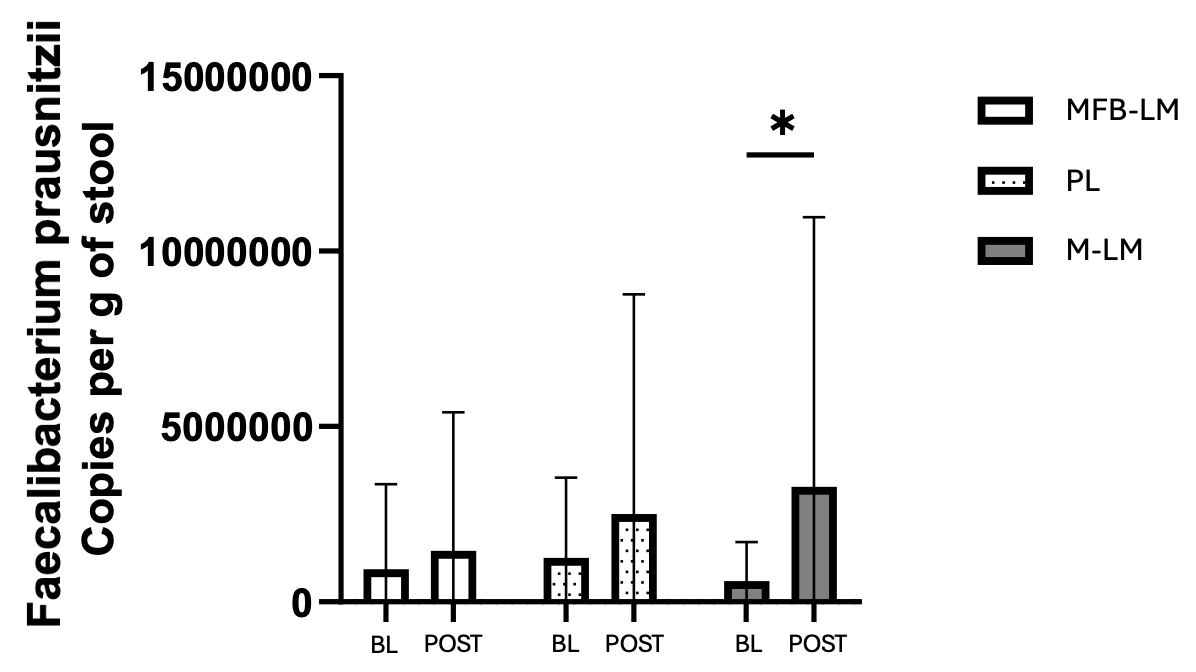
Figure 2. Faecalibacterium prausnitzii. BL = Baseline timepoint; M-LM = MycoThriveTM Lion’s Mane; MFB-LM = Mycelium and Fruiting Body Lion’s Mane; PL = Placebo; POST = End of the 45-day intervention; * = Significant difference (p<0.05) from BL
Discussion
This randomized, double-blind, placebo-controlled, parallel-arm trial evaluated the effects of two distinct LM compositions on cognitive performance, subjective affect, serum biomarkers, and gut microbiota profiles in healthy adults. Both supplements were well tolerated, with no meaningful alterations in clinical or blood safety markers. No outcomes in the present study were significantly altered by either LM formulation beyond changes observed in the placebo group. Most measures remained unchanged throughout the 45-day supplementation period, although some within-group changes were observed. Compared to baseline, both M-LM and MFB-LM demonstrated significant within-group increases in focus and concentration. M-LM also demonstrated significant within-group improvements in memory and mental clarity, while MFB-LM demonstrated a trend toward improved mental clarity compared to baseline. M-LM also demonstrated a trend toward improved verbal memory following the 45-day intervention. Although M-LM showed a reduction in BDNF compared to baseline, this effect appeared to be driven by a single low outlier. Gut microbiota analyses revealed that only M-LM significantly increased F. prausnitzii from baseline.
LM mushrooms may influence both cognitive function and mood through various biological mechanisms. Hericenones and erinacines can cross the blood–brain barrier, stimulating nerve growth factor synthesis, and exhibit anti-neuroinflammatory and neuroprotective effects [1,2,6,20,21]. In the present study, cognitive performance was evaluated using the comprehensive and validated CNS Vital Signs battery. While no interactions were observed, the M-LM group improved visual and verbal memory compared to baseline and had significantly greater complex attention compared with placebo at post-intervention. Previous acute LM interventions have shown cognitive benefits including quicker performance on the Stoop test [11], quicker mathematical computations via increased attempts during Serial 7s task, quicker reaction time during the N-Back task, and faster responses to Go (action stimulus) in the Go/No-Go task [10]. After 12 weeks of supplementing with 800 mg/day of LM fruiting body extract, Saitsu et al. [12], observed improved recognition function on the Mini Mental State Examination, with no corresponding changes on the Benton Visual Retention Test or the Standard Verbal Paired Associate Learning Test. In adults with mild cognitive impairment, Mori et al. [14], found that 16 weeks of LM supplementation (750 mg/day) significantly improved cognitive function as assessed by the Revised Hasegawa Dementia Scale. Collectively, prior studies have used a wide range of cognitive assessments, making cross-study comparisons challenging.
Despite growing interest in LM as a neuroactive compound, research evaluating its effects on cognition and affective states remains limited. In this study, no changes were observed in quality-of-life scores (SF-36). While no interactions were observed for subjective affect, both M-LM and MFB-LM increased in focus and concentration compared to baseline. Only M-LM increased in memory and mental clarity, with MFB-LM demonstrating a trend toward improved mental clarity compared to baseline. In an acute study by La Monica et al. [10], LM improved subjective ratings of “happiness compared to peers” and “getting the most out of everything” at 60 and 120 minutes post-ingestion, while no significant effects were observed for mood, focus, mental clarity, concentration, productivity, and stress tolerance. LM may selectively modulate subjective, domain-specific cognitive and affective states, and more research is needed to evaluate different formulations and dosing strategies.
LM has demonstrated potential neuroprotective effects and can stimulate the expression of neurotrophins such as nerve growth factor and BDNF. BDNF is a neuropeptide that supports neuronal health and adaptability by promoting cell survival, growth, and synaptic connectivity. Its activity is central to synaptic development and plasticity and has been linked to improvements in learning, memory, and stress resilience [22]. In mice, LM supplementation has been shown to modulate BDNF signaling and restore BDNF levels following stress exposure [23,24]. To date, only one study has examined the effects of LM supplementation on circulating pro-BDNF (the precursor protein) and BDNF concentrations, with Vigna et al. [15], reporting an increase in circulating pro-BDNF but no significant change in BDNF levels in adults with obesity after 8 weeks. The current study did not observe increases in BDNF with either LM composition. Additionally, this is the first investigation to assess other inflammatory markers including TNF-α, IL-6, and CRP, and no effects of supplementation were detected.
Crosstalk between the gut and brain has long been recognized in both health and disease, with the gut microbiota serving as a key conduit of communication along the gut-brain axis [25]. LM supplementation may promote gut health by increasing microbiota diversity, reducing systemic inflammation, and improving metabolic and gastrointestinal health [2]. Polysaccharides within LM, including β-glucans, stimulate SCFA-producing bacteria and enhance the synthesis of SCFAs [9,26]. This is beneficial because SCFAs, particularly butyrate, support gut barrier integrity, reduce inflammation, and contribute to metabolic and immune homeostasis [2]. Evidence from both animal models and in vitro studies demonstrates that fermentation of LM prompts an increase in the abundance of these beneficial genera in the gut [2]. In healthy adults, Xie et al. [9], demonstrated that 7-days of Hericium erinaceus powder supplementation (3 g/day) led to a significant increase in SCFA-producing genera, including Kineothrix alysoides, Gemmiger formicilis, Fusicatenibacter saccharivorans, Eubacterium rectale, and F. prausnitzii. In the current study, while no interactions were observed for gut microbiota analyses, only the M-LM group had significant increases in F. prausnitzii compared to baseline following 45 days of supplementation. Collectively, these findings highlight the potential of LM to modulate gut microbial composition; however, additional well-controlled studies are needed to further elucidate its effects on the gut microbiota and related health outcomes.
Several limitations of the present study should be acknowledged. First, the intervention period was limited to 45 days, which may not have been sufficient to detect meaningful changes in cognitive performance, circulating biomarkers, or gut microbiota composition, particularly in a healthy population without baseline impairments. Second, although dietary intake was monitored and participants were instructed to maintain consistent behaviors throughout the study, dietary intake was self-reported and therefore subject to reporting inaccuracies or alterations that may influence gut microbiota outcomes. The study also did not assess SCFA concentrations or other mechanistic markers that may help explain potential gut-brain interactions associated with LM supplementation. Future studies should incorporate longer supplementation periods, larger sample sizes, broader microbiome analyses, mechanistic biomarkers, and diverse populations to better characterize the cognitive, physiological, and gut microbiota effects of LM supplementation.
Conclusion
In conclusion, neither LM formulation produced significant effects beyond those observed in the placebo group across the primary cognitive, physiological, and microbiota-related outcomes assessed in the present study. However, several within-group improvements in measures of subjective affect and cognition were observed following supplementation with both M-LM and MFB-LM. No meaningful changes were detected in serum biomarkers, while only the M-LM group demonstrated a significant increase in F. prausnitzii relative to baseline. Collectively, these findings suggest that LM may influence several aspects of cognition and subjective mental states, as well as F. prausnitzii, a butyrate-producing species linked to gut and neural health. However, in the absence of significant placebo-controlled effects, these observations should not be interpreted as evidence of treatment efficacy, and future research is warranted.
Author contributions
Conceptualization and design, M.B.L. and T.N.Z.; Methodology, M.B.L. and T.N.Z.; Acquisition of data, M.B.L., T.N.Z., and T.O.K.; Data analysis, M.B.L., T.N.Z., A.M.G., and T.O.K.; Writing and editing, A.M.G. and M.B.L, and T.O.K.; Funding acquisition, T.N.Z. and M.B.L.; All authors have read and agreed to the published revision of the manuscript.
Funding information
This work was supported by Applied Food Sciences, Inc. The funder played a role in study design but was not involved in data collection, interpretation, or analysis.
Competing interests
T.N.Z. has no direct conflict in terms of financial or business interests related to the topic of this publication. He has received funding from dietary supplement companies for research, honoraria for speaking at conferences, and fees for writing articles and consulting. A.M.G. has no direct conflict in terms of financial or business interests related to this manuscript. He has received research funding and compensation for advisory roles from dietary supplement companies. All other authors report no conflicts of interest.
References
- Spelman K, Sutherland E, Bagade A (2017) Neurological activity of lion’s mane (hericium erinaceus). J Restorat Med 6: 19-26.
- Menon A, Jalal A, Arshad Z, A Nawaz F, Kashyap R (2025) The benefits, side effects, and uses of hericium erinaceus as a supplement: A systematic review. Front Nutr 12: 1641246. [Crossref]
- Friedman M (2015) Chemistry, nutrition, and health-promoting properties of hericium erinaceus (lion’s mane) mushroom fruiting bodies and mycelia and their bioactive compounds. J Agric Food Chem 63: 7108-7123. [Crossref]
- Wu F, Zhou C, Zhou D, Ou S, Zhang X, et al. (2018) Structure characterization of a novel polysaccharide from hericium erinaceus fruiting bodies and its immunomodulatory activities. Food Funct 9: 294-306. [Crossref]
- Wei J, Li JY, Feng XL, Zhang Y, Hu X, et al. (2023) Unprecedented neoverrucosane and cyathane diterpenoids with anti-neuroinflammatory activity from cultures of the culinary-medicinal mushroom hericium erinaceus. Molecules 28: 6380. [Crossref]
- Kawagishi H, Shimada A, Shirai R, Okamoto K, Ojima F, et al. (1994) Erinacines A, B and C, strong stimulators of nerve growth factor (NGF)-synthesis, from the mycelia of Hericium erinaceum. Tetrahedron Lett. 35: 1569-1572.
- Zhang CC, Cao CY, Kubo M, Harada K, Yan XT, et al. (2017) Chemical constituents from Hericium erinaceus promote neuronal survival and potentiate neurite outgrowth via the TrkA/Erk1/2 pathway. Intl J Mol Sci 18: 1659. [Crossref]
- Nieman KM, Zhu Y, Tucker M, Koecher K (2024) The role of dietary ingredients in mental energy–a scoping review of randomized controlled trials. J Am Nutr Assoc 43: 167-182. [Crossref]
- Xie XQ, Geng Y, Guan Q, Ren Y, Guo L, et al. (2021) Influence of short-term consumption of hericium erinaceus on serum biochemical markers and the changes of the gut microbiota: A pilot study. Nutrients 13: 1008. [Crossref]
- La Monica MB, Raub B, Ziegenfuss EJ, Hartshorn S, Grdic J, et al. (2023) Acute effects of naturally occurring guayusa tea and nordic lion’s mane extracts on cognitive performance. Nutrients 15: 5018. [Crossref]
- Docherty S, Doughty FL, Smith EF (2023) The acute and chronic effects of lion’s mane mushroom supplementation on cognitive function, stress and mood in young adults: A double-blind, parallel groups, pilot study. Nutrients 15: 4842. [Crossref]
- Saitsu Y, Nishide A, Kikushima K, Shimizu K, Ohnuki K (2019) Improvement of cognitive functions by oral intake of hericium erinaceus. Biomed Res 40: 125-131. [Crossref]
- Nagano M, Shimizu K, Kondo R, Hayashi C, Sato D, et al. (2010) Reduction of depression and anxiety by 4 weeks Hericium erinaceus intake. Biomed Res 31: 231-237. [Crossref]
- Mori K, Inatomi S, Ouchi K, Azumi Y, Tuchida T (2009) Improving effects of the mushroom Yamabushitake (Hericium erinaceus) on mild cognitive impairment: A double‐blind placebo‐controlled clinical trial. Phytother Res 23: 367-372. [Crossref]
- Vigna L, Morelli F, Agnelli GM, Napolitano F, Ratto D, et al. (2019) Hericium erinaceus improves mood and sleep disorders in patients affected by overweight or obesity: Could circulating pro‐bdnf and bdnf be potential biomarkers? Evid Based Complement Alternat Med 2019: 7861297. [Crossref]
- Grozier CD, Alves VA, Killen LG, D Simpson J, O’neal EK, et al. (2022) Four weeks of hericium erinaceus supplementation does not impact markers of metabolic flexibility or cognition. Intl J Exerc Sci 15: 1366-1380. [Crossref]
- Lee KA, Hicks G, Nino-Murcia G (1991) Validity and reliability of a scale to assess fatigue. Psychiatry Res 36: 291-298. [Crossref]
- Ware Jr JE, Gandek B (1998) Overview of the sf-36 health survey and the international quality of life assessment (iqola) project. J Clin Epidemiol 51: 903-912. [Crossref]
- Gualtieri CT, Johnson LG (2006) Reliability and validity of a computerized neurocognitive test battery, cns vital signs. Arch Clin Neuropsychol 21: 623-643. [Crossref]
- Hu JH, Li IC, Lin TW, Chen WP, Lee LY, et al. (2019) Absolute bioavailability, tissue distribution, and excretion of erinacines in hericium erinaceus mycelia. Molecules 24: 1624. [Crossref]
- Zhang CC, Yin X, Cao CY, Wei J, Zhang Q, et al. (2015) Chemical constituents from hericium erinaceus and their ability to stimulate ngf-mediated neurite outgrowth on pc12 cells. Bioorg Med Chem Lett 25: 5078-5082. [Crossref]
- Wang CS, Kavalali ET, Monteggia LM (2022) Bdnf signaling in context: From synaptic regulation to psychiatric disorders. Cell 185: 62-76. [Crossref]
- Chiu CH, Chyau CC, Chen CC, Lee LY, Chen WP, et al. (2018) Erinacine a-enriched hericium erinaceus mycelium produces antidepressant-like effects through modulating bdnf/pi3k/akt/gsk-3β signaling in mice. Int J Mol Sci 19: 341. [Crossref]
- Rupcic Z, Rascher M, Kanaki S, Köster RW, Stadler M, et al. (2018) Two new cyathane diterpenoids from mycelial cultures of the medicinal mushroom hericium erinaceus and the rare species, hericium flagellum. Int J Mol Sci 19: 740. [Crossref]
- Aburto MR, Cryan JF (2024) Gastrointestinal and brain barriers: Unlocking gates of communication across the microbiota–gut–brain axis. Nat Rev Gastroenterol Hepatol 21: 222-247. [Crossref]
- Tian B, Geng Y, Xu T, Zou X, Mao R, et al. (2022) Digestive characteristics of Hericium erinaceus polysaccharides and their positive effects on fecal microbiota of male and female volunteers during in vitro fermentation. Front Nutr 9: 858585. [Crossref]