Introduction
Being under Portuguese rule for about 450 years, a considerable proportion of Goans over a period, acquired Portuguese lifestyle where the diet is predominantly of non-vegetarian type and other habits such as smoking, consumption of alcohol is common. Goa being gifted with a lengthy coastal belt, fishes and other sea food items form the major part of Goan's everyday diet.
In Goa, there are three major communities viz., Hindu, Christian and Muslim. Some affluent sections of people of these communities exhibit more or less a western trend with regard to dietary and other habits. Being a tourist place of international fame, many national and international tourists visits Goa. They especially, the western tourists also have influenced Goan lifestyle to a considerable extent.
Animal products like eggs, chicken, mutton, etc. are routinely consumed by majority of people while pork is consumed mainly by Christian community. Paddy is cultivated to a considerable extent in Goa although vegetables are sparsely grown here. Hence, rice and fish form the staple diet of a Goan. Thus, majority of Goan population consumes non-vegetarian diet on a routine basis.
The liquor is cheaply and readily available here compared to other parts of the country. Hence, consumption of alcohol is very common and other habits like smoking is also part of the lifestyle of several Goans.
These lifestyle or environmental factors may contribute considerably towards the induction of breast cancer either directly or may interact with the genetic factors in a multifarious way and induce malignancy. It’s interesting to study the relation of these dietary and other habits with the high incidence of breast cancer in the state. Further, to find out whether these habits have any effect on the genome stability is also important in knowing the etiology of the disease. Once, some insight is gained into the cause of the disease, preventive measures can be advised.
The concept that specific dietary chemical substances act as tumour initiators, co-carcinogens or tumour producing agents [1] provided the framework for many future studies of nutrition and carcinogenesis. Several points must be considered in evaluating the relationship of environemental exposure to breast cancer. Among these considerations are the mechanism of tumorigenesis, timing of environemental exposure and genetic modulation of exposure [2].
The observations in human migrants and rodent models strongly suggest that additional efforts should be directed to understand the combined effects of diet, nutrition, endocrine status and genetic factors during adolescence and how they may combine to modify breast development and susceptibility to cancer. Genetic testing, as part of a comprehensive risk assessment of women, could greatly facilitate the evaluation of dietary and other breast cancer prevention strategies [3]. Hence, it is recommended to carry out studies on the genetic makeup of the breast cancer patients along with the environmental factors.
In order to have a better understanding of the effect of dietary and environmental factors on human genome and the induction of breast cancer, this preliminary study was undertaken.
Case control studies are relatively simple and economical to carry out and are increasingly used to investigate causes of diseases, especially rare diseases. They include people with a disease (or other outcome variable) of interest and a suitable group of people unaffected by the disease or outcome variable. The occurrence of the possible cause is compared between cases and controls. Data concerning more than one point in time are collected. Case-control studies are thus longitudinal, in contrast to cross-sectional studies [3].
Case-control studies have been called retrospective studies since the investigator is looking backwards from the disease to a possible cause. This can be confusing because the terms retrospective and prospective are increasingly being used to describe the timing of data collection in relation to the current date. In this sense a case-control study may be either retrospective, when all the data dealt with the past or progressive in which data collection continues with the passage of time [3].
A case-control study begins with the selection of cases which should represent all the cases from a specified population. The most difficult task is to select controls so as to sample the exposure prevalence in the population that generated the cases. Furthermore, the choice of controls and cases must not be influenced by exposure status which should be determined in the same manner for both. It is not necessary for cases and controls to be all-inclusive; in fact, they can be restricted to any specified subgroup such as old people, males or females [3].
The controls should represent people who would have been designated study cases if they had developed the disease. Ideally, case-control studies use new (incident) cases to avoid the difficulty of disentangling factors related to causation and survival, although studies have often been conducted using prevalence data (for example, case-control studies of congenital malformations) [3].
An important aspect of case control studies is the determination of the start and duration of exposure for cases and controls. In the case-control design, the exposure status of the cases is usually determined after the development of the disease (retrospective data) and usually by direct questioning of the affected person or a relative or friend. The informant's answers may be influenced by knowledge about the hypothesis under investigation or the disease experience itself. Exposure is sometimes determined by biochemical measurements (e.g. lead in blood or cadmium in urine), which can be affected by the disease. This problem can be avoided if accurate exposure data are available from an established recording system (e.g. employment records in industry) or if the case control study is carried out prospectively so that exposure data are collected before the development of the disease [3].
The association of an exposure and a disease is measured in a case control-study by calculation of the Odds Ratio (OR) which is the ratio of the odds (chance) of exposure among the cases to the odds in favour of exposure among the controls [3].
Odds Ratio (Cross-product ratio): From a case control study, we can derive what is known as Odds Ratio (OR) which is a measure of the strength of the association between risk factor and outcome. Odds ratio is closely related to relative risk. The derivation of odds ratio is based on three assumptions:
- The disease being investigated must be relatively rare. In fact, the majority of chronic diseases have a low incidence in the general population;
- b) The cases must be representative of those with disease and
- c) The controls must be representative of those without the disease.
The odds ratio is the cross product of the entries in Table 1 which is represented below:
Table 1. Using the data in Table 1, the odds ratio would be estimated as follows: Odds ratio = ad/bc [4].
|
Disease |
|
Yes |
No |
Exposed |
a |
b |
Non-exposed |
c |
d |
Using the data in Table 1, the odds ratio would be estimated as follows:
Odds ratio = ad/bc [4].
The advantages and disadvantages of case control studies are summarized below
Advantages
- 1. Relatively easy to carry out
- 2. Rapid and inexpensive (compared with cohort studies)
- 3. Require comparatively few subjects
- 4. Particularly suitable to investigate rare disease / s about which little is known. But a disease which is rare in the general population (Eg: Leukaemia in adolescents) may not be rare in special exposure group (Eg: prenatal X-rays).
- 5. No risk to subjects
- 6. Allows the study of several different aetiological factors (e.g. smoking, physical activity and
- personality characteristics in myocardial infarction)
- 7. Risk factors can be identified. Rational prevention and control programmes can be established.
- 8. No attrition problems, because case control studies do not require follow-up of individuals into the future
- 9. Ethical problems minimal
Disadvantages
- Problems of bias, e.g. relies on memory or past records, the accuracy of which may be uncertain; validation of information obtained is difficult or sometimes impossible
- 2. Selection of an appropriate control group may be difficult
- 3. We cannot measure incidence and can only estimate the relative risk
- 4. Do not distinguish between causes and associated factors
- 5. Not suited to the evaluation of therapy or prophylaxis of disease
- 6. Another major concern is the representativeness of cases and controls
Material and Methods
Design: A retrospective case control design has been used for collecting a target number of 100 cases and an equal number of 100 controls. In this preliminary study, the sample size is small, and extrapolation is done to achieve uniformity between the cases and controls.
'Case' definition: Newly diagnosed histologically confirmed breast cancer cases who reported to the Departments of Radiotherapy and Surgery of Goa Medical College at Bambolim, Manipal Goa Cancer and General Hospital at Dona Paula, Hospicio Hospital at Margao and Vrundavan Hospital at Mapuca are considered as cases.
'Control' definition: Healthy females from three villages viz Bicholim, Pole and Santacruz and 4 towns viz. Margao, Panjim, Vasco and Ponda in Goa are considered as controls.
Data collection from cases and controls: Data as recalled by the subjects on approximate quantities of the consumption of usual dietary habits at breakfast, lunch, evening snacks / tea time and at dinner and of other habits such as smoking, consumption of alcohol, tobacco and pan masala of the subject was collected following a questionnaire. Odd's ratio was calculated to study the risk associated with the dietary and other habits. The database was created in MS-Word 2000 and in MS-Excel 2000.
Results
The age wise and locally wise distribution of the subjects of this study is represented in Table 2. The average age of the cases and controls was 53.8 ± 8.28 years and 52.7 ± 7.42 years respectively. The dietary pattern among cases and controls is represented in Table 3 and Figure 1.
Table 2. Distribution of cases and controls by age and residence distribution
Age group (Years) |
Cases |
Controls |
(Five years) |
Urban |
Rural |
Urban |
Rural |
25-35 |
7 |
|
9 |
|
36-45 |
8 |
12 |
10 |
15 |
46-55 |
12 |
10 |
13 |
4 |
56-65 |
14 |
16 |
10 |
18 |
66-75 |
13 |
8 |
15 |
6 |
Total |
54 |
46 |
57 |
43 |
% |
54 |
46 |
57 |
43 |
Mean ± SD |
53.8±8.28 (Years) |
|
52.7±7.42 (Years) |
|
Table 3. Dietary pattern among cases and controls
Type |
Cases |
Controls |
Odds Ratio |
Vegetarian |
21 |
11 |
1.00 |
Non-Vegetarian |
79 |
89 |
2.15 |
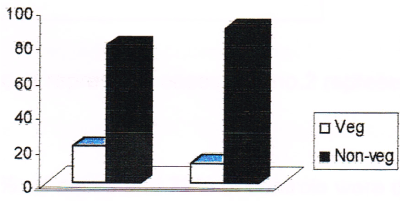
Figure 1. Dietary pattern among cases and controls. (Note: no. 1 represents cases and no. 2 represents controls in the figure).
21% of cases and 11 % of controls prefer only vegetarian type of diet while 79% of cases and 89% of controls prefer non-vegetarian type of food. Thus, non-vegetarians have twice the risk of breast cancer than that of vegetarians (odds ratio 2.15). The consumption pattern of vegetables among cases and controls is given in Table 4 and in Figure 2.
Table 4. Consumption pattern of vegetables among cases and controls
Frequency |
Cases |
Controls |
Odds Ratio |
Daily once |
36 |
72 |
1.00 |
Daily twice |
64 |
28 |
4.57 |
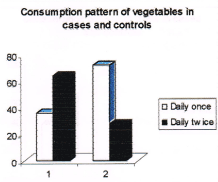
Figure 2. Consumption pattern of vegetables among cases and controls. (Note: no. 1 represents cases and no. 2 represents controls in the figure).
36% of cases and 72% of controls were consuming vegetables daily once compared to 64% of cases and 28% of controls who consumed daily twice. Those subjects who consumed vegetables daily twice had a four and half times higher protective effect from breast cancer over those who consumed daily once (Odds ratio 4.57). The consumption pattern of fruits among cases and controls is given in Table 5 and Figure 3.
Table 5. Consumption pattern of fruits among cases and controls.
Frequency |
Cases |
Controls |
Odds Ratio |
> Intake |
36 |
87 |
1.00 |
< Intake |
64 |
13 |
11.89 |
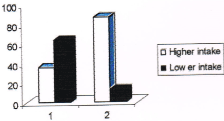
Figure 3. Consumption pattern of fruits among cases and controls. (Note: no. 1 represents cases and no. 2 represents controls in the figure).
36% of cases and 87% of controls were having higher intake of fruits compared to 64% of cases and 13 % of controls who were having less intake. Those subjects who were having higher intake of fruits had a 12 times higher protective effect from breast cancer over those who were having less intake (Odds ratio 11.89). The consumption pattern of curds and buttermilk among cases and controls is given in Table 6 and Table 7 respectively.
Table 6. Consumption pattern of curds among cases and controls. (Note: (>intake) = frequency of intake is once in 2 days. (<intake) = frequency of intake less than once in 2 days.
Frequency |
Cases |
Controls |
Odds Ratio |
> Intake |
29 |
30 |
1.00 |
< Intake |
71 |
70 |
1.05 |
Table 7. Consumption pattern of buttermilk among cases and controls. (Note: (>intake) = frequency of intake is once in 2 days. (<intake) = frequency of intake less than once in 2 days.
Frequency |
Cases |
Controls |
Odds Ratio |
> Intake |
29 |
28 |
1.00 |
< Intake |
71 |
72 |
1.05 |
In case of consumption of curds and buttermilk by cases and controls, no significant differences were observed. However, a protective effect is indicated for those subjects who were having higher intake compared to those who were having less intake (Odds ratio 1.05 for curds and 1.05 for buttermilk). The consumption pattern of butter among cases and controls is given in Table 8 and in Figure 4.
Table 8. Consumption pattern of butter among cases and controls. (Note: (>intake) = frequency of intake is once in 2 days. (<intake) = frequency of intake less than once in 2 days.
Frequency |
Cases |
Controls |
Odds Ratio |
> Intake |
36 |
15 |
1.00 |
< Intake |
64 |
85 |
3.82 |
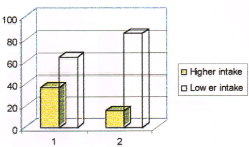
Figure 4. Consumption pattern of butter among cases and controls. (Note: no. 1 represents cases and no. 2 represents controls in the figure).
36% of cases and 15% of controls were having higher intake of butter compared to 64% of cases and 85 % of controls who were having less intake. Those subjects who were having higher intake of butter had a 3.8 times higher protective effect from breast cancer over those who were having less intake (Odds ratio 3.81). The consumption pattern of cheese among cases and controls is given in Table 9 and in Figure 5.
Table 9. Consumption pattern of cheese among cases and controls. (Note: (>intake) = frequency of intake is once in 2 days. (<intake) = frequency of intake less than once in 2 days).
Frequency |
Cases |
Controls |
Odds Ratio |
> Intake |
36 |
4 |
1.00 |
< Intake |
64 |
96 |
13.5 |
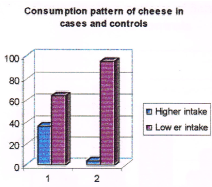
Figure 5. Consumption pattern of cheese among cases and controls. (Note: no. 1 represents cases and no. 2 represents controls in the figure).
36% of cases and 4% of controls were having higher intake of cheese compared to 64% of cases and 96% of controls who were having less intake. Those subjects who were having higher intake of cheese had a 13.5 times higher risk from breast cancer over those who were having less intake (Odds ratio 13.5)
The consumption pattern of fish among cases and controls is given in Table 10 and in Figure 6.
Table 10. Consumption pattern of fish among cases and controls. (Note: (>intake) = frequency of intake is once in 2 days. (<intake) = frequency of intake less than once in 2 days.
Frequency |
Cases |
Controls |
Odds Ratio |
Non-consumers |
22 |
10 |
1.00 |
Consumers |
78 |
90 |
2.54 |
> Intake |
64 |
60 |
2.06 |
< Intake |
14 |
30 |
4.71 |
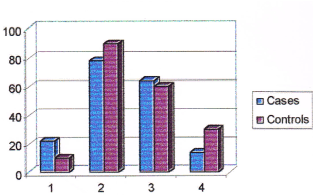
Figure 6. Consumption pattern of fish among cases and controls. (Note: No. 1 represents non-consumers,No. 2 represents consumers, No. 3 represents higher intake, No. 4 represents lower intake).
22% of cases and 10% of controls were not consuming fishes while 78% of cases and 90% of controls were consuming fishes. Among consumers, 64 % of cases and 60 % of controls were having higher intake of fish compared to 14 % of cases and 30% of controls who were having less intake. Those subjects who were having higher intake of fish had a 4.71 times higher risk of breast cancer over those who were having less intake (Odds ratio 4.71). The consumption pattern of chicken among cases and controls is given in Table 11 and in Figure 7.
Table 11. Consumption pattern of chicken among cases and controls. (Note: (>intake) = frequency of intake is once in 2 days. (<intake) = frequency of intake less than once in 2 days.
Frequency |
Cases |
Controls |
Odds Ratio |
Non-consumers |
29 |
28 |
1.00 |
Consumers |
71 |
72 |
1.05 |
> Intake |
36 |
35 |
1.00 |
< Intake |
35 |
37 |
1.09 |
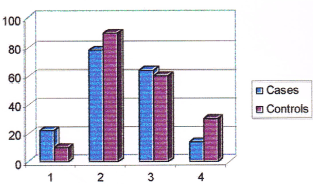
Figure 7. Consumption pattern of chicken among cases and controls. (Note: No. 1 represents non-consumers, No. 2 represents consumers, No. 3 represents higher intake, No. 4 represents lower intake).
29% of cases and 28% of controls were not consuming chicken while 71% of cases and 72% of controls were consuming chicken. Among consumers, 36% of cases and 35% of controls were having higher intake of chicken compared to 35% of cases and 37% of controls who were having less intake. No significant difference was observed among cases and controls with regards to intake of chicken. Both the groups had a similar risk of breast cancer due to higher intake of chicken (Odds ratio 1.094). The consumption pattern of mutton among cases and controls is given in Table 12.
Table 12. Consumption pattern of mutton among cases and controls. Note: (>intake) = frequency of intake is once in 2 days. (<intake) = frequency of intake less than once in 2 days.
Frequency |
Cases |
Controls |
Odds Ratio |
Non-consumers |
29 |
55 |
1.00 |
Consumers |
71 |
45 |
2.99 |
> Intake |
36 |
7 |
9.75 |
< Intake |
35 |
38 |
1.75 |
29% of cases and 55% of controls were not consuming mutton while 71% of cases and 45% of controls were consuming mutton. Among consumers, 36% of cases and 7% of controls were having higher intake of mutton compared to 35% of cases and 38% of controls who were having less intake. Those subjects who were having higher intake of mutton had a 9.753 times higher risk of breast cancer over those who were having less intake (Odds ratio 9.753). The consumption pattern of beef among cases and controls is given in Table 13 and in Figure 8.
Table 13. Consumption pattern of beef among cases and controls. Note: (>intake) = frequency of intake is once in 2 days. (<intake) = frequency of intake less than once in 2 days.
Frequency |
Cases |
Controls |
Odds Ratio |
Non-consumers |
71 |
85 |
1.00 |
Consumers |
29 |
15 |
2.31 |
> Intake |
1 |
4 |
3.34 |
<Intake |
28 |
11 |
3.04 |
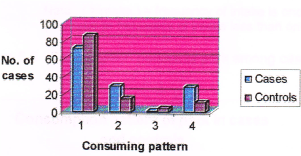
Figure 8. Consumption pattern of beef among cases and controls. (Note: No. 1 represents non-consumers, No. 2 represents consumers, No. 3 represents higher intake, No. 4 represents lower intake).
71% of cases and 85% of controls were not consuming beef while 29% of cases and 15% of controls were consuming beef. Among consumers, 1% of cases and 4% of controls were having higher intake of beef compared to 28% of cases and 11 % of controls who were having less intake. Those subjects who were having higher intake of beef had a 3.341 times higher risk of breast cancer over those who were having less intake (Odds ratio 3.341). The consumption pattern of pork among cases and controls is given in Table 14 and in Figure 9.
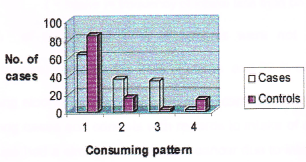
Figure 9. Consumption pattern of pork among cases and controls. (Note: No. 1 represents non-consumers, No. 2 represents consumers, No. 3 represents higher intake, No. 4 represents lower intake).
Table 14. Consumption pattern of pork among cases and controls. (Note: (>intake) = frequency of intake is once in 2 days. (<intake) = frequency of intake less than once in 2 days).
Frequency |
Cases |
Controls |
Odds Ratio |
Non-consumers |
64 |
85 |
1.00 |
Consumers |
36 |
15 |
3.19 |
> Intake |
34 |
2 |
22.57 |
< Intake |
2 |
13 |
1.12 |
64% of cases and 85% of controls were not consuming pork while 36% of cases and 15% of controls were consuming pork. Among consumers 34 % of cases and 2 % of controls were having higher intake of pork compared to 2% of cases and 13 % of controls who were having less intake. Those subjects who were having higher intake of pork had a 22.578 times higher risk of breast cancer over those who were having less intake (Odds ratio 22.578). The consumption pattern of alcohol among cases and controls is given in Table 15.
Table 15. Consumption pattern of alcohol among cases and controls. Note: (>intake) = frequency of intake is once in 2 days. (<intake) = frequency of intake less than once in 2 days).
Frequency |
Cases |
Controls |
Odds Ratio |
Non-consumers |
79 |
77 |
1.00 |
Consumers |
21 |
23 |
1.12 |
79 % of cases and 77 % of controls were not having alcohol (non-consumers) compared to 21% of cases and 23% of controls who were having alcohol (consumers). No significant difference was observed among cases and controls with regards to intake of alcohol. Both the groups had a similar risk of breast cancer due to intake of alcohol (Odds ratio 1.12). The consumption pattern of pan-masala among cases and controls is given in Table 16.
Table 16. Consumption pattern of pan-masala among cases and controls. (Note: (>intake) = frequency of intake is once in 2 days. (<intake) = frequency of intake less than once in 2 days).
Frequency |
Cases |
Controls |
Odds Ratio |
Non-consumers |
93 |
87 |
1.00 |
Consumers |
7 |
13 |
1.99 |
93% of cases and 87% of controls were not consuming pan-masala while 7% of cases and 13% of controls were consuming pan-masala. Consumers had a 1.9852 times higher risk of breast cancer over those who were non-consumers (Odds ratio 1.9852). The consumption pattern of gutkha among cases and controls is given in Table 17.
Table 17. Consumption pattern of gutkha among cases and controls. (Note: (>intake) = frequency of intake is once in 2 days. (<intake) = frequency of intake less than once in 2 days).
Frequency |
Cases |
Controls |
Odds Ratio |
Non-consumers |
93 |
99 |
1.00 |
Consumers |
7 |
1 |
7.45 |
93% of cases and 99% of controls were not consuming gutkha while 7% of cases and 1% of controls were consuming gutkha. Consumers had a 7.4516 times higher risk of breast cancer over those who were nonconsumers (Odds ratio 7.4516). In case of smoking habit, 15 controls were smoking and none of the cases were smoking.
Discussion
The dietary habits and other habits of cases and controls observed in the present study are much similar to a western lifestyle.
Consumption of dairy products such as butter and cheese are high in breast cancer cases compared to the females in the control group. The risk due to consumption of butter is high when it was used more than weekly once. The risk due to consumption of cheese in the present study shows increased risk with more frequent consumption. This is in par with the observations of Talamini [1]. Buttermilk and curd is taken along with main meals. There was no significant variation observed between the cases and controls while considering intake and frequency. Increasing frequency of curd consumption offers protection against breast cancer.
Seasonal fruits and vegetables like mangoes, tomatoes, yellow pumpkin etc. are normally consumed by cases as well as controls. Present study shows a consistent and statistically significant inverse association between breast cancer risk and vegetarian food habits. Results of many epidemiological studies provide some evidence of protective effect in relation to intake of vegetables, fruits or both and decreased risk of breast cancer.
Trichopoulou [2] observed that vegetable consumption and fruit consumption were independently associated with statistically significant reduction of breast cancer. Franceschi [3] and Favero et al. [4] found that high intake of raw vegetables exerts a protection against development of breast cancer. However, two case control studies [5,6] (Graham et al. Potischman et al. shows no association of breast cancer risk with consumption of cruciferous vegetables.
Of six case control studies three [7,8,9] report inverse association of total fruit intake with breast cancer risk whereas three studies [10,11,6] suggested that no protection was immerged for breast cancer with intake of fruits. Of the studies showing inverse association; one [7] shows significant protective effect of high fruit consumption and one [8] observed weak association with a reduction in risk for fruit consumption. Epidemiological studies suggest that a high vegetable diet may reduce risk for breast cancer and may also improve prognosis after the diagnosis of breast cancer [12].
Fish consumption is very common in cases and in controls. Fish intake gives significant protection against breast cancer risk [13]. No association is detected between overall fish consumption and breast cancer although poached fish consumption is inversely related with breast cancer risk [14].
Consumption of meat (chicken, mutton, beef, pork) is common in cases and controls. Intake of red meat was not significantly associated with breast cancer, but processed meat was associated with breast cancer risk. Direct association is found with the intake of pork meat and breast cancer [4]. Risk increased with higher consumption of meat and no apparent association with fish. The meta analysis of 19 studies shows risk of meat consumption for breast cancer [15]. Higher consumption of fried meat was associated with increased risk of breast cancer [16].
Alcohol consumption is quite common in Goan cases and controls. Alcohol consumption and its link with the risk of breast cancer needs to be examined. In a Spanish case control study, even moderate levels of alcohol intake increased the risk of breast cancer [17]. Recently, data from a large cohort of Dutch women [18] showed that alcohol drinkers had a 30% increased risk of breast cancer.
Alcohol intake may influence early as well as late stages of breast neoplasia [19]. Alcohol consumption may influence the disposition or function of essential nutrients or other dietary factors considered cancer protective such as fruits and vegetables. Zhang et al. [20] reported that women consuming more than 15g/d of alcohol and whose intake of the water-soluble vitamin folate was less than 300 microgram/d exhibited a significantly higher relative risk for breast cancer compared with women consuming the same levels of alcohol along with folate levels greater than 500 microgram/d. Low to moderate alcohol consumption, in contrast to heavy drinking may not necessarily results in tissue folate depletion. Yet, in combination with low folate intake, ethanol and/or its primary metabolite acetaldehyde may alter folate or methionine metabolism so than an imbalance in DNA methylation or in DNA damage/repair processes could lead to DNA instability or inappropriate gene expression.
Although the evidence is weak, there are recent reports indicating that the relationship of alcohol with breast cancer could differ according to genotype for several metabolizing enzymes. Park et al. [21] reported that alcohol consuming premenopausal women lacking he glutathione-S-transferase genes (GTSM1 and GTSM2) were at 5.3-fold greater risk for breast cancer compared with women with the genes, suggesting that the lack of these genes combined with intake of alcohol leads to a decreased capacity of tissues to detoxify reactive lipid peroxidases, free radicals and cytotoxic products of alcohol metabolism.
Some experiments provide evidence that ethanol may be a weak tumour promoter. Although ethanol has not been identified as a genotoxic carcinogen, it can act as a co carcinogen by influencing physiological processes associated with the initiation and promotion stages of carcinogenesis. Ethanol might stimulate the initiation stage by stimulating cytochrome P450 mediated conversion of inactive carcinogens to metabolites capable of binding to and damaging cell DNA, by inhibiting phase II enzyme mediated carcinogen detoxification or by impairing liver clearance of carcinogens, resulting in their increased circulation among extrahepatic tissues. Ethanol and its highly reactive metabolite acetaldehyde also have been linked to the inhibition of repair of carcinogen induced DNA damage. Acetaldehyde is genotoxic and may bind to and interfere with the function of other important cell macromolecules.
Data from experiments using human breast cells provide support for an action of ethanol on early and late processes associated with breast carcinogenesis. The formation of chemical carcinogen-DNA damage is recognized as an important prerequisite to the initiation of chemically induced mammary tumorigenesis and if not efficiently repaired, may during cell replication lead to genetic lesions contributing to cancer development. Fan et al. [22-27] detected an ethanol induced downregulation of the tumour suppressor BRCA1 expression and an upregulation of Estrogen Receptor (ER) alpha expression and transcriptional activity in human breast cancer cell cultures. Modest increases in circulating estradiol levels associated with alcohol consumption may have a disproportionately greater impact on breast cancer development due to concurrent effects of ethanol in increasing responsiveness of breast cancer cells to estraiol and in suppressing BRCA1 mediated maintenance of genome stability.
Conclusion
It is observed that the subjects who preferred vegetarian diet had a protective effect over those subjects who consumed non-vegetarian diet. In case of other habits, the subjects with higher intake of alcohol were at more risk of breast cancer compared to those who had lower intake.
References
- 1.Berenblum I (1941) The mechanism of carcinogenesis: a study of the significance of cocarcinogenic action and related phenomena. Cancer Research 1: 807-814.
- 2.Wolff MS, Weston A (1997) Breast cancer risk and environmental exposures. Environmental Health Perspectives 105: 891-896.
- 3.Beaglehole R, Bonita R, Kjellstrom T (1993) Basic Epidemiology World Health Organization, Geneva, 38.
- 4. Park (2017) Preventive and Social Medicine .
- 5. Clinton SK (1997) Diet, anthropometry and breast cancer: Integration of experimental and epidemiologic approaches. J Nutr 127: 916S-920S.
- 6. Talamini R, La Vecchia C, Decarli A, Franceschi S, Gratoni E, et al. (1984) Social factors, diet and breast cancer in a Northern Italian population. Br J Cancer 49: 723-729.
- 7. Trichopoulou A, Katsouyanni K, Stuver S, Tzala L, gnardellis C, et al. (1995) Consumption of olive oil and specific food groups in relation to breast cancer risk in Greece. JNCI 87: 110-116.
- 8. Franceschi S, Favero A, La Vecchia C, Negri E, Dal Maso L, et al. (19995) Influence of food groups and food diversity on breast cancer risk in Italy. Int J Cancer 63: 785-789.
- 9. Favero A, Parpinel M, Franceschi S (1996) Diet and risk of breast cancer: major findings from an Italian case control study, Biomed. Pharmacother 52: 109-115.
- 10. Graham S, Marshall J, Mettlin C, Rzepka T, Nemoto T et al. (1982) Diet in the epidemiology of breast cancer. Am J Epidemiol 116: 68-75.
- 11. Potischman N, Swanson CA, Coates RJ, Gammon MD, Brogan DR, et al. (1999) Intake of food groups and associated micronutrients in relation to risk of early stage breast cancer. Int J Cancer 82: 315-321.
- 12. Landa MC, Frago N, Tres A (1994) Diet and the risk of breast cancer in Spain. Eur. J. Cancer Prev 3: 313-320.
- 13. Freudenheim JL, Marshall JR, Vena JE, Laughlin R, Brasure JR, et al. (1996) Premenopausal breast cancer risk and intake of vegetables, fruits and related nutrients. JNCI 88: 340-348.
- 14. Ronco A, DeStefani P, Deneo-Pellegrini H, Mendilaharsu M, Leborgne F et al. Vegetables, fruits and related nutrients and risk of breast cancer: a case control study in Urugway. Nutr Cancer 35: 111-119.
- 15. Rohan TE, McMichael AJ, Baghurst PA (1988) Population based case control study of diet and breast cnacer in Australia. Am J epidemiology 128: 478-489.
- 16. Negri E, La Vecchia C, Franceschi S, D' Avenzo B, Talamini R, et al. (1996) Intake of selected micronutrients and the risk of breast cancer. Cancer 65: 140-144.
- 17. Rock CL, Flatt SW, Wright FA, Faerber S, Newman V, et al. (1997) Responsiveness of carotenoids to a high vegetable diet intervention designed o prevet breast cancer recurrence. Cancer Epidemiol Biomarkers Prev 6: 617-623.
- 18. Franceschi S, Favero A, La Vecchia C, Negri E, Dal Maso L, et al. (1995) Influence of food groups and food diversity on breast cancer risk in Italy. Int J Cancer 63: 785-789.
- 19. Vatten LJ, Solvoll K, Loken EB (1990) Frequency of meat and fish intake and risk of breast cancer in a prospective study of 14,500 Norwegian women. Int J Cancer 46: 12-15.
- 20. Boyd NF, Martin LJ, Noffel M, Lockwood GA, Tritchler DL (1993) A meta-analysis of studies of dietary fat and breast cancer risk. Br J Cancer 68: 627-636.
- 21. Jarvinen R, Knekt P, Seppanen R, Teppo L (1997) Diet and breast cancer risk in a cohort of Finnish women. Cancer Letter 114: 251-253.
- 22. Martin Moreno JM, Boyle P, Gorgojo L et al. (1995) Alcohol and breast cancer: results from the Netherlands cohort study. American Journal of Epidemiology 141: 907-915.
- 23. van der Brandt PA, Goldbohm RA, van't Veer P (1995) Alcohol and breast cancer: results from the Netherlands cohort study. American Journal of Epidemiology 141: 907-915.
- 24. Boyd N, Lockwood G, Byng J, Tritchler D, Yaffe M, et al. (1992) Mammographic densities and breast cancer risk. Cancer Epidemiol Biomarkers Prev 16: 67-72.
- 25. Zhang S, Hunter D, Hankinson S (1999) A prospective study of folate intake and the risk of breast cancer JAMA 281: 1632-1637.
- 26. Park s, Yoo K, Lee S (2000) Alcohol consumption, glutathione S transferase M1 and T1 genetic polymorphisms and breast cancer risk. Pharmacogenetics 10 : 301-309.
- 27. Fan S, Meng Q, Gao B (2000) Alcohol stimulates estrogen receptor signalling in human breast cancer cell lines. Cancer Res 60: 5635-5639.


