The current study was used to determine the sensorial attributes of chapattis prepared by the blending of different crops (wheat, barley and chickpea) to develop composite flour. In this milieu, chapattis were used to explore their therapeutic role against hyperglycemic patients. Means values of treatments T1, T2, T3, and T4 for color parameter were recorded as 5.05±0.88, 3.50±0.85, 6.70±0.83, and 6.90±0.74, respectively whilst 5.75±0.79, 4.40±0.85, 6.90±1.00, and 5.90±0.74 values were observed for same treatments, respectively with respect to taste. The glycemic index value of consuming white bread in human subjects were recorded as 75.23±5.45 followed by 32.73±2.37 whereas whole wheat chapatti had glycemic index 71.39±4.27 and glycemic load 35.53±2.25. Composite flour administration lowered the fasting glucose level from 94.96±5.77 mg/dl to 92.01±5.80 mg/dl whereas in hyperglycemic subjects, fasting glucose level dropped from 125.96±5.12 to 123.24±5.79 mg/dl. Similarly, mean values for random glucose level and insulin concentrations in normal subjects varied from 112.14±7.91 to 114.30±8.49 mg/dL and 13.16±1.44 to 16.44±1.46 IU/L respectively whereas random glucose levels in hyperglycemic subjects dropped from 159.84±7.25 and 154.80±10.36 mg/dL, respectively. Likewise, insulin concentration values in hyperglycemic subjects lowered from 20.09±2.20 and 19.34±3.11 IU/L.
cereals, composite flour, sensory evaluation, glycemic load, glucose, insulin
Cereals as crops are grown throughout the temperate and tropical regions of the world and full fil the approximately fifty percent food energy requirements of population [1]. Cereals are considered as staple food and provide significant amount of proteins, carbohydrates, vitamin B and minerals worldwide. Cereals are rich source of carbohydrates and often known with the same name, because cereals consist of almost 75% carbohydrates. Among cereals, wheat (Triticum aestivum) belongs to family gramineae and is considered second only to rice as the main human food crop. Considering weight, wheat caryopsis is consisted of (14– 16%) outer branny husk of the grain, (starch: 81–84%) central endosperm, and embryo portion (2–3%), respectively [2]. Barley (Hordeum vulgare L.) is one of the most ancient cereal crops grown in the world today ranking fourth among cereal grains after wheat, rice, and maize. Barley is used as animal feed (65%), malting (33%), and human consumption (2%). It also prevents from cardiovascular disorder via decreasing the cholesterol concentrations and improving the glucose tolerance [3]. Barley flour contains higher amount of soluble dietary fibers especially ß-glucans, arabinoxylans and pectin. Barley grains is composed of higher quantity of ß-glucans as compared to other cereals [4]. The chickpea (Cicer arietinum L.) is promising source of starch as major carbohydrates which is approximately 83.9% of the total carbohydrate [5].
Milling process is the process of grinding in which grind the grain into flour and significant step in post-production of grain. Composite flour is different from the ready-made mixed flour which is used in bakery products and by millers contain non-perishable constituents whereas the composite flour is the mixture of different flours of vegetables, wheat or non-wheat flour, rich in protein and starch which can be used for the production of leavened products breads, pastas, porridges, unleavened baked products, snack foods . Sensory evaluation is an important criterion to determine the development of products to meet consumer requirements. The composite flour prepared chapattis significantly reported reduction in acceptability [6].
Diabetes mellitus is prevailing disorder that affecting the huge number of populaces worldwide. There are multiple mechanisms which are participated in the development of this disorder such as (I) insulin resistance, (II) dysfunction of pancreatic β-cells, (III) over production of reactive oxygen species, (IV) higher concentrations of free fatty acids, (V) destruction of pancreatic β-cell, and (VI) failure of insulin sensitivity, respectively [7].
The administration of wheat bran in diabetic volunteers caused momentous reduction in serum glycosylated protein levels, lipoprotein cholesterol, glycosylated albumin levels, and serum lipids levels as well as also decreased the concentrations of blood glucose. Likewise, utilization of arabinoxylan fiber markedly lowered the blood glucose level, insulin resistance, enhanced the insulin sensitivity, insulin efficiency, and provide protection from the damage of beta cells [8].
Procurement of raw materials
For research purpose, following whole grains were procured from local market;
- Wheat
- Barley
- Chickpea
Preparation of flour
Procured materials were prepared for making chapattis. The grains were sifted and cleaned to remove dust, dirt, stalks, and any other undesired materials. The cleaned grains were ground to obtain fine flours separately for each commodity, using grinder. Grain flours thus obtained were stored carefully in air tight jars until further use.
Composite flour preparation
The prepared whole grain flours were mixed in various proportions as mentioned in Table 1 to make composite flours.
Table 1. Treatment plan for composite flours
Treatment |
Wheat flour |
Barley flour |
Chick pea flour |
T1 |
1 |
1 |
1 |
T2 |
1 |
0.75 |
0.75 |
T3 |
1 |
0.5 |
0.5 |
T4 |
1 |
0.25 |
0.25 |
Preparation of composite flour chapatti
The chapattis were prepared from composite flours by conventional cooking method using flat pan. Each chapatti weighed 100±2 g when cooked.
Sensory evaluation
Sensory quality characters like color, taste, aroma, texture, mouthfeel and overall acceptability of prepared chapattis were assessed by trained panel consisting of 10 members that were familiar with the product. The evaluation was done by using 9 points hedonic scale according to which 9 showing extremely liked and 1 being extremely disliked on sensory quality attributes as described by Meilgaard et al. [9]. To avoid any biasness, every member of panel single blinded scored each characteristic of respective type of chapatti, coded with different codes.
Glycemic index (GI) and glycemic load (GL)
The value of GI is expressed as percentage of glycemic response (GR) of a reference food (rf) that usually is either white bread or glucose solution. GR is the increased glucose concentration within the blood after eating. GR is expressed as the increased area under the curve (iAUC) of blood glucose over a time period of 2 hours [10].
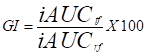
Where; 𝑡𝑓=test food and 𝑟𝑓 = reference food
Glycemic load GL was calculated using the formula 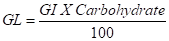
Carbohydrate is the amount of carbohydrate in that particular amount of food.
Selection of best treatment for feeding trial
One best treatment of chapatti with higher acceptance and low glycemic index and glycemic load was selected for bio-efficacy trial. The selected composite flour chapatti was used as dietary therapy for hyperglycemic and normal individuals for a period of thirty days. 40 subjects (20 hyperglycemic patients and 20 normal individuals) were selected as per selection criteria. The prepared chapattis were provided to the study volunteers for regular intake.
Selection criteria
Normal and hyperglycemic individuals with renal failure and other serious dysfunctions of any major organ were not included in the study.
Bio-efficacy studies
In bio-efficacy trials, two parallel studies i.e. normal (study 1) and hyperglycemic (study 2) were conducted each comprising of two groups as described in Table 2. Each group comprised of 10 subjects.
Table 2. Bio-efficacy plan
Studies |
Groups |
Treatment |
Normal subjects (Study 1) |
N0 |
Control |
N1 |
Consuming selected composite flour chapatti |
Hyperglycemic subjects (Study 2) |
H0 |
Control |
H1 |
Consuming selected composite flour chapatti |
The human efficacy trial continued for thirty days and blood samples of the participants were collected for biochemical assays at fortnightly basis.
Dietary guidelines
For uniform dietary pattern, hyperglycemic patients were prescribed a diet chart to be followed throughout the study. Similarly, normal subjects were also given dietary plan to follow during the trial to control variations in the responses.
Biochemical analysis
Hypoglycemic effect of composite flour chapatti was checked by assessing level of glucose and insulin in subjects’ sera. In each study, patient’s serum samples were monitored for sugar concentration by GOD-PAP method following the guiding of Kim et al. [11]. Likewise, insulin level was measured as per guideline of Ahn et al. [12].
Statistical analysis
All data regarding end parameters were assessed using ANOVA. To check the level of significance, two factors factorial under completely randomized design was used. For post hoc comparison, least significant difference test was performed [13].
Sensory evaluation
Means values in Table 3 showed that treatments showed significant effect on all sensory parameters of flour chapatti. Means values of treatments T1, T2, T3, and T4 for color parameter were recorded as 5.05±0.88, 3.50±0.85, 6.70±0.83, and 6.90±0.74, respectively whilst 5.75±0.79, 4.40±0.85, 6.90±1.00, and 5.90±0.74 values were observed for same treatments, respectively with respect to taste. Similarly, scores for aroma and texture attributes of treatments (T1, T2, T3, and T4) were 5.73±0.53 and 5.33±1.18, 5.40±0.52 and 4.20±0.92, 7.00±0.67 and 6.90±0.57, and 5.00±0.67 and 5.80±0.92, accordingly. Moreover, 6.10±0.79, 6.00±0.67, 8.10±0.57, and 4.50±0.85 scores were estimated for mouth feel parameter of composite flour chapatti for treatments T1, T2, T3, and T4, respectively. Best mean scores for all sensory quality attributes were observed to be obtained by treatment T3. Its mean score for overall acceptability was 7.12±0.29.
Table 3. Sensory evaluation of composite flour chapatti
Treatments |
Color |
Taste |
Aroma |
Texture |
Mouthfeel |
Overall Acceptability |
T1 |
5.05±0.88b |
5.75±0.79b |
5.73±0.53b |
5.33±1.18b |
6.10±0.79b |
5.59±0.46c |
T2 |
3.50±0.85b |
4.40±0.85c |
5.40±0.52b |
4.20±0.92b |
6.00±0.67b |
4.70±0.22c |
T3 |
6.70±0.83a |
6.90±1.00a |
7.00±0.67a |
6.90±0.57a |
8.10±0.57a |
7.12±0.29a |
T4 |
6.90±0.74a |
5.90±0.74ab |
5.00±0.67b |
5.80±0.92a |
4.50±0.85c |
5.62±0.42b |
Glycemic index and glycemic load
The mean values for glycemic index of consuming white bread in human subjects were recorded as 75.23±5.45 followed by 32.73±2.37 whereas whole wheat chapatti had glycemic index 71.39±4.27 and glycemic load 35.53±2.25. Likewise, mean values for glycemic index and glycemic load of treatments T1 and T2 in human subjects were observed as 65.72±3.25 and 36.11±1.78 and 63.98±4.63 and 29.02±2.10, accordingly. Moreover, glycemic index and glycemic load of treatment T3 showed values as 62.41±4.52 and 22.32±1.61 respectively whereas values of glycemic index and glycemic load for the treatment T4 were observed as 69.53±5.04 and 18.20±1.32 respectively (Table 4).
Table 4. Glycemic index and glycemic load of composite flour chapatti
Treatments |
Glycemic Index (P<0.01) |
Glycemic Load (P< 0.01) |
White Bread |
75.23±5.45a |
32.73±2.37b |
Whole Wheat Chapatti |
71.39±4.27ab |
35.53±2.25a |
T1 |
65.72±3.25b-d |
36.11±1.78a |
T2 |
63.98±4.63cd |
29.02±2.10c |
T3 |
62.41±4.52d |
22.32±1.61d |
T4 |
69.53±5.04a-c |
18.20±1.32e |
Glycemic profile of normal and hyperglycemic individuals
Table 5 showed the pooled means for the effect of treatment on glycemic profile. According to that, in normal subjects, fasting glucose level was lowered from 94.96±5.77 mg/dl to 92.01±5.80 mg/dl. While, in hyperglycemic subjects, fasting glucose level dropped from 125.96±5.12 to 123.24±5.79 mg/dl. Similarly, mean values for random glucose level and insulin concentrations in normal subjects varied from 112.14±7.91 to 114.30±8.49 mg/dL and 13.16±1.44 to 16.44±1.46 IU/L respectively whereas random glucose levels in hyperglycemic subjects dropped from 159.84±7.25 and 154.80±10.36 mg/dL, respectively. Likewise, insulin concentration values in hyperglycemic subjects lowered from 20.09±2.20 and 19.34±3.11 IU/L.
Table 5. Pooled means for effect of treatments on glycemic profile of normal and hyperglycemic subjects
Treatments |
Fasting Glucose (mg/dL) |
Random Glucose (mg/dL) |
Insulin (IU/L) |
N0 |
94.96±5.77 |
112.14±7.91 |
13.16±1.44b |
N1 |
92.01±5.80 |
114.30±8.49b |
16.44±1.46a |
H0 |
125.96±5.12a |
159.84±7.25a |
20.09±2.20a |
H1 |
123.24±5.79b |
154.80±10.36b |
19.34±3.11b |
According to that, fasting glucose levels in hyperglycemic subjects (study 2) at day 0 were recorded as 128.70±4.70, which dropped to 123.47±4.72 after 15 days and further dropped to 121.63±4.93 after 30 days. In study 2, the level of random glucose dropped from 166.00±6.07 to 150.75±6.81 mg/dL after 30 days. During 30 days, insulin levels in Study 1 lowered from 15.99±2.05 to 14.45±1.14 IU/L and in study 2 from 20.81±2.88 to 18.04±1.43 IU/L (Table 6).
Table 6. Pooled means for effect of intervals on glycemic profile of normal and hyperglycemic subjects
Studies |
Intervals |
Fasting Glucose
(mg/dL) |
Random Glucose
(mg/dL) |
Insulin
(IU/L) |
Normal subjects
(Study I) |
0 |
93.81±5.66 |
116.55±8.16a |
15.99±2.05a |
15 |
93.33±5.70 |
110.35±7.53b |
13.96±2.65b |
30 |
93.31±6.79 |
112.75±8.08ab |
14.45±1.14b |
Hyperglycemic subjects
(Study II) |
0 |
128.70±4.70a |
166.00±6.07a |
20.81±2.88a |
15 |
123.47±4.72b |
155.20±7.16b |
20.30±2.77b |
30 |
121.63±4.93b |
150.75±6.81c |
18.04±1.43c |
The mean values (Table 7) of fasting glucose level for group N0 on different intervals (0, 15, 30 days) in study I (normal subjects) were reported as 93.60±5.79, 94.25±5.83 mg/dL, and 97.01±6.00 mg/dL whilst 94.01±5.82, 92.40±5.72, and 89.60±5.55 mg/dL values of fasting glucose for same intervals in group N1 were observed, respectively. Likewise, in study II (hyperglycemic subjects) fasting glucose level significantly decreased from 129.20±4.82 (0 day) to 123.76±4.62 (30 days) mg/dL in H0 group; 128.19±4.78 to 119.50±4.46 in H1 group for same intervals, accordingly. Similarly, random glucose values in study 1 for N0 and N1 groups on different intervals 0,15, and 30 days were observed as 112.50±6.96, 106.90±6.62, and 117.00±7.24 mg/dL;120.60±7.46, 113.80±7.04, and 108.50±6.72 mg/dL, respectively.
Table 7. Glycemic response of composite flour chapatti in normal and hyperglycemic individuals
Studies |
Groups |
Intervals |
Fasting Glucose
(mg/dL) |
Random Glucose
(mg/dL) |
Insulin
(IU/L) |
Normal subjects
(Study 1) |
N0 |
0 |
93.60±5.79ab |
112.50±6.96b-d |
14.23±0.89d |
15 |
94.25±5.83ab |
106.90±6.62d |
11.51±0.72e |
30 |
97.01±6.00a |
117.00±7.24ab |
13.74±0.85d |
N1 |
0 |
94.01±5.82ab |
120.60±7.46a |
17.75±1.10a |
15 |
92.40±5.72ab |
113.80±7.04bc |
16.40±1.02b |
30 |
89.60±5.55b |
108.50±6.72cd |
15.16±0.94c |
Hyperglycemic subjects
(Study 2) |
H0 |
0 |
129.20±4.82a |
165.30±6.17a |
18.10±0.68c |
15 |
124.90±4.66bc |
159.50±5.95b |
22.89±0.86a |
30 |
123.76±4.62c |
154.70±5.77bc |
19.27±0.72b |
H1 |
0 |
128.19±4.78ab |
166.70±6.22a |
23.51±0.88a |
15 |
122.03±4.55cd |
150.90±5.63cd |
17.70±0.66c |
30 |
119.50±4.46d |
146.80±5.48d |
16.80±0.63d |
Likewise, in study 2, the random glucose levels were observed as 165.30±6.17, 159.50±5.95, 154.70±5.77 mg/dL (H0) and 166.70±6.22, 150.90±5.63, 146.80±5.48 mg/dL (H1) were recorded for same intervals. Furthermore, insulin reduction in study 1 in group N0 were varied from 14.23±0.89 to 13.74±0.85 (IU/L) and decreased from 17.75±1.10 to 15.16±0.94 IU/L in group N1 after 30 days. The mean values of insulin concentrations in study 2 H0 were significantly increased from 18.10±0.68 to 19.27±0.72 IU/L. whilst mean values were lowered from 23.51±0.88 to 16.80±0.63 IU/L in study 2 H1 after 30 days.
Sensory evaluation
The current results are in harmony with previous findings of Ojinnaka and Agubolum [14], they found that overall acceptability of chapattis is mainly affected by maillard reaction. They determined that cooking and temperature significantly affected the quality and sensory parameters of the bread by poorly coloration. Chapattis prepared from 20% cashew flour exhibited strong effects on color, aroma, flavor and texture characteristics. The scores for these attributes were varied from 8.3 to 8.3 of T1 and T4 treatments. Likewise, the increasing levels of chickpea flour in the chapattis caused significant reduction in textural quality and over all acceptability parameters of the chapattis for T5 and T6 treatments. The use of ratio of wheat flour and chickpea (80:20) for chapattis preparation showed best quality characters for chapattis.
In another study conducted by Chhavi and Sarita [15], they explored that flour prepared from finger millet varieties and wheat flour exhibited momentous impact on sensory characters such as aroma, texture, and over all acceptability etc. They observed that supplemented flour with finger millet and wheat flour showed good results regarding texture and appearance in comparison to control chapattis. The resultant chapattis also have higher crude fat, protein, total ash, phosphorous and insoluble dietary fiber contents [15].
Glycemic index and glycemic load
In human trial, administration of chickpeas flour improved the fasting insulin by 7.7 mg/dL, lowered the total cholesterol content 0.75 µIU/mL [16]. Similarly, in another study, wheat and finger millet flour administration to human has been reported to lower the concentrations of lipid profile parameters (cholesterol, low density lipoproteins, triglycerides, and very low-density lipoproteins as well as also enhanced the levels of high-density lipoproteins, respectively. Flour caused a significant increase in insulin efficiency and sensitivity, lower insulin resistance and blood sugar level. In conclusion, flour has been found significant hypoglycemic agent in human and experimental animals [17].
The previous investigations of Yang and their colleagues found that chickpea flour has significant effect on insulin resistance of experimental volunteers. Experimental volunteers were categorized into three different groups including control group, high fat supplemented diet group, and high fat plus chickpea flour enriched group for 8 months. They investigated that chickpea flour also showed reduction in insulin resistance, enhancement in insulin sensitivity and efficiency as well as also reduced the higher sugar level in experimental animals [18].
Arabinoxylan fibers have momentous impact on human cholesterol and glycemic index due to their soluble nature and higher viscosity. In addition, delaying of glucose uptake are linked with slowing down the gastric emptying and reducing small intestinal motility through viscous substances. ß-glucan is effective in preventing, treating, and controlling diabetes by lowering blood glucose levels and insulin. Multiple mechanisms are involved such as reduction in blood glucose levels, enhancement in insulin secretion and sensitivity, reduction in glycemic index, insulin resistance, and prevent from destruction of β-cells. There is linear relationship between consumption of β-glucan and lower blood glucose levels. Arabinogalactans also prevent from diabetes complications through lowering the glucose and insulin resistance. Cereal β-glucans are comprised of physiological properties such as water retention, swelling, and binding and diffusion suppression (gel formation, viscous) properties. Moreover, composite flour considerably controls blood glucose levels, improves insulin responses, and lowers serum cholesterol levels. In addition, oat and barley enriched diet also lower the glycemic index in clinical trials [19].
The administration of wheat bran in diabetic volunteers caused momentous reduction in serum glycosylated protein levels, lipoprotein cholesterol, and glycosylated albumin levels, as well as also decreased the concentrations of blood glucose. Likewise, utilization of arabinoxylan fiber markedly lowered the blood glucose level, insulin resistance, enhanced the insulin sensitivity, insulin efficiency, and provide protection from the damage of beta cells. Moreover, they also lowered the postprandial blood glucose, HbA1, low density lipoprotein and enhanced the high-density lipoprotein [20].
The flour in combination of finger millet (30%) and wheat flour (705) significantly bread significantly showed low glycemic index in obese people through multiple mechanisms such as lowering blood glucose level, enhance insulin sensitivity, insulin efficiency and decreasing the insulin resistance [21]. Likewise, in diabetic subjects, 100% wheat and soy supplemented bread have significant impact via lowering the enhanced blood glucose levels, decreasing the elevated level of glucose level and insulin resistance, enhanced the decreased concentration of insulin, inhibiting the activities of enzymes, reduces the glycemic index of foods, respectively [22]. In diabetic volunteers, incorporation of chickpea and chickpea flour caused reduction in glycemic index such as (GIwheat spaghetti: 73±5; GIwheat–chickpea spaghetti: 58±6) [23].
The study revealed maximum sensory acceptance for chapatti containing wheat:barley:chickpea flours in 1:0.5:0.5 ratio. This chapatti treatment represented lowest glycemic index as hence selected for bio-efficacy trial. The bio-evaluation of composite flour chapatti showed promising effects against hyperglycemia and showed significant reduction in blood glucose levels during a 30 days trial in hyperglycemic patients. The lipid, hepatic and renal parameters were also positively influenced upon treatment with selected composite flour chapatti.
There is not any conflict of interest among authors.
- Oluwakemi OA, Omodele I (2015) The current status of cereal (maize, rice and sorghum) crops cultivation in Africa: Need for integration of advances in transgenic for sustainable crop production. International Journal of Agricultural Policy and Research 3: 133-145.
- Bader Ul Ain H. Saeed F, Ahmad N, Imran A, Niaz B, Afzaal M, Imran M, Tufail T, Javed A (2018) Functional and health-endorsing properties of wheat and barley cell wall’s non-starch polysaccharides. International Journal of Food Properties 21: 1463-1480.
- Behall KM, Scholfield DJ, Hallfrisch J (2004a) Lipids significantly reduced by diets containing barley in moderately hypercholesterolemic men. J Am Coll Nutr 23: 55-62.
- Baik BK, Ullrich SE (2008) Barley for food: Characteristics, improvement, and renewed interest. Journal of Cereal Science 48: 233-242.
- Rincón F, Martínez B, Ibáñez MV (1998) Proximate composition and antinutritive substances in chickpea (Cicer arietinum L.) as affected by the biotype factor. J Sci Food Agric 78: 382-388.
- Prabhasankar P, Rajiv J, Indrani D, Venkateswara Rao G (2007) Influence of whey protein concentrate, additives, their combinations on the quality and microstructure of vermicelli made from Indian T. Durum wheat variety. J Food Eng 80: 1239-1245.
- Duru KC, Kovaleva EG, Danilova IG, Van der Bijl P, Belousova AV (2018) The potential beneficial role of isoflavones in type 2 diabetes mellitus. Nutr Res 59: 1-15.
- Mani I, Mani UV (1987) Effect of wheat bran supplementation on blood sugar, glycosylated protein and serum lipids in NIDDM subjects. Plant Foods for Human Nutrition 37: 161-168.
- Meilgaard MC, Civille GV, Carr BT (2007) Sensory evaluation techniques, 4th ed. C.R.C. Press L.L.C, New York.
- Chhavi A, Sarita S (2012) Evaluation of composite millet breads for sensory and nutritional qualities and glycemic response. Malays J Nutr 18: 89-101.
- Kim JI, Paik JK, Kim OY, Park HW, Lee JH, et al. (2011) Effects of lycopene supplementation on oxidative stress and markers of endothelial function in healthy men. Atherosclerosis 215: 189-195.
- Ahn J, Choi W, Kim S, Ha T (2011) Anti-diabetic effect of watermelon (Citrullus vulgaris Schrad) on streptozotocin-induced diabetic mice. Food Sci Biotechnol 20: 251-254.
- Steel RGD, Torrie JH, Dickey D (1997) Principles and procedures of statistics: a biometrical approach, 3rd ed. McGraw Hill Book Co, Inc, New York.
- Ojinnaka MC, Agubolum FU (2013) Nutritional and sensory properties of cashew nut- wheat based cookies. American Journal of Food and Nutrition 3: 127-134.
- Chhavi A, Sarita S (2012) Evaluation of composite millet breads for sensory and nutritional qualities and glycemic response. Malays J Nutr 18: 89-101.
- Pittaway JK, Robertson IK, Ball JM (2008) Chickpeas may influence fatty acid and fiber intake in an ad libitum diet, leading to small improvements in serum lipid profile and glycemic control. J Am Diet Assoc 108: 1009-1113. [crossref]
- Teradal D, Joshi N, Aladakatti RH (2017) Therapeutic evaluation of grain based functional food formulation in a geriatric animal model. J Food Sci Technol 54: 2789-2796. [crossref]
- Yang Y, Zhou L, Gu Y, Zhang Y, Tang J (2007) Dietary chickpeas reverse visceral adiposity, dyslipidemia and insulin resistance in rats induced by a chronic high-fat diet. Br J Nutr 98: 720-726.
- Biliaderis CG, Marta SI (2007) Cereal β-Glucans. In: Food F, editor. Carbohydrates. Boca Rotan: CRC Press; 2007; 1-73.
- Mani I, Mani UV (1987) Effect of wheat bran supplementation on blood sugar, glycosylated protein and serum lipids in NIDDM subjects. Plant Foods for Human Nutrition 37: 161-168.
- Chhavi A, Sarita S (2012) Evaluation of composite millet breads for sensory and nutritional qualities and glycemic response. Malays J Nutr 18: 89-101.
- Okafor HK, Ebuehi OAT (2016) Defatted soya flour supplementation of wheat bread confers oxidative, renal, hepatic and cardiovascular protective effects in waster rats. International Journal of Biochemistry Research and Review 10: 1-14.
- Goñi I, Valentín-Gamazo C (2003) Chickpea flour ingredient slow glycemic response to pasta in healthy voluntaries. Food Chem 81: 511-515.