Objectives: Mastication is a crucial function for the elderly, and promotes oral health status, cognitive function and the physical constitution. Most reports about occlusion patterns and occlusal glide of adults have reported the jaw movement at the lower incisal point due to easiness of evaluating masticatory performance. The purpose of this study was to test the hypothesis that dynamic occlusal contact area (OCA) during chewing differ for each tooth on the working vs. the balancing chewing side.
Design: In thirteen healthy Japanese females, OCA was estimated with a measurement system combining 3-D tracking of mandibular movements with 3-D digitization of tooth shape.
Results: The starting of occlusal contact between teeth at working side and balancing side did not differ significantly. In contrast, ending of occlusal contact of teeth at balancing side were markedly longer than that of teeth at working side at lateral incisor, canine, and first premolar. The dynamic sum of OCAs for all teeth was symmetrical around maximum closed position (MCP) when chewing on the working side. In contrast, the dynamic sum of OCA peaked after MCP when chewing on the balancing side. In working and balancing side, sums of maximum OCA at all posterior teeth accounted for 93%, 86% of sum OCA for all teeth at working and balancing sides, respectively.
Conclusion: Our result suggested that the hypothesis that dynamic OCA during chewing differ for each tooth on the working vs. the balancing chewing side was not accepted at molars.
balancing side, dynamic occlusal contact area, gum-chewing, multi-level linear model, working side
Mastication is one of the essential functions that promotes and preserves general health. Chewing ability is associated with not only oral health status but also cognitive function [1] and the physical constitution of the elderly [2]. Occlusal disharmony in animal models can have a deleterious effect on the hypothalamic-pituitary-adrenal axis, resulting in higher levels of stress [3,4] that might impair spatial memory [5,6]. Okada revealed that chewing ability was a significant predictor of serum albumin concentrations [2], and some reports have suggested that chewing ability might be related to nutritional status in the elderly [2,7,8].
Masticatory performance is influenced by various factors, including malocclusion, periodontal disease, number of occluding teeth, bite force, and dynamic occlusal contact area (OCA) [9,10]. According to Wilding and Owens, there is a correlation between larger OCA and healthy masticatory performance [10,11]. Subjects with larger areas of occlusal contact and near contact are better able to break down food [10].
Malocclusion, periodontal disease, and the number of occluding teeth are significantly related to decreasing OCA. Subjects with malocclusion present with smaller OCA [12,13] and lower masticatory efficiency than those with normal occlusion [12]. In subjects with periodontitis both the mean bite force and OCA values are less than in a healthy control group [14]. Poorer chewing performance results from a reduction in the number of occluding teeth [15]. Therefore, OCA is an important factor in the evaluation of oral conditions.
Most papers about occlusion patterns and OCA of adults have reported the jaw movement at the lower incisal point due to easiness of evaluating mastication. Because mastication is mainly performed at the molars [16], it is necessary to evaluate dynamic OCA at every tooth during the occlusal phase.
The purpose of this study was to test the hypothesis that dynamic OCA and occlusal glide during chewing differ for each tooth on the working vs. the balancing chewing side.
Human subjects
Thirteen healthy, dentate women with permanent dentitions (none had third molars or large fillings, including crowns or fixed partial dentures), between 18 and 26 years of age (average 20 years and 7 months), were asked to participate in this study. Only adult females were selected to exclude variability in chewing because of gender differences [17]. For a subject to be included, she had to meet the following criteria: (1) no pain during temporomandibular joint and muscle palpation, (2) no joint sounds, (3) a maximum opening greater than 40 mm, and (4) deviations or deflections less than 2.0 mm [18]. Prior to entering this study, informed consent was obtained from each subject and the study was reviewed and approved by the ethics committee of the Faculty of Dentistry, Kyushu University).
Experimental task
Each subject was given a stick of chewing gum (New TRIDENT, Warnar Lambart, 1.6 gram). Gum was chewed until soft before jaw movements were recorded. Starting from the maximum intercuspal position (ICP), each chewing sequence was recorded over a period of 20 s to 30 s and two chewing sequences were recorded for each subject. Chewing gum was chosen because it forms a more consistent bolus than real food, producing a more consistent masticatory pattern over many cycles [19].
Measuring system
Details about the measuring system have been reported previously [20], however, a brief description follows. Silicon-based registrations (Exafine, GC Co., Inc., Tokyo, Japan) were taken and poured immediately in dental stone (New Fujirock White, GC Co., Inc., Tokyo, Japan). Morphologic data from the resulting dental models were measured using an automatic 3-D digitizer (Figure 1a,b) (TRISTATION 400FE: NIKON INSTEC, Co., Inc., Tokyo, Japan). This contact-type digitizer records the three-dimensional coordinates of the surfaces of the dental models at 0.2 mm intervals (Figure 1c). For digitizing, the dental models were mounted on a stone table. The digitizing probe can digitize over a region of one or two teeth creating a 0.2 mm interval mesh (about 5000 points). Then the region being digitized is adjusted to cover adjacent teeth until the entire dental arch has been digitized. Once all coordinates (about 40,000 points on each dental arch) were recorded, a mathematical data mesh was constructed with intervals of 0.2 mm (Figure 1d).
Mandibular movement was measured using an optoelectronic analysis system (TRI-MET, Tokyo-Shizaisha, Tokyo, Japan) with 6 degrees-of-freedom (Figure 1e,f). The accuracy of this optoelectronic instrument in bench tests is better than 0.19 mm [21]. Each subject was asked to maintain their static ICP with slight force between the teeth for 2 s of recording of ICP position. The recorded motion data from the light emitting diodes rigidly attached to the subject’s upper and lower dentition was transferred to a computer workstation. The motion data was transformed to generate a reference frame with the origin of the coordinate axes defined as the medial tip of the lower left central incisor. The horizontal plane (Occlusal plane) extended from the origin to the left and right distal cusp tips of the lower permanent first molars on each subject’s dental model using a three-dimensional digitizer (XYZAX-PJ400A). The coordinates of the right and left molars and lower left central incisor were transferred to the workstation.
Data from both the TRIMET and TRISTATION were transformed to a newly defined coordinate system with its origin at the mesial tip of the lower left central incisor at the ICP. The occlusal plane extended from the origin to the tips of the right and left distal cusps of the lower first molars.
Data processing
A special computer program automatically identified each maximum opening position of the lower incisor and the two maximum closing positions (MCPs) on either side of the maximum opening. Based on these maximums the entire chewing sequence was divided into a series of chewing cycles, and ten cycles from the middle of the sequence were selected for analysis. Each selected occlusal phase of a cycle was divided into its closing and following opening strokes at the MCP. The last 3.0 mm (3D straight-line distance) of the closing stroke and the first 3.0 mm of the following opening stroke were defined as boundaries for the analysis. The three-dimensional straight-line distance travelled by the lower incisal point (IP) was defined as the ‘‘IP Distance’’ (Figure 1g). This region includes the expected length of the occlusal glide [22] and has often been used for functional analyses [23].
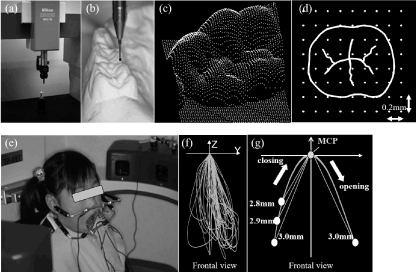
Figure 1: Morphologic and mandibular movement analyzing system. (a, b) Automatic 3-D digitizer. (c) Plot of the resulting morphologic data from a measured dental model. (d) A mathematical data mesh constructed with intervals of 0.2mm. (e) Optoelectronic analysis system with 6 degrees-of-freedom. (f) Frontal view an example of the chewing movement from a single individual for 20 seconds using the optoelectronic analysis system. (g) Frontal view an example of the incisor pathway from a single individual 3.0 mm from maximum closed position (MCP). IP Distances are defined as the 3-D straight-line distance for each 0.1 mm along this pathway. The IP Distance for both the closing and opening strokes were divided into 0.1 mm intervals, creating a total of 61 mandibular positions.
Because subjects were instructed to chew normally, the working side could change from one occlusal phase to the next. To compare opening and closing strokes regardless of chewing side, the movements were standardized by inverting the y-axis (right-left) coordinates when the closing stroke was located on the right side. This transformation put the working side of all chewing cycles on the left side and put the balancing side on the right side.
The IP distances for both the closing and opening strokes were divided into 0.1 mm intervals, creating a total of 61 mandibular positions, including the MCP and 30 positions for each closing and opening stroke (Figure 1g). At each of these positions, distances from all points on the mandibular model to all points on the maxillary model were calculated, and the minimum distance for each point on the mandibular model was identified. Previous studies suggest that a clearance of less than 0.2 mm corresponds to occlusal contacts occurring in this system [24], confirming the results of Lujan-Climent , et al. for fixed prosthodontic restorations [25]. Therefore, the OCA of each tooth on the mandible was calculated as the sum of all areas with 0.2 mm or less distance between tooth surfaces.
The morphological data (mathematical data mesh) from each model consisted of points that were 0.2 mm apart on the horizontal plane. If the surface of the dentition had been flat, each point would represent an area of 0.04 mm2. However, the occlusal surface was curved, and each point in the model had a different vertical value. Therefore, the vertical values of surrounding points were considered when calculating the area at each point. When the clearance of a mesh point on the mandible was less than 0.2 mm, the covered area at this point on the mandible was calculated and stored. The sum of these stored values for all points on the mandible was the total OCA at each position of the mandible.
The statically determined maximum possible OCA was calculated by transforming all coordinates on the upper and lower dentitions (recorded by TRISTATION) to a newly defined coordinate system with its origin at the mesial tip of the lower left central incisor at the static ICP. The OCA of each tooth was calculated using the sum of all areas with mesh points having less than 0.2 mm of clearance. The maximum possible OCA at the ICP was the sum of the occlusal contact areas of each tooth.
We defined the starting of occlusal contact (SOC) and the ending of occlusal contact (EOC) as the one-line distance from the starting position of occlusal contact to MCP and the one-line distance from the ending position of occlusal contact to MCP, respectively. The length of occlusal glide (LOG) of each tooth was defined as length from SOC to EOC. The LOG was calculated as more than 0.2 mm, when upper and lower teeth contacted at more than one point. On the other hand, the LOG was set to 0 mm, when upper and lower teeth did not contact at all.
Using MLwiN software (University of Bristol), multilevel linear analysis was used to estimate: (1) differences between SOC and EOC, between SOC of teeth on the working side and that of teeth on the balancing side and between EOC of teeth on the working side and that of teeth on the balancing side, (2) differences between LOG of teeth on the working side and that of teeth on the balancing side, and (3) distribution of OCA areas at 31 mandibular positions. This statistical analysis has been previously applied to the analysis of chewing movement [26,27], excursion [20], occlusal contact area [28] and electromyographic (EMG) activity [29].
The multilevel models were composed of two parts, fixed and random. The fixed part estimated the population parameters, which closely correspond to the mean estimates of traditional analyses. The standard errors associated with each parameter were also estimated. The random part estimated variation at different hierarchical levels, with one level nested within the preceding level. The two levels pertained to random variation between subjects and between the 10 cycles within each subject [30,31].
Differences between the SOC and EOC of each tooth, between SOC of each tooth on the working side and that of each tooth on the balancing side and between EOC of teeth on the working side and that of teeth on the balancing side are shown in Table 1. SOC between teeth on the working side and balancing side did not differ significantly. In contrast, EOC of teeth on the balancing side were markedly longer than that of teeth on the working side for the lateral incisor, canine, and first premolar. SOC was significantly shorter than EOC for the anterior teeth on the balancing side, but SOC and EOC did not differ significantly at the molars.
Table 1: Comparison of the estimated SOC and EOC (mm) of each tooth between working and balancing sides during the occlusal phase of chewing (n=13).
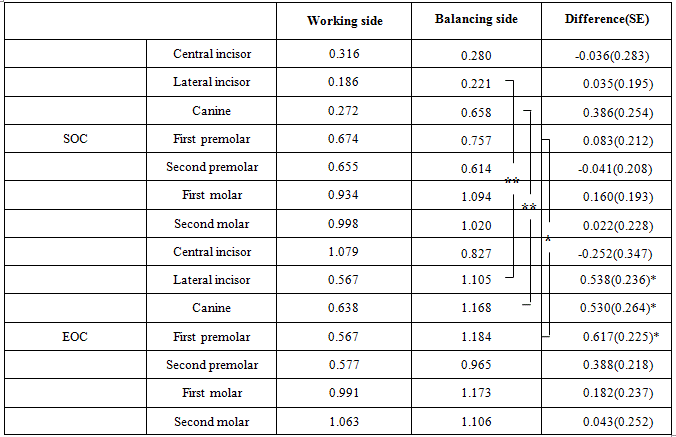
SOC: Starting of Occlusal Contact, EOC: Ending of Occlusal Contact
SE: Standard Error
*P<0.05; **P<0.01
In Table 2 LOGs of the lateral incisor, canine and first premolar on the balancing side were significantly longer than those on the working side. On the other hand, the LOGs at the second premolar, first molar, and second molar, did not differ significantly LOG between the working and balancing sides.
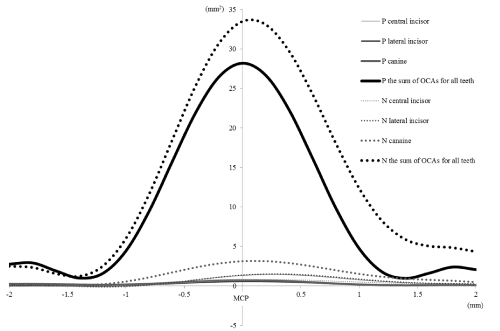
Figure 2: Comparisons of plots of multilevel linear models of the OCA between the working side (solid line) and balancing side (dashed line) of each anterior tooth and sums of OCAs for all teeth. P: working side; N: balancing side.
Shifting values of the OCA during occlusal phase at the posterior teeth was shown in Figure 3. On the working and balancing sides, the sum of maximum OCAs at first and second molars accounted for 71 %, 62 % of the sum of maximum OCAs for all teeth, respectively. Moreover, on the working and balancing sides, the sum of maximum OCAs of both molars accounted for 93 %, 86 %, respectively, but the peak OCA of each tooth on the balancing side was not always higher than that of the corresponding tooth on the working side. Shifting values of OCA were approximately symmetrical for each tooth on the working side. In contrast, corresponding plots of shifting OCA values for each tooth were asymmetrical on the balancing side.
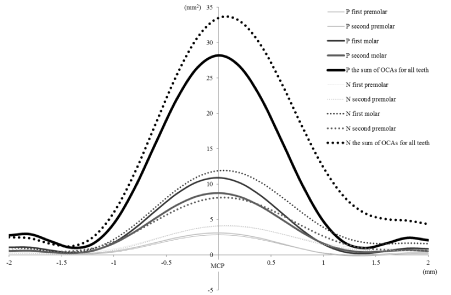
Figure 3: Comparison of estimated OCA between the working side (solid line) and balancing side (dashed line) of each posterior tooth and sums of OCAs for all teeth. P: working side; N: balancing side.
Evaluating dynamic OCA during chewing is more difficult than measuring OCA at static mandibular positions. Previous reports have measured OCA at the ICP or during chewing by using occlusal paper [32], occlusal strips [33], the Dental Prescale® system [34], occlusal registration material [10,35], a sensor-sheet [36] or the T-scan® system [37]. These materials can easily measure OCA in a clinical setting, however, estimating occlusal contacts during mastication is difficult. Alcan. reported an OCA of 25.22 mm2 using the Dental Prescale®, and Nishigawa suggested an OCA of 21.71 mm2 using black-colored silicone. The results in this study were considerably larger (61.6 mm2) than those previous studies. On the other hand, Julien reported an OCA of posterior tooth of 54.5 mm2 at MCP for women using silicon impression material [38], and this result is close to our value (OCA of posterior tooth at MCP of 55.0 mm2). In our study, the OCAs were 10.9 mm2 for the lower first molar (working side) at MCP, 11.9 mm2 for the lower first molar (balancing side), 8.74 mm2 for the lower second molar (working side), and 8.09 mm2 for the lower second molar (balancing side). However, Abe reported OCAs for individual maxillary and mandibular teeth statically at ICP of 3.0 mm2 for the lower first molar and 5.1 mm2 for the lower second molar [36], results smaller than in our study. Abe used an inflexible sensor-sheet that was unable to measure detailed occlusal contacts. Because our measuring system acquires the OCA data from both the TRIMET and TRISTATION, we could evaluate the three-dimensional date which nearly equal to natural jaw movement of masticatory performance.
Past reports have failed to show any significant difference between OCAs on the right and left sides [10,39], or between working and balancing sides [40] in normal adults. These studies used occlusal wax or the Dental Prescale® bilaterally and were static measurements rather than dynamic measurements during mastication. In comparison, our study detected a smaller OCA on the working side (lateral incisor, canine and first premolar) than on the balancing side. These differences may be due to gum intervening between the upper and lower teeth only when chewing on the working side.
Our study suggests that the SOC was significantly shorter than EOC for the anterior teeth. Sagittal angles, defined as the angles from posterior to anterior, of adults on the closing pathway were smaller than those on the opening pathway and chewing pathway described the trajectory from back to front in occlusal phase [26]. Moreover, our study showed that the EOCs of the lateral incisor, canine, and first premolar teeth on the balancing side were significantly longer than those of the corresponding teeth on the working side. The LOGs of lateral incisor, canine and first premolar teeth on the non-working side were also significantly longer than those for corresponding teeth on the working side. For the above reason, LOG might be affected by EOC. Saitoh showed that frontal angles, defined as the angles from the working side to the balancing side, of adults on the closing pathway are larger than those on the opening pathway and chewing pathway described the trajectory from working side to balancing side [26]. Considering these pathways of sagittal and frontal angles, anterior teeth contacted earlier than posterior teeth; therefore, this research might support our results.
In conclusion, our result suggested that the hypothesis that dynamic OCA during chewing differ for each tooth on the working vs. the balancing chewing side was not accepted at molars in this study. We could clarify details of dynamic OCA which we were not able to watch dynamic occlusal contacts directly. The methods in this study might be valuable for the diagnosis before treatment and evaluation after treatment for patients with malocclusion, periodontitis and tooth missing.
This investigation was supported in part by the Japanese Society for the Promotion of Science (No. 18791563, 22592291, 23792437).
- Miura H, Yamasaki K, Kariyasu M, Miura K, Sumi Y (2003) Relationship between cognitive function and mastication in elderly females. J Oral Rehabil 30: 808-811. [Crossref]
- Okada K, Enoki H, Izawa S, Iguchi A, Kuzuya M (2010) Association between masticatory performance and anthropometric measurements and nutritional status in the elderly. Geriatr Gerontol Int 10: 56-63. [Crossref]
- Areso MP, Giralt MT, Sainz B, Prieto M, Garcia-Vallejo P, Gomez FM (1999) Occlusal disharmonies modulate central catecholaminergic activity in the rat. J Dent Res 78: 1204-1213. [Crossref]
- Yoshihara T, Taneichi R, Yawaka Y (2009) Occlusal disharmony increases stress response in rats. Neurosci Lett 452: 181-184. [Crossref]
- Kubo KY, Yamada Y, Iinuma M, Iwaku F, Tamura Y, Watanabe K, et al. (2007) Occlusal disharmony induces spatial memory impairment and hippocampal neuron degeneration via stress in SAMP8 mice. Neurosci Lett 414: 188-191.
- Iinuma M, Ichihashi Y, Hioki Y, Kurata C, Tamura Y, et al. (2008) Malocclusion induces chronic stress. Okajimas Folia Anat Jpn 85: 35-42. [Crossref]
- Nordenram G, Ljunggren G, Cederholm T (2001) Nutritional status and chewing capacity in nursing home residents. Aging (Milano) 13: 370-377. [Crossref]
- Rauen MS, Moreira EA, Calvo MC, Lobo AS (2006) Oral condition and its relationship to nutritional status in the institutionalized elderly population. J Am Diet Assoc 106: 1112-1114. [Crossref]
- Hatch JP, Shinkai RS, Sakai S, Rugh JD, Paunovich ED (2001) Determinants of masticatory performance in dentate adults. Arch Oral Biol 46: 641-648. [Crossref]
- Owens S, Buschang PH, Throckmorton GS, Palmer L, English J (2002) Masticatory performance and areas of occlusal contact and near contact in subjects with normal occlusion and malocclusion. Am J Orthod Dentofacial Orthop 121: 602-609. [Crossref]
- Wilding RJ (1993) The association between chewing efficiency and occlusal contact area in man. Arch Oral Biol 38: 589-596. [Crossref]
- Gomes SG, Custodio W, Jufer JS, Del Bel CA, Garcia RC (2010) Mastication, EMG activity and occlusal contact area in subjects with different facial types. Cranio 28: 274-279. [Crossref]
- Nakata Y, Ueda HM, Kato M, Tabe H, Shikata-Wakisaka N, Matsumoto E, et al. (2007) Changes in stomatognathic function induced by orthognathic surgery in patients with mandibular prognathism. J Oral Maxillofac Surg 65: 444-451. [Crossref]
- Alkan A, Keskiner I, Arici S, Sato S (2006) The effect of periodontitis on biting abilities. J Periodontol 77: 1442-1445. [Crossref]
- al-Ali F, Heath MR, Wright PS (1998) Chewing performance and occlusal contact area with the shortened dental arch. Eur J Prosthodont Restor Dent 6: 127-132.
- Wictorin L, Hedegård B, Lundberg M (1971) Cineradiographic studies of bolus position during chewing. J Prosthet Dent 26: 236-246. [Crossref]
- Sugimoto K, Iegami CM, Iida S, Naito M, Tamaki R, Minagi S (2012) New image analysis of large food particles can discriminate experimentally suppressed mastication. J Oral Rehabil 39: 405-410. [Crossref]
- Helkimo M (1974) Studies on function and dysfunction of the masticatory system. 3. Analyses of anamnestic and clinical recordings of dysfunction with the aid of indices. Sven Tandlak Tidskr 67: 165-181. [Crossref]
- Jemt T, Karlsson S, Hedegard B (1979) Mandibular movements of young adults recorded by intraorally placed light-emitting diodes. J Prosthet Dent 42: 669-673. [Crossref]
- Okamoto A, Hayasaki H, Nishijima N, Iwase Y, Yamasaki Y, et al. (2000) Occlusal contacts during lateral excursions in children with primary dentition. J Dent Res 79: 1890-1895. [Crossref]
- Hayashi T, Kurokawa M, Miyakawa M, Aizawa T, Kanaki A, Saitoh A, et al. (1994) A high-resolution line sensor-based photostereometric system for measuring jaw movements in 6 degrees of freedom. Front Med Biol Eng 6: 171-186. [Crossref]
- Suit SR, Gibbs CH, Benz ST (1976) Study of gliding tooth contacts during mastication. J Periodontol 47: 331-334. [Crossref]
- Ingervall B (1972) Tooth contacts on the functional and nonfunctional side in children and young adults. Arch Oral Biol 17: 191-200. [Crossref]
- Hayasaki H, Nakata S, Nishijima N, Okamoto A, Minematsu K, et al. (1998) CMDME (curved mesh diagram of mandibular excursion) method for visualization and diagnosis of mandibular movement. J Oral Rehabil 25: 672-676. [Crossref]
- Lujan-Climent M, Martinez-Gomis J, Palau S, Ayuso-Montero R, Salsench J, Peraire M (2008) Influence of static and dynamic occlusal characteristics and muscle force on masticatory performance in dentate adults. Eur J Oral Sci 116: 229-236. [Crossref]
- Saitoh I, Hayasaki H, Nakata S, Iwase Y, Nakata M (2004) Characteristics of the gum chewing occlusal phase in children with primary dentition. J Oral Rehabil 31: 406-411. [Crossref]
- Wintergerst AM, Throckmorton GS, Buschang PH (2008) Effects of bolus size and hardness on within-subject variability of chewing cycle kinematics. Arch Oral Biol 53: 369-375. [Crossref]
- Iwase Y, Saitoh I, Okamoto A, Nakakura-Ohshima K, Inada E, Yamada C, et al. (2011) Do occlusal contact areas of maximum closing position during gum chewing and intercuspal position coincide? Arch Oral Biol 56: 1616-1623. [Crossref]
- Sabashi K, Saitoh I, Hayasaki H, Iwase Y, Kondo S, Inada E, et al. (2009) A cross-sectional study of developing resting masseter activity in different angle classifications in adolescence. Cranio 27: 39-45. [Crossref]
- Buschang PH, Hayasaki H, Throckmorton GS (2000) Quantification of human chewing-cycle kinematics. Arch Oral Biol 45: 461-474. [Crossref]
- Kubota N, Hayasaki H, Saitoh I, Iwase Y, Maruyama T, et al. (2010) Jaw motion during gum-chewing in children with primary dentition. Cranio 28: 19-29. [Crossref]
- Takai A, Nakano M, Bando E, Hewlett ER (1995) Influence of occlusal force and mandibular position on tooth contacts in lateral excursive movements. J Prosthet Dent 73: 44-48. [Crossref]
- Ogawa T, Ogimoto T, Koyano K (1998) Pattern of occlusal contacts in lateral positions: canine protection and group function validity in classifying guidance patterns. J Prosthet Dent 80: 67-74. [Crossref]
- Hidaka O, Iwasaki M, Saito M, Morimoto T (1999) Influence of clenching intensity on bite force balance, occlusal contact area, and average bite pressure. J Dent Res 78: 1336-1344. [Crossref]
- Wilding RJ, Lewin A (1994) The determination of optimal human jaw movements based on their association with chewing performance. Arch Oral Biol 39: 333-343. [Crossref]
- Abe Y, Nogami K, Mizumachi W, Tsuka H, Hiasa K (2012) Occlusal-supporting ability of individual maxillary and mandibular teeth. J Oral Rehabil 39: 923-930. [Crossref]
- Garrido Garcia VC, Garcia Cartagena A, Gonzalez Sequeros O (1997) Evaluation of occlusal contacts in maximum intercuspation using the T-Scan system. J Oral Rehabil 24: 899-903. [Crossref]
- Julien KC, Buschang PH, Throckmorton GS, Dechow PC (1996) Normal masticatory performance in young adults and children. Arch Oral Biol 41: 69-75. [Crossref]
- Goto TK, Yamada T, Yoshiura K (2008) Occlusal pressure, contact area, force and the correlation with the morphology of the jaw-closing muscles in patients with skeletal mandibular asymmetry. J Oral Rehabil 35: 594-603. [Crossref]
- Wilding RJ, Adams LP, Lewin A (1992) Absence of association between a preferred chewing side and its area of functional occlusal contact in the human dentition. Arch Oral Biol 37: 423-428. [Crossref]