Abstract
Background: The beneficial effects of probiotics and probiotics on bowel health have been described in both healthy and constipated subjects. Recent research has investigated the effects of combinations of probiotics and prebiotics, which are termed synbiotics. This study aimed to investigate the effect of consuming probiotics together with prebiotics on the fecal microbiota and stool parameters of healthy young Japanese women. Methods: A randomized, double-blinded, placebo-controlled intervention study was conducted in 28 healthy young Japanese women. Subjects were randomly assigned to consume a placebo food containing 6.25 g dextrin (control) or a test food containing either 1 billion colony-forming units of Bifidobacterium lactis HN019 (probiotic), 6.25 g polydextrose (prebiotic), or both the probiotic and the prebiotic (synbiotic) daily for 2 weeks. Stool samples and records of stool parameters (frequency, amounts, Bristol scale) and nutrient intake were obtained during the trial. Results: The change in the proportion of Bacteroides spp. in both the polydextrose-fed groups (prebiotic and synbiotic) was significantly greater than that in both the dextrin-fed groups (control and probiotic), whereas the changes in the proportions of other microbes were not significantly different among the experimental groups. Stool parameters did not significantly differ among the experimental groups, but a significant correlation between the proportion of Bacteroides spp. and the stool amounts after 2 weeks of intake was observed in the synbiotic group. Conclusion: The intake of polydextrose for 2 weeks increased the proportion of fecal Bacteroides. The combined intake of probiotics and prebiotics may increase stool amounts via increasing the proportion of Bacteroides among the fecal microbiota.
Key words
Bifidobacterium lactis, prebiotic, probiotic, synbiotic, polydextrose
Abbreviations
BL: Bifidobacterium lactis; PDX: Polydextrose
Introduction
Probiotics are microorganisms that remain viable after being consumed and exert positive health effects [1]. Several strains of Bifidobacteria have been used as probiotics in Japan. The beneficial effects of probiotics include the normalization of the frequency of bowel movements and stool consistency [1] and the mechanisms often depend on interactions with the microflora of the host [2]. Bifidobacterium animalis ssp. lactis was reported to improve metabolic disorders by modulating the gut microbiota, resulting in an increased production of short-chain fatty acids in the colon [3].
Prebiotics were first defined as “nondigestible food ingredients that beneficially affect the host by selectively stimulating the growth and/or activity of one or a limited number of bacteria in the colon, thus improving host health” [4]. This definition was later refined as “a selectively fermented ingredient that allows specific changes, both in the composition and/or activity in the gastrointestinal microflora that confer benefits” [5]. Polydextrose (PDX) is a non-digestible oligosaccharide that is considered a soluble dietary fiber and is used widely in the food industry. In vitro studies have indicated that PDX has the potential to act as a prebiotic [6-10] and remains available as a carbon source throughout the colon [11]. The consumption of PDX was reported to produce a significant decline in the genotoxicity of the fecal water of volunteers, which coincided with an increased abundance of several bacteria including known producers of butyrate [12].
Recent research has highlighted the potential benefits of synergistic combinations of probiotics and prebiotics, which are called synbiotics [1]. This study aimed to investigate the effect of consuming a probiotic (Bifidobacterium lactis; BL) together with a prebiotic (PDX) on the fecal microbiota and stool parameters of healthy young Japanese women.
Materials and methods
Subjects
Twenty-eight subjects were recruited among female students aged over 18 years from the Otuma Women’s University, Japan. The primary purpose of this study was to estimate the changes in stool parameters and the fecal microbiota after supplementation with test foods for 2 weeks. The inclusion criteria were: 1) aged more than 18 years at consent and must be an Otsuma Women’s University student and 2) understands the study procedures and agrees to participate in the study by giving informed consent prior to the study. The exclusion criteria were: 1) has a history of cardiovascular diseases, liver disease, kidney disease, digestive tract disease, respiratory disease, or diabetes; 2) has a history of malignant disease or is currently receiving therapy for a chronic disease; 3) takes drugs to treat a disease; 4) has a history of drug or food allergy; 5) regularly consumes dietary fiber supplements (dietary fiber-rich foods made with seaweed, konjac, psyllium, etc.) or whole-grain cereals (whole grain wheat, brown rice, barley, etc.); 6) pregnant or lactating, or could become pregnant during the test period; 7) has a smoking habit; 8) currently participating in other clinical tests, has participated in other clinical tests within 1 month prior to the current study, or plans to participate in other clinical tests; 9) has a history of drug addiction or is in therapy for drug addiction; 10) has a stool frequency greater than 5 day per week; and 11) is not appropriate in the investigator's opinion. The study was performed in conformity with the regulations of the Ethics Committee for Life Science Studies in Otsuma Women’s University and the principles of the Helsinki Declaration. All subjects gave written informed consent before entering the study.
Test foods
The placebo control food contained 6.25 g dextrin packed in a sachet. The probiotic test food contained 1 billion colony-forming units (CFU) of BL HN019 (Danisco Japan Inc., Tokyo, Japan) in the form of 3.33 mg of dried bacteria packed in a sachet. The prebiotic test food contained 6.25 g polydextrose (Litesse, Danisco Japan Inc., Tokyo, Japan) packed in a sachet. The synbiotic test food contained BL HN019 (1 billion CFU/3.33 mg) and 6.25 g polydextrose packed together in a sachet.
Protocol
A randomized, double-blinded, placebo-controlled intervention study was conducted in 28 healthy young Japanese women. The subjects were randomly divided into four groups (each group; n = 7). Both the subjects and the researchers were unaware of the assignment of test foods. The subjects consumed a sachet of the test foods (probiotic, prebiotic, or synbiotic) or a placebo food (dextrin) daily together with 100 mL water or milk for 2 weeks. Subjects ate self-selected foods, abstained from excessive eating and drinking, and otherwise maintained their usual eating habits before and throughout the trial. During the trial, the subjects completed daily test food intake records and provided a 3-day record of their diet during the second week of the trial. Their food records were analyzed using the Standard Tables of Food Composition in Japan 2015, Seventh Revised Version [13] and the Excel Eiyokun Version 8.0 software program (Kenpakusha, Tokyo, Japan). The study protocol was registered at the University Hospital Medical Information Network Clinical Trials Registry (UMIN000026885).
Microbiota analysis
Stool samples were collected before and after the 2 weeks of dietary supplementation using stool collection tubes containing reagent gel (Healthcare Systems Co., Ltd. Aichi, Japan). Stool samples were first homogenized with an equal volume of phosphate-buffered saline and 60 U/mL of protease K at 65 °C for 10 min to disrupt the cell membranes. The DNA of the stool samples was isolated using a DNA extraction kit after mechanical homogenization (MagNA Pure LC DNA Isolation Kit I, Roche, Basel, Switzerland) according to the manufacturer's instructions. The concentration of DNA was measured by photometry at 260 and 280 nm. Standard curves were constructed for 16S rDNA from Bacteroides fragilis, Prevotella copri, Bifidobacterium bifidum, Clostridium clostridioforme, and Clostridium leptum. Amplification and detection were carried out in 96-well optical plates on a LightCycle® 480 real-time polymerase chain reaction (PCR) system (Roche, Basel, Switzerland) with a KAPA SYBR® fast quantitative PCR kit (KAPA Biosystems, Wilmington, MA, USA). The primers used in this study are shown in Table 1 [14-19]. All procedures were performed by Healthcare Systems Co., Ltd. The proportion of each assayed bacterium among the total microbiota was calculated as the individual species count divided by the total bacteria count.
Table 1. Primer sequences used for the analysis of microbiota by real-time PCR
|
|
|
|
Primer sequence
|
|
|
|
|
|
|
Total bacteria [14]
|
|
Forward
|
ACTCCTACGGGAGGCAGCAGT
|
|
|
|
Reverse
|
GTATTACCGCGGCTGCTGGCAC
|
|
Bacteroides spp. [15]
|
|
Forward
|
CGATGGATAGGGGTTCTGAGAGGA
|
|
|
|
Reverse
|
GCTGGCACGGAGTTAGCCGA
|
|
Prevotella spp. [16]
|
|
Forward
|
CACCAAGGCGACGATCA
|
|
|
|
Reverse
|
GGATAACGCCYGGACCT
|
|
Bifidobacterium spp.[17]
|
|
Forward
|
GCGTGCTTAACACATGCAAGTC
|
|
|
|
Reverse
|
CACCCGTTTCCAGGAGCTATT
|
|
Clostridium coccoides group [18]
|
|
Forward
|
AAATGACGGTACCTGACTAA
|
|
|
|
Reverse
|
CTTTGAGTTTCATTCTTGCGAA
|
|
Clostridium leptum group [19]
|
|
Forward
|
GCACAAGCAGTGGAGT
|
|
|
|
Reverse
|
CTTCCTCCGTTTTGTCAA
|
|
|
|
|
|
|
Stool parameters
Stool parameters (frequency, amount, and consistency) were recorded daily. Stool amounts were counted as the number of eggs with a minimum unit of 0.5 eggs. The Bristol scale was used for the evaluation of stool consistency [20].
Statistical analysis
Data are expressed as the mean ± standard error of the mean. Differences among the experimental dietary groups were analyzed by two-way analysis of variance with the factors BL (−/+) and PDX (−/+). Correlations between the microbiota and stool parameters or nutrient intake were assessed by calculating the Spearman’s rank correlation coefficient. Mean differences within BL (−/+) or PDX (−/+) were evaluated by Wilcoxon’s rank sum test. All statistical analyses were performed using JMP Pro (Version 12.0, SAS Institute Inc., Cary, NC, USA).
Results
Microbiota analysis
Changes in the proportion of the fecal microbiota are shown in Table 2 and Figure 1. No significant main effect or interaction between the probiotic and prebiotic groups was observed in all microbiota. The only significant change observed was an increase in the proportion of Bacteroides spp. in the PDX(+) group compared with that in the PDX(−) group.
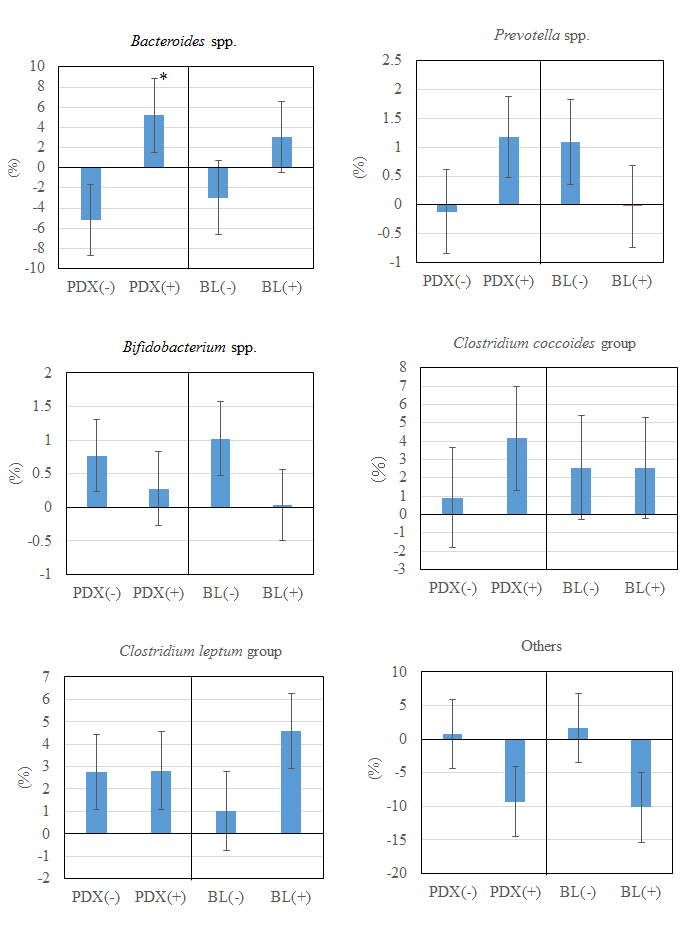
Figure 1. Changes in the proportion of the microbiota in PDX- and BL-fed subjects. Values represent the mean ± standard error of the mean (n = 7). *Significant difference by Wilcoxon rank sum test (p < 0.05). PDX: polydextrose, BL: Bifidobacterium lactis
Table 2. Change in the proportion of fecal microbiota before and after the administration of Bifidobacterium lactis and polydextrose (%).
|
|
|
Control
|
Probiotic
|
Prebiotic
|
Symbiotic
|
|
|
|
|
|
|
|
|
Bacteroides spp. before administration
|
|
18.8 ± 5.1
|
15.5 ± 3.5
|
14.6 ± 4.2
|
12.4 ± 3.5
|
|
Bacteroides spp. after administration
|
|
10.6 ± 2.6
|
13.5 ± 3.0
|
14.6 ± 4.5
|
20.5 ± 6.8
|
|
Prevotella spp. before administration
|
|
1.7 ± 1.7
|
0.2 ± 0.1
|
1.3 ± 3.3
|
0.1 ± 0.1
|
|
Prevotella spp. after administration
|
|
1.6 ± 1.5
|
0.1 ± 0.0
|
3.3 ± 3.2
|
0.1 ± 0.1
|
|
Bifidobacterium spp. before administration
|
|
2.1 ± 0.6
|
1.6 ± 0.4
|
1.3 ± 0.3
|
2.9 ± 0.8
|
|
Bifidobacterium spp. after administration
|
|
3.4 ± 1.3
|
1.8 ± 0.4
|
1.9 ± 0.6
|
2.7 ± 1.2
|
|
Clostridium leptum group before administration
|
|
18.4 ± 2.8
|
17.0 ± 2.6
|
17.2 ± 2.8
|
12.5 ± 2.6
|
|
Clostridium leptum group after administration
|
|
19.0 ± 2.7
|
18.2 ± 2.4
|
17.7 ± 4.4
|
16.3 ± 2.2
|
|
Clostridium coccoides group before administration
|
|
6.7 ± 1.8
|
12.5 ± 3.8
|
12.1 ± 6.9
|
4.3 ± 0.9
|
|
Clostridium coccoides group after administration
|
|
8.2 ± 2.4
|
16.8 ± 3.6
|
10.8 ± 1.8
|
9.2 ± 2.7
|
|
Others before administration
|
|
52.2 ± 2.1
|
53.2 ± 6.5
|
53.5 ± 5.4
|
67.9 ± 4.5
|
|
Others after administration
|
|
57.3 ± 4.0
|
49.6 ± 4.7
|
51.8 ± 8.2
|
51.1 ± 8.8
|
|
|
|
|
|
|
|
|
Values represent the mean and SEM (n = 7)
|
|
|
|
|
Control group, dextrin 6.25 g; Probiotic group, Bifidobacterium lactis 109 CFU/day; Prebiotic group, polydextrose 6.25 g/day; Symbiotic group, Bifidobacterium lactis 109 CFU/day + polydextrose
Stool parameters
Stool parameters are shown in Table 2. No significant main effect or interaction between the probiotic and prebiotic groups was observed in the stool frequency, amount, and Bristol scale. However, a significant correlation between the proportion of Bacteroides spp. and the stool amount after 2 weeks of dietary supplementation was observed only in the synbiotic group (r = 0.90, p < 0.05). No significant correlations between the proportions of other bacteria and stool amounts were observed.
Energy and nutrient intake
Energy and nutrient intake are shown in Table 4. Two subjects in the synbiotic group had a low energy intake, but there was no significant difference in the mean energy and nutrient intake among groups. A significant correlation was detected between the change in the proportion of Bifidobacterium and the intake of dietary fiber (r = 0.40, p < 0.05).
Table 3. Effects of the administration of polydextrose and Bifidobacterium lactis on the frequency, amount, and characteristics of stools (Bristol scale).
|
|
Control
|
Probiotic
|
Prebiotic
|
Symbiotic
|
|
|
|
|
|
|
|
Stool frequency (1st week)
|
1.1 ± 0.2
|
1.0 ± 0.2
|
1.0 ± 0.1
|
1.0 ± 0.1
|
|
Stool frequency (2nd week)
|
1.1 ± 0.2
|
1.0 ± 0.2
|
1.1 ± 0.1
|
1.1 ± 0.1
|
|
Stool amounts (1st week)
|
2.0 ± 0.5
|
1.7 ± 0.4
|
1.4 ± 0.2
|
2.0 ± 0.3
|
|
Stool amounts (2nd week)
|
1.9 ± 0.5
|
1.7 ± 0.5
|
1.6 ± 0.3
|
1.9 ± 0.3
|
|
Bristol scale (1st week)
|
3.6 ± 1.0
|
3.1 ± 0.6
|
3.2 ± 0.8
|
3.1 ± 0.5
|
|
Bristol scale (2nd week)
|
3.9 ± 1.2
|
3.0 ± 0.7
|
3.9 ± 0.7
|
3.1 ± 0.5
|
Values represent the mean and SEM (n = 7)
Stool amounts were expressed by counting the number of eggs (minimum unit = 0.5 eggs)
Bristol scale: 1, Separate hard lumps, like nuts; 2, Sausage-shaped but lumpy; 3, Like a sausage or snake but with cracks on its surface; 4, Like a sausage or snake, smooth and soft; 5, Soft blobs with clear-cut edges; 6, Fluffy pieces with ragged edges, a mushy stool; 7, Watery, no solid pieces.
Table 4. Energy and nutrient intakes during the experimental period
|
|
Control
|
Probiotic
|
Prebiotic
|
Symbiotic
|
|
|
|
|
|
|
|
|
|
|
|
Energy (kcal/day)
|
1837
|
± 464
|
2009
|
± 410
|
1937
|
± 560
|
1417
|
± 324
|
|
Carbohydrate (g/day)
|
225.0
|
±
|
57.1
|
252.3
|
± 36.0
|
243.1
|
± 71.1
|
179.7
|
± 26.1
|
|
Protein (g/day)
|
74.3
|
±
|
20.5
|
71.3 ± 19.6
|
65.8 ± 20.8
|
48.2 ± 10.5
|
|
Fat (g/day)
|
65.5
|
± 23.1
|
76.8 ± 25.3
|
71.6 ± 30.0
|
49.9 ± 15.5
|
|
Dietary fiber (g/day)
|
11.4
|
±
|
4.7
|
13.8
|
± 3.1
|
14.2
|
± 6.1
|
10.3
|
± 4.2
|
|
Minerals (g/day)
|
16.3
|
±
|
5.4
|
18.1
|
± 4.4
|
17.7 ± 10.0
|
12.0
|
± 3.1
|
Values represent the mean and SEM (n = 7)
Discussion
The daily consumption of both the prebiotic and synbiotic foods for 2 weeks resulted in a significant increase in the proportion of Bacteroides spp. PDX is not hydrolyzed by human digestive enzymes in the small intestine and remains intact during its passage into the colon, where it is gradually and partly fermented by the endogenous microbiota, and approximately 60% is excreted in the feces [22,23]. Recent research has indicated that obese people are likely to have a smaller proportion of the phylum Bacteroidetes than the phylum Firmicutes within their gut microbiota. The ratio of Bacteroidetes to Firmicutes increases as fat mass decreases [21]. Therefore, an increase in the ratio of Bacteroidetes (Bacteroides spp. and Prevotella spp.) to Firmicutes (Clostridium coccoides and leptum groups) might play a beneficial role in human health. It was reported that the intake of PDX (8 g/day) increased the numbers of Clostridium leptum group and Clostridium clusters I and II [10]. However, the number of Bacteroides spp. was not analyzed by quantitative PCR in that study. In a recent randomized, double-blind, placebo-controlled study on healthy adult males, the effects of dietary supplementation with PDX (21 g/day) on fecal metabolites, bacterial taxa, and bacterial metagenomes were reported [23]. The consumption of PDX significantly suppressed the numbers of the phylum Firmicutes (12%) and significantly increased those of the phylum Bacteroidetes (12%) as compared with the placebo group. Our data supported this result.
Stool parameters (frequency, amounts, and Bristol scale) were not influenced by the intake of PDX and BL. The effects of probiotic and prebiotic foods may not have been detected because the subjects were healthy young women and had healthy bowel movements at baseline. It was reported that PDX (8 g/day) had no effects on stool weight and the fecal contents of Bifidobacteria in healthy volunteers [24]. However, in the present study, a significant correlation was detected between the proportion of Bacteroides spp. after 2 weeks of intake and the stool amount only in the synbiotic group (r = 0.90). Therefore, the combined intake of probiotics and prebiotics might increase the total stool weight by increasing the proportion of Bacteroides spp. Further studies are needed to elucidate the effects of dietary supplementation with synbiotics on stool parameters in subjects with moderate constipation.
The effects of the intake of BL were not detected in this study. It may be difficult to detect the changes because the proportion of Bifidobacterium spp. was relatively low (1.3–3.4%). It was reported that the intake of Bifidobacterium longum (4 × 10⁹ CFU) for one month modulated the gut microbiota composition, but interindividual differences in the fecal Bifidobacterium count were quite large [25]. The quantitative analysis (as CFU/g feces) of Bifidobacterium spp. will be needed to further elucidate their effects as probiotics on the microflora. In the present study, a significant correlation was observed between the proportion of Bifidobacterium spp. and dietary fiber intake. In the synbiotic group, two subjects had a low intake of energy and nutrients. Further study will be needed to consider the relationship between the intake of dietary fiber and fecal Bifidobacterium counts.
Conclusion
The intake of PDX for 2 weeks increased the proportion of fecal Bacteroides. The combined intake of probiotics and prebiotics may increase stool amounts via inducing an increase in the proportion of Bacteroides in the fecal microbiota.
Authorship and contributorship
S.A. performed experiments, analyzed data, and drafted the manuscript. T.N. and S.O. desighned the study.
Funding
The study was funded by Danisco Japan Inc.
Competing interests
Two authors related to this study are employees of Danisco Japan Inc. (Tokyo, Japan). The authors declare no conflict of interest associated with this manuscript.
References
- de Vrese M., Schrezenmeir J (2008) Probiotics, prebiotics, and synbiotics. In: U. Stahl, U.E.B. Donalies, E. Nevoigt eds. Food Biotechnology. Berlin: Springer–Verlag 1-66. [Crossref]
- de Vrese M, Marteau PR (2007) Probiotics and prebiotics: effects on diarrhea. J Nutr 137:803S-11S. [Crossref]
2021 Copyright OAT. All rights reserv
- Aoki R, Kamikado K, Suda W, Takii H, Mikami Y, et al. (2017) A proliferative probiotic Bifidobacterium strain in the gut ameliorates progression of metabolic disorders via microbiota modulation and acetate elevation. Sci Rep 7:43522. [Crossref]
- Gibson GR, Roberfroid MB (1995) Dietary modulation of the human colonic microbiota: Introducing the concept of prebiotics. J Nutr 125:1401-1412. [Crossref]
- Gibson GR., Probert HM, van Loo J, Rastall RA, Roberfroid MB (2004) Dietary modulation of the human colonic microbiota: Updating the concept of prebiotics. Nutr Res Rev 17:259-275. [Crossref]
- Probert HM, Apajalahti JH, Rautonen N, Stowell J, Gibson G (2004) Polydextrose, lactitol, and fructo-oligosaccharide fermentation by colonic bacteria in a three-stage continuous culture system. Appl Environ Microbiol 70: 4505-4511. [Crossref]
- Holscher HD, Coporaso JG, Hooda S, Brulc JM, Fahey GC, et al. (2015) Fiber supplementation influences phylogenetic structure and functional capacity of the human intestinal microbiome: Follow-up of a randomized controlled trial. Am J Clin Nutr 101:55-64. [Crossref]
- Hooda S, Boler BMV, Serao MCR, Brulc JM, Staeger MA, et al. (2012) 454 pyrosequencing reveals a shift in fecal microbiota of healthy adult men consuming polydextrose or soluble corn fiber. J Nutr 142:1259-1265. [Crossref]
- Canfora EE, Blaak EE (2015) The role of polydextrose in body weight control and glucose regulation. Curr Opin Clin Nutr Metab Care. 18:395-400. [Crossref]
- Costabile A, Fava F, Roÿotiö H, Forssten SD, Olli K, et al. (2012) Impact of polydextrose on the faecal microbiota: A double-blind, crossover, placebo-controlled feeding study in healthy human subjects. Br J Nutr 108:471-481. [Crossref]
- do Carmo MM, Walker JC, Novello D, Caselato VM, Sgarbieri VC, et al. (2016) Polydextrose: Physiological function, and effects on health. Nutrients 8:E553. [Crossref]
- Costabile A, Fava F, Röytiö H, Forssten SD, Olli K, et al (2012) Impact of polydextrose on the faecal microbiota: a double-blind, crossover, placebo-controlled feeding study in healthy human subjects. Br J Nutr 108:471-81. [Crossref]
- MEXT (2015) Standard tables of food composition in Japan, seventh revised version.
- Walter J, Tannock GW, Tilsala-Timisjarvi A, Rodtong S, Loach DM, et al. (2000) Detection and identification of gastrointestinal Lactobacillus species by using denaturing gradient gel electrophoresis and species-specific PCR primers. Appl Environ Microbiol 66:297-303. [Crossref]
- Bergström A, Licht TR, Wilcks A, Andersen JB, Schmidt LR, et al. (2012) Introducing GUt low-density array (GULDA): a validated approach for qPCR-based intestinal microbial community analysis. FEMS Microbiol Lett 337:38-47. [Crossref]
- Larsen N, Vogensen FK, van den Berg FW, Nielsen DS, Andreasen AS, et al (2010) Gut microbiota in human adults with type 2 diabetes differs from non-diabetic adults. PLOS ONE 5:e9085. [Crossref]
- Delroisse JM, Boulvin AL, Parmentier I, Dauphin RD, Vandenbol M, et al (2008) Quantification of Bifidobacterium spp. and Lactobacillus spp. in rat fecal samples by real-time PCR. Microbiol Res 163:663-70. [Crossref]
- Matsuki T, Watanabe K, Fujimoto J, Miyamoto Y, Takada T, et al. (2002) Development of 16S rRNA-gene-targeted group-specific primers for the detection and identification of predominant bacteria in human feces. Appl Environ Microbiol 68: 5445-51. [Crossref]
- Matsuki T, Watanabe K, Fujimoto J, Takada T, Tanaka R (2004) Use of 16S rRNA gene-targeted group-specific primers for real-time PCR analysis of predominant bacteria in human feces. Appl Environ Microbiol 70: 7220-8. [Crossref]
- Lewis SJ, Heaton KW (1997) Stool form scale as a useful guide to intestinal transit time. Scand J Gastroenterol 32:920-4. [Crossref]
- Kallus SJ, Brandt LJ (2012) The intestinal microbiota and obesity. J Clin Gastroenterol 46:16-24. [Crossref]
- Yoshioka M, Shimomura Y, Suzuki M (1994) Dietary polydextrose affects the large intestine in rats. J Nutr 124:539–547. [Crossref]
- Holscher HD, Coporaso JG, Hooda S, Brulc JM, Fahey GC Jr, et al. (2015) Fiber supplementation influences phylogenetic structure and functional capacity of the human intestinal microbiome: Follow-up of a randomized controlled trial. Am J Clin Nutr 101, 55-64. [Crossref]
- Hengst C, Ptok S, Roessler A, Fechner A, Jahreis G (2009) Effects of polydextrose supplementation on different faecal parameters in healthy volunteers. Int J Food Sci Nutr 5:96-105. [Crossref]
- Toscano M, De Grandi R, Stronati L, De Vecchi E, Drago L (2017) Effect of Lactobacillus rhamnosus HN001 and Bifidobacterium longum BB536 on the healthy gut microbiota composition at phyla and species level: A preliminary study. World J Gastroenterol 23:2696-2704. [Crossref]