Abstract
Wharton's jelly derived mesenchymal stem cell (WJ-MSC) possesses therapeutic properties. WJ-MSC was nontumorigenic, acquired high rate of proliferation and their immune privileged status make them ideal for both autologous and allogeneic use in regenerative medicine applications. This study examined the possible therapeutic potentials of camel WJ-MSC in regeneration of damaged pancreatic diabetic tissues in rats. Streptozotocin (STZ) induced diabetic rats showed pancreatic tissues degeneration in parallel with suppressed expressions of the insulin, smad-2, PDX-1 and SIRT-1. The infusion of WJ-MSC markedly alleviated the altered induced diabetes by significant increase in quantitative genes expression and significantly enhanced histopathological cellular integrity of islets of Langerhans and pancreatic acini compared to STZ group. The infusion of WJ-MSC enhanced the liver and kidneys functions supported by decrease of ALT, AST and urea levels than diabetic group. These findings shows for the first time the novel valuable therapeutic role of camel WJ-MSC on pancreatic tissue regeneration with function retrieval and reduced the side effects of STZ on the liver and kidneys.
Key words
Camel, Wharton Jelly, MSCs, Diabetes mellitus, SIRT-1, Rat
Introduction
Diabetes mellitus (DM) is a chronic endocrine metabolic disorder characterized by inadequate production and use of insulin, resulting in abnormally high blood glucose levels which are responsible for complications such as blindness, kidney failure, cardiovascular disease, stroke, neuropathy and vascular dysfunction [1]. Insulin injection and hypoglycemic drugs are currently used for Diabetes mellitus treatment. They can achieve adequate glycemic control but they don’t prevent the development of diabetic complications [2]. Stem cells have the ability to differentiate into functional insulin-producing cells, they become a promising source for insulin-producing cells [3]. Successful stem cell therapy can eliminate the cause of the disease and enhance the regeneration of pancreas [4]. MSCs isolated from Wharton’s Jelly (WJ-MSCs) represent a potential cell source to treat diabetes. Systemic administration of WJ-MSCs results in recovery of pancreatic islets from insulitis, increased blood insulin secretion and correction of hyperglycemia [5]. There were previous successful trails for isolation and differentiation of camel stem cells as endothelial progenitor stem cells. They were successfully isolated from camel peripheral blood and differentiated in vitro to chondrocyte, osteoblast and neural cells [6]. Also mesenchymal stem cells were successfully isolated and expanded from adipose tissues of camel and differentiated in vitro to chondrocyte and osteoblast [7]. This study was carried to detect the ability of camel WJ-MSC in treatment of diabetes mellitus induced experimentally in rats.
Materials and methods
Camel WJ- MSC preparation
Two fresh umbilical cord samples were collected from healthy pregnant slaughtered camels and transported at sterile container provided by sterile saline at 4°C. The cords were rinsed several times with sterile saline and cut in to 2-4 cm lengths. The vessels were stripped manually from the segments then the cord was opened and the tissue was immersed in (3 mg/ml) collagenase II enzyme (Sigma; USA) for digestion 60 minutes at 37°C. This digested tissue was strained and tissue debris was removed then centrifuged at 250 x g for 5 min at room temperature. Strained cells were suspended in complete culture medium containing Dulbecco’s modified Eagle’s medium (DMEM) supplemented with 10% fetal bovine serum (FBS) and antibiotics (100 U/ml penicillin and 100 μg/ml streptomycin). Cells were incubated at 37°C in 5% humidified CO2 for 12- 14 days and considered as passage 0 [8]. Identification of isolated camel WJ-MSC by morphology and flowcytometric analysis. Cultured MSCs were harvested by trypsin and stained with specific antibodies (CD29 and CD105) according to BD- Biosciences, USA protocol. Analysis was performed with Flow Antibody Cell Sorting (FACS) Calibur flow cytometer [9].
PKH26 labeling
MSCs were labeled in culture for further in vivo tracing using PKH26 Red Fluorescent Cell Linker Kit supplied by Sigma-Aldrich according to manufacture instructions.
Experimental animals
Thirty albino female rats at the age of maturity weighting (120-150gm) were used in the study. Rats were housed in polycarbonate animal cages and fed on conventional laboratory diets with an unlimited supply for drinking water. This experimental work was approved by Ethics of Animal Use in Research Committee (EAURC), Faculty of Veterinary Medicine, Cairo University, Egypt. The rats were grouped into three equal groups, Group 1: control negative group, Group 2: STZ rats intraperitoneally (IP) injected at a dose of 60 mg/kg. Group 3: STZ rats injected intravenous (IV) with undifferentiated camel WJ-MSC labeled with PKH26 at a dose (3× 10⁶cells) (10). STZ supplied by Sigma-Aldrich, dissolved in 0.1M sodium citrate buffer, pH 4.5. Fasting blood glucose levels were estimated after 72 hours for checking the induction of diabetes.
Biochemical parameters
Fasting blood samples were collected from the retro orbital plexus of rats every 2 weeks along the experimental period (10 weeks) for estimation of serum glucose and insulin. Serum glucose was measured by the glucose oxidase method using commercially available kit supplied by Diamond, Egypt. Serum levels of rat insulin were assessed by ELISA using the rat insulin (DRG International, Inc USA). Serum ALT, AST and urea were assayed spectrophotometrically using spectrum diagnostic kit (Egypt) according to manufacture instructions.
Histopathological studies
Tissue specimens were dissected from euthanized rats at 4 and10 weeks from the pancreas, liver and kidneys from all groups. Tissues were fixed in 10% buffered neutral formalin, routinely processed and embedded in paraffin according to standard procedures. Tissue sections (4-6 µm) were prepared and stained with Hematoxyline and Eosin in addition to staining sections of pancreas with Gomori aldehyde fuchsine stain [11].
Real time PCR
Total RNA was extracted from pancreatic tissue homogenate using RNeasy purification reagent (Qiagen, Valencia, CA). cDNA was generated from 5 μg of total RNA using RT High capacity cDNA Reverse Transcriptase kit (Applied biosystems, catalog number 4306736). Real-time qPCR amplification and analysis were performed using SYBRs Green PCR master mix reagents kit (Fermentas; catalog number 4309155). The qPCR thermal profile was as follows: 10 minutes at 95°C for enzyme activation followed by 40 cycles of 15 seconds at 95°C, 20 seconds at 55°C and 30 second at 72°C for the amplification step. The primers (Table 1) were optimized at the annealing temperature. After the RT-PCR run the data were expressed in Cycle threshold (Ct). The PCR data sheet includes Ct values of assessed genes (insulin, Smad-2 and PDX-1) and the house keeping (reference) gene, (GAPDH). The relative quantization of target genes were normalized by ΔΔCt method using Applied Biosystem Instrument software analysis version 2.1 (StepOne™, USA).
Tables:
Table 1. Primers sequence of all studied genes:
|
Insulin
|
Forward primer: CCGTCGTGAAGTGGAG
Reverse primer: CAGTTGGTAGAGGGGAGCAG
(Gene bank accession number: M25584.1)
|
|
Smad-2
|
Forward primer: GCCCCAACTGTAACCAGAGA
Reverse primer: GCCAGAAGAGCAGCAAATTC
(Gene bank accession number: XM_006254946.3)
|
|
PDX-1
|
Forward primer : GGTGCCAGAGTTCAGTGCTAA
Reverse primer: CCAGTCTCGGTTCCATTCG
(Gene bank accession number: NM_022852.3)
|
|
GAPDH
|
Forward primer : CACCCTGTTGCTGTAGCCATATTC
Reverse primer: GACATCAAGAAGGTGGTGAAGCAG
(Gene bank accession number: XM_017592435.1)
|
Western blot
The antibody used was antigen affinity-purified polyclonal sheep IgG anti-rat SIRT1 (R&D Systems, Cat N0: AF7714). Equal volumes of protein extracted from pancreatic tissues of all studied groups were separated by SDS-PAGE on 4-20% polyacrylamide gradient gels. After incubation in 5% non fat dry milk, Tris-HCL, 0.1% Tween 20 for 1 hr, SIRT1 polyclonal antibody was added to one of the membranes containing specimen samples and incubated at 4 ̊C overnight. Appropriate secondary antibody was incubated for 2 hr at room temperature. After being washed twice n 1 x TBS-T, densitometric analysis of the immunoblots was performed to quantify the amounts of SIRT1 against control sample by total protein normalization by Image analysis software on the ChemiDoc MP imaging system (version 3) produced by Bio-Rad (Hercules, CA).
Statistical analysis
Results of the current study were presented as mean ± standard deviation (SD). The statistical analysis was carried out by one-way analysis of variances (ANOVA) followed by multiple comparison post hoc test (Student-Newman-Keuls). Mean differences between groups were reflected as significant when P value is equal to or less than *0.05 Vs control group as well as #0.05 Vs STZ group and $0.05 Vs STZ+WJ-MSC group.
Results
Wharton Jelly MSCs
WJ-MSC was identified in vitro morphologically by fusiform spindle shaped cell at one and two weeks culture (Figures 1A and 1B respectively). The colony forming unit (CFU) was achieved at passage 0 (Fig. 1C). MSCs were confirmed by FACS analysis which showed cells positive for CD29 (94%) and CD105 (90%) (Figures 2A and 2B respectively). In vitro labeling of cultured and expanded MSCs by PKH26 was assessed as cell membrane linker red fluorescent dye (Figure 3A). In vivo tracing of infused WJ-MSC was detected in unstained paraffin sections of pancreatic tissue. After 4 weeks of stem cells infusion in STZ group treated with WJ-MSC revealed homing of cells stained with PKH26 red fluorescent dye in rat pancreas (Figure 3B).
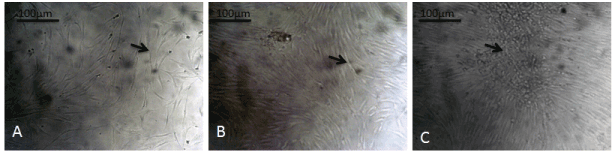
Figure 1. Isolated and cultured WJ-MSC A: stem cells propagated with 50% confluencefor 7 days, B: stem cells reached 80–90% confluence at 14 days and C: formation of stem cells CFU at 21 days in vitro culture.
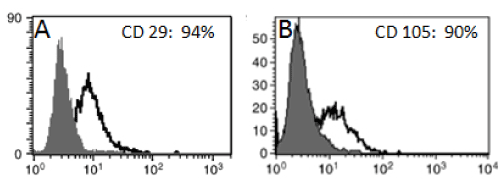
Figure 2. FACS analysis of WJ-MSC showed cells were uniformly positive for A: CD29 (94%) and B: CD105 (90%).
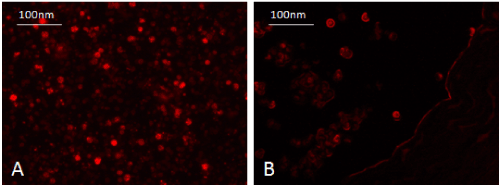
Figure 3. Pancreas of STZ rat treated with WJ-MSC (4weeks) showing homing of injected labeled undifferentiated WJ-MSC with PKH26 red fluorescent dye in rat pancreas.
Biochemical parameters
Blood glucose level of STZ rats was significantly increased (P˂0.05) when compared to control group along the experimental period. Meanwhile, blood glucose level of STZ rats treated with WJ-MSC showed significant increase (P˂0.05) at (2 and 4) weeks post treatment (P.T) compared to control group and significant decrease (P˂0.05) at (6,8 and 10) weeks P.T when compared to STZ group (Table 2).
Table 2. Serum glucose level in all studied groups
|
|
Serum glucose (mg/dl)
|
|
|
Group
|
(2 weeks)
|
(4 weeks)
|
(6 weeks)
|
(8 weeks)
|
(10 weeks)
|
|
|
Control
|
94.33 ± 10.52#$
|
98.17 ± 7.00#$
|
99.33 ± 10.02#$
|
102.00 ± 10.68#$
|
100.17 ± 9.24#
|
|
STZ
|
246.67 ± 44.72*$
|
271.83 ± 43.56*$
|
281.00 ± 46.73*$
|
288.67 ± 84.18*$
|
326.33 ± 75.54*$
|
|
STZ+WJ-MSC
|
188.83 ± 9.64*#
|
158.67 ± 17.57*#
|
144.83 ± 17.68*#
|
130.17 ± 5.04*#
|
109.67 ± 11.29 #
|
| |
|
|
|
|
|
|
|
|
|
|
|
Values are represented as mean ± SD
*: statistically significant compared to corresponding value in control group (P<0.05)
#: statistically significant compared to corresponding value in STZ group (P<0.05)
$: statistically significant compared to corresponding value in STZ+WJ-MSC group (P<0.05)
Serum insulin level of STZ rats showed significant decrease (P˂0.05) when compared to control group along the experimental period. Concerning to serum insulin level of STZ group treated with WJ-MSC showed significant increase (P˂0.05) through the experimental period when compared to STZ group (Table 3).
Table 3. Serum insulin level µU/ml in all statistical groups
|
|
Serum insulin (µU/ml)
|
|
Group
|
(2 weeks)
|
(4 weeks)
|
(6 weeks)
|
(8 weeks)
|
(10 weeks)
|
|
Control
|
45.02 ± 8.69$
|
42.78 ± 8.08#$
|
42.78 ± 8.08#$
|
45.02 ± 8.69#$
|
45.02 ± 8.69#
|
|
STZ
|
13.84 ± .91*
|
14.10 ± 1.27*$
|
14.10 ± 1.43*$
|
13.23 ± 1.06*$
|
12.00 ± 1.43*
|
|
STZ+WJ-MSC
|
16.76 ± 2.58*
|
22.26 ± 2.31*#
|
27.26 ± 2.32*#
|
33.62 ± 1.94 *#
|
41.45 ± 3.33#
|
Values are represented as mean ± SD
*: statistically significant compared to corresponding value in control group (P<0.05)
#: statistically significant compared to corresponding value in STZ group (P<0.05)
$: statistically significant compared to corresponding value in STZ+WJ-MSC group (P<0.05)
At 4 and 10 weeks PT, estimated serum urea, ALT and AST levels in rats of STZ group showed significant increase (P˂0.05) than control group while in STZ rats treated with WJ-MSC revealed significant decrease (P˂0.05) compared to STZ group (Table 4).
Table 4. Kidney and liver functions in all experimental groups.
|
Group
|
Urea (mg/dl)
|
ALT (IU/dl)
|
AST (IU/dl)
|
|
4 weeks
|
10 weeks
|
4 weeks
|
10 weeks
|
4 weeks
|
10 weeks
|
|
Control
|
|
28.6 ± 0.62a
|
17.25 ± 1.1a
|
18.62 ± 0.55a
|
31 ± 0.91a
|
30.75 ± 0.85a
|
|
STZ
|
43 ± 1.04c
|
53.87 ± 0.82c
|
29.6 ± 0.62c
|
32.5 ± 0.64c
|
41.5 ± 0.64c
|
44.75 ± 0.85c
|
|
STZ+WJ-MSC
|
36.5 ± 0.45b
|
30.75 ± 0.85a
|
23.37 ± 0.55b
|
20.5 ± 0.64a
|
37.25 ± 0.85b
|
31.5 ± 0.64a
|
Values bearing different superscript (a,b,c) are considered significant at P˂ 0.05.
Effects on genes expressions
Statistical analysis of quantitative RT-PCR results for insulin, Smad-2 and PDX-1 genes in STZ group revealed significant decrease (P˂0.05) when compared to control group. Meanwhile, quantitative expressions for insulin, Smad-2 and PDX-1 genes in STZ group treated with WJ-MSC revealed significant decrease (P˂0.05) when compared to control group and significant increase (P˂0.05) when compared to STZ group (Table 5).
Table 5. Relative quantitation (RQ) of genes expression in all studied groups
|
Group
|
Genes
|
|
Insulin
|
Smad-2
|
PDX-1
|
|
Control
|
0.51 ± .09#$
|
0.63 ± .14#$
|
0.97 ± .33#$
|
|
STZ
|
06 ± .05*$
|
0.10 ± .01*$
|
0.06 ± .03*$
|
|
STZ+WJ-MSC
|
0.30 ± .10*#
|
0.34 ± .09*#
|
0.47 ± .08*#
|
Values are represented as mean ± SD
*: statistically significant compared to corresponding value in control group (P<0.05)
#: statistically significant compared to corresponding value in STZ group (P<0.05)
$: statistically significant compared to corresponding value in STZ+WJ-MSC group (P<0.05).
Effects on SIRT-1 protein expression
Protein analysis of the animals pancreatic tissues revealed that STZ animals had a significant decrease in SIRT-1 (P<0.05) expressions compared to control group. While the expressions of SIRT-1 was significantly increased (P<0.05) in STZ rats treated with WJ-MSC compared to STZ group (Figure 4).
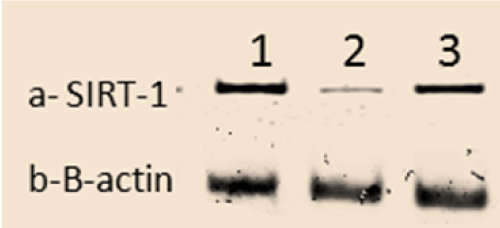
Figure 4. The scanning densitometry results of SIRT-1 versus β-actin protein levels in Control group (1), STZ group (2) and STZ+WJ-MSC group (3).
Histopathology examination
Pancreas: The examined sections of pancreas from diabetic rats at 4weeks post induction (P.I) revealed diffuse vacuolation of pancreatic acini (Figure 5A) and severe necrosis of pancreatic acini with mononuclear inflammatory cells infiltration. The islets of Langerhans showed hyperplasia in some cases, vacuolation and or necrosis in other cases. At 10 weeks (P.I), vacuolation of pancreatic acini was less and appear in focal manner. Apoptosis of acinar epithelial cells began to appear and congestion of interstitial blood vessels was moderate. In the treated group with WJ-MSC the pancreatic acini appeared normal in most of examined sections. Slight vacuolation of islets cells associated with slight congestion of their blood capillaries were prominent (Figure. 5B). By the end of experiment, most examined sections showed marked improvement in the histopathological picture. Pancreas of diabetic rats stained with Gomori aldehyde fuchsine stain revealed few surviving beta cells in islets of Langerhans with light granulation (Figure 5C) and that of diabetic rats treated with WJ-MSC showed normal size islets of Langerhans with remarkable increased in beta cell mass with deeply stained granules (Figure 5D)
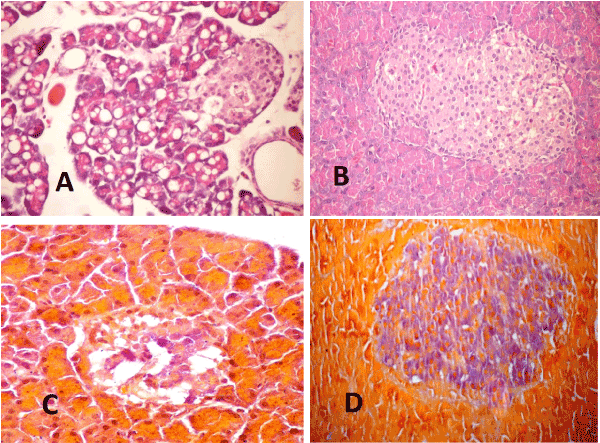
Figure 5. A-Pancreas 2021 Copyright OAT. All rights reservon and necrosis of islets of Langerhans cells. Note the necrotic hyalinized pancreatic acini (H & E X 400). B- pancreas of STZ rat treated with WJ-MSC (4weeks) showing cellular hyperplasia and slight vacuolation of pancreatic islets (H & E X 400). C- Pancreas of STZ rat (10weeks) showing islets of Langerhans with light granulated beta cells (Gomori aldehyde fuchsine stain X400). D- Pancreas of STZ rat treated with WJ-MSC (10weeks) showing islets of Langerhans hyperplasia with deeply granulated beta cells (Gomori aldehyde fuchsine stain X400).
Liver: The examined liver of diabetic rats at 4weeks (P.I) showed focal hepatocytic vacuolation of microvesicular pattern, few cells of them showed signet ring appearance. The hepatocytic vacuolation become diffuse in addition to nuclear vacuolation at 10 weeks (P.I). Focal areas of coagulative necrosis associated with mononuclear inflammatory cells infiltration were prominent in all examined cases (Figure 6A)
Liver of diabetic rats treated with WJ-MSC showed marked improvement in the hepatic parenchyma gradually ended by increase the number of binucleated hepatocytes and activation of kupffer cells (Figure 6B)
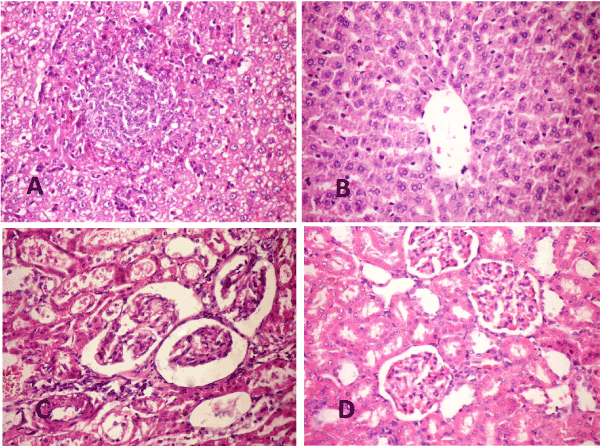
Figure 6. A- Liver of STZ rat (10weeks) showing focal coaguolative necrosis associated with mononuclear inflammatory cell infiltration, cytoplasmic and nuclear vacuolization (H& E X 400). B- Liver of STZ rat treated with WJ-MSC (10weeks) showing increase binucleated hepatocyte (arrows) with activation of kupffer cells (H&E X 400). C- Kidney of STZ rat (4 weeks) showing thickening of the basement membrane of renal tubules and the parietal layer of Bowman’s capsule with distension of Bowman’s space (H &EX 400). D- Kidney of STZ rat treated with WJ-MSC (4 weeks) showing regenerated tubules and slight congestion of glomerular tuft (H &E X 400).
Kidney: The examined sections of kidneys from diabetic rats, revealed severe necrosis of renal tubular epithelium with interstitial mononuclear inflammatory cells infiltration. The basement membrane of renal tubules appeared thickened with formation of renal cast in its lumen. Thickening of parietal layer of Bowman’s capsule were common in addition to the presence of proteinaceous materials in Bowman’s space (Figure 6C). The kidneys of diabetic rat treated with WJ-MSC showed improvement in the histopathological picture than previously described in diabetic group (Figure 6D). Most examined cases showed regenerated tubules and slight congestion of glomerular tuft.
Discussion
As regards to biochemical parameters, the diabetogenic effect of STZ was reported by several investigators as serum glucose level and serum insulin level. Referring to the present study, blood glucose level of STZ group treated with WJ-MSC showed significant decrease than STZ group and returned to normal level at 10 weeks post treatment. The serum Insulin level of the same group showed significant increase than STZ group and became nearly normal at 10 weeks. Researchers used human WJ-MSC for treatment of diabetes induced in experimental animals. They recorded recovery of pancreatic islets from insulitis, increased blood insulin secretion, and correction of hyperglycemia after systemic administration of WJ-MSCs [5,12].
The results of quantitative RT-PCR for insulin, Smad-2 and PDX-1 genes in pancreatic tissues revealed significant increase in the three genes in the diabetic group treated with camel WJ-MSCs diabetic group. It can be concluded that the treatment of diabetes by camel WJ-MSCs provides the best nich for β-cell differentiation and survival by increasing PDX-1 gene expression [13]. Also the increase of Smad-2 in WJ-MScs group provides good signals for the development of pancreas islets and regulates multiple cellular functions such as cell proliferation, apoptosis, and differentiation [14]. Smad-2 mediated the signals of transforming growth factor (TGF-beta) including TGF-Β-isoforms and activins responsible for these functions.
SIRT- 1 intricately regulates many cellular processes including cell cycle, and apoptosis [15]. Indeed, in the present study, SIRT-1 protein content was decreased in STZ- rats and was restored following WJ-MSC injection. Furthermore, directly SIRT- 1 is known to modulate the functions of monocytes and macrophages [16], which are compromised in diabetes [17]. In the present study such modulatory effects of SIRT-1 have been shown to be activated by WJ-MSC administration by increasing insulin gene expression concomitant with signaling pathway genes; Samad-2 and PDX-1. In this study the biochemical findings support the histopathological alterations observed in the pancreas. As in diabetic group, there was significant increase of blood glucose level and significant decrease of serum insulin level along the experimental period. These biochemical findings were associated histopathologicaly with vacuolation of acinar epithelium, necrosis of pancreatic islets. These findings are in agreement with previous reports that clearly revealed that STZ –treated rats resulting in massive necrosis of β-cells [18,19].
In the current study, the pancreas from diabetic rat treated with WJ-MSC showed improvement in the histopathological picture in parallel with improvement of biochemical findings.
Moreover, the histopathological results were confirmed by staining pancreatic sections by Aldehyde fuchsine special stain for beta cells granules. In diabetic rats the islets showed low granulated β-cell that indicated destruction of β-cell and no recovery. Otherwise the islets of Langerhans of STZ rats treated with WJ-MSC appeared like normal with heavy granulated β-cell that confirmed the regeneration of β-cell which contains the insulin granules. The ability of WJ-MSCs was confirmed for repairing, restoring the function of islet cells and suppressing the inflammatory cell infiltrations in pancreatic islets [20].
The mechanism of WJ-MSCs in repairing islets of Langerhans is the same as bone marrow stem cells. Some studies showed that these cells are able to migrate and settle in the damaged tissues after systemic intravenous delivery [21]. MSCs have well known immunomodulatory properties on T cells, B cells, dendritic cells and natural killer cells by secreting several regulatory cytokines [22]. Besides their immunomodulatory properties MSCs have paracrine effect on regeneration of resident β-cell [23].
STZ also exerted pathological changes in the liver [19]. In the present study, liver from diabetic rats treated with camel Wharton’s jelly mesenchymal stem cells showed improvement in the hepatic parenchyma and decrease the severity of lesions than liver of diabetic rats. These results agree with different studies suggested a supportive role of undifferentiated WJ-MSCs in rescuing injured liver functions [24]. In addition, WJ-MSCs have properties of anti-inflammatory and anti-fibrosis by endogenous secreted factors such as metalloproteinase [25].
Our results were confirmed by biochemical results of liver enzymes (serum levels of ALT and AST) as rats treated with camel WJ-MSCs showed no significant different when compared with control normal group. MSCs transplantation improved liver function by several mechanisms [26]. As wide variety of growth factors and cytokines synthesized by MSCs which have paracrine effects on local cellular dynamics and lead to hepatocyte regeneration [27]. MSCs have the ability to induce endogenous stem cells to regenerate, they promote HOCs (hepatic oval cells) which considered as facultative progenitor cells in the liver. They have the potential to trans-differentiate into fully functional mature hepatic cells [28]. MSCs have indirect mechanism in treated diabetic liver injury by reducing hyperglycemia as it directly differentiate into islet beta cells [29].
STZ also exerted severe pathological changes in the Kidneys of diabetic rats [30]. The onset of diabetic nephropathy in rats begins after one month of diabetes and there is correlation between kidneys parameters and glycemic levels as hyperglycemia induced by STZ act as strong risk factor for diabetic kidneys disease.
Hyperglycemia induced activation of protein kinase C which leads to increase vascular permeability, increase synthesis of extracellular matrix components and increase production of reactive oxygen species which are important mediators for kidneys injury. Also hyperglycemia stimulates increase expression of different growth factors and activation of cytokines that contribute in kidneys damage [31].
In this study Kidneys of STZ rats treated with WJ- MSCs showed gradual improvement. These results were confirmed by the biochemical findings as serum urea levels of diabetic showed significant increase than control normal. STZ has nephrotoxic effect [32]. However, serum urea level of diabetic group treated with WJ-MSCs showed significant decrease than diabetic group. The histopathological results and biochemical findings revealed the ability of WJ-MSCs in restoration and repair of kidneys diseases. The ability of MSCs in reducing glomerulosclerosis and oxidative stress in animal models of diabetic nephropathy [33].
Competing financial interests
The authors declare no competing of interests.
Author`s contribution
Hala MF El Miniawy, Kawkab A Ahmed, Essam M Ibrahem; contributed to conception, and acquisition, perform the pathology practical examination, drafted manuscript, critically revised manuscript, gave final approval and agrees to be accountable for all aspects of work ensuring integrity and accuracy
Dina Sabry, Tahany A, Ismail, Eman Amer; performance of practical tissue culture and molecular gene and protein expression. They drafted manuscript, critically revised manuscript, and gave final approval for submission.
Funding statement
This research work was funded by Cairo University and animal research institute.
References
- Nyholm B, Pørksen N, Juhl CB, Gravholt CH, Butler PC, et al. (2000) Assessment of insulin secretion in relatives of patients with type2 (non-insulin dependent) diabetes mellitus: evidence of early beta cell dysfunction. J Metabolism 49: 896-905. [Crossref]
- Hussain MA, Theise ND (2004) Stem-cell therapy for diabetes mellitus. Lancet 364: 203-205. [Crossref]
- Wu LF, Wang NN, Liu YS, Wei X (2010) Differentiation of Wharton's jelly primitive stromal cells into insulin-producing cells in comparison with bone marrow mesenchymal stem cells. Tissue Eng Part A 15: 2865-2873. [Crossref]
- Mirpour GAS, Bagheri M, Mohamadnejad M, Alimoghaddam K, Abdolahzadeh L, et al. (2011) In vivo tracking of 111In-oxine labeled mesenchymal stem cells following infusion in patients with advanced cirrhosis. Nucl Med Biol 38: 961-967. [Crossref]
- Hu J, Yu X, Wang Z, Wang F, Wang L, et al. (2013) Long term effects of the implantation of Wharton's jelly-derived mesenchymal stem cells from the umbilical cord for newly-onset type 1 diabetes mellitus. Endocr J 60: 347-357. [Crossref]
- El Miniawy HM, Sabry D, Rashed LA (2012) Invitro Differentiation of Endothelial progenitor stem cells derived from peripheral blood of camel. Journal of Camel Practice And Research 19: 115-121.
- Mohammadi-Sangcheshmeh A, Shafiee A, Seyedjafari E, Dinarvand P, Toghdory A, et al. (2013). Isolation, characterization, and mesodermic differentiation of stem cells from adipose tissue of camel (Camelus dromedarius). In Vitro Cell Dev Biol Anim 49: 147–154. [Crossref]
- Weiss ML, Medicetty S, Bledsoe AR, Rachakatla RS, Choi M, et al. (2006) Human umbilical cord matrix stem cells: preliminary characterization and effect of transplantation in a rodent model of Parkinson’s disease. Stem Cells 24: 781-792. [Crossref]
- Yu J, Vodyanik MA, Smuga-Otto K (2007) Induced pluripotent stem cell lines derived from human somatic cells. Science 318: 1917-1920. [Crossref]
- Aziz AMT, El-Asmar MF, Haidara M, Atta HM, Roshdy NK, et al. (2008) Effect of bone marrow- derived mesenchymal stem cells on cardiovascular complications in diabetic rats. Med Sci Monit 14: 249-255. [Crossref]
- Suvarna K, Layton C, Bancroft JD (2013) Bancroft's Theory and Practice of Histological Technique.7th Churchill Livingstone, Edinburgh.
- Tsai PJ, Wang HS, Lin GJ, Chou SC, Chu TH, et al. (2015) Undifferentiated Wharton’s Jelly Mesenchymal Stem Cell Transplantation Induces Insulin-Producing Cell Differentiation and Suppression of T Cell-Mediated Autoimmunity in Non-Obese Diabetic Mice. Cell Transplant 24: 1555-1570. [Crossref]
- Stoffel M, Stein R, Wright CV, Espinosa R 3rd, Le Beau MM, et al. (1995) Localization of human homeodomain transcription factor insulin promoter factor 1 (IPF1) to chromosome band 13q12.1. Genomics 28: 125-126. [Crossref]
- Pulla VK, Battu MB, Alvala M, Sriram D, Yogeeswari P (2012) Can targeting SIRT-1 to treat type 2 diabetes be a good strategy? A review. Expert Opin Ther Targets 16: 819–832. [Crossref]
- Uribarri J, Cai W, Ramdas M, Goodman S, Pyzik R, et al. (2011) Restriction of advanced glycation end products improves insulin resistance in human type 2 diabetes: potential role of AGER1 and SIRT1. Diabetes Care 34: 1610–1616. [Crossref]
- Maruyama K, Asai J, Ii M, Thorne T, Losordo DW, et al. (2007) Decreased macrophage number and activation lead to reduced lymphatic vessel formation and contribute to impaired diabetic wound healing. Am J Pathol 170: 1178–1191. [Crossref]
- Waer HF, Helmy SA (2012) Cytological and Histochemical Studies in Rat Liver and Pancreas during Progression of Streptozotocin Induced Diabetes and Possible Protection of Certain Natural Antioxidants. J Nutr Food Sci 2: 165.
- Rajesh R, Chitra K, Padmaa M, Paarak H (2014) Antidiabetic And Histopathological Studies Of Aerial Parts Of Aerva Lanata Linn Juss On Streptozotocin Induced Diabetic Rats". World Journal Of Pharmacy And Pharmaceutical Sciences 3: 455-471.
- Hu J, Wang Y, Wang F, Wang L, Yu X, et al. (2015) Effect and mechanisms of human Wharton’s jelly-derived mesenchymal stem cells on type 1 diabetes in NOD model. Endocr J 48: 124–134. [Crossref]
- Hanley PJ (2015) Therapeutic mesenchymal stromal cells: where we are headed. Methods Mol Biol 1283: 1-11. [Crossref]
- Ge W, Jiang J, Baroja ML, Arp J, Zassoko R, et al. (2009) Infusion of mesenchymal stem cells and rapamycin synergize to attenuate alloimmune responses and promote cardiac allograft tolerance. Am J Transplant 9: 1760-1772. [Crossref]
- Hao H, Liu J, Shen J, Zhao Y, Liu H, et al. (2013) Multiple intravenous infusions of bone marrow mesenchymal stem cells reverse hyperglycemia in experimental type 2 diabetes rats. J Biochem Biophys Res Commun 436: 418-423. [Crossref]
- Anzalone R, Lo Iacono M, Corrao S, Magno F, Loria T, et al. (2010) New emerging potentials for human Wharton’s Jelly mesenchymal stem cells: Immunological features and hepatocyte-like differentiative capacity. Stem Cells Dev 19: 423-438. [Crossref]
- Kim DW, Staples M, Shinozuka K, Pantcheva P, Kang SD, et al. (2013) Wharton’s Jelly-Derived Mesenchymal Stem Cells: Phenotypic Characterization and Optimizing Their Therapeutic Potential for Clinical Applications. Int J Mol Sci 14: 11692-11712. [Crossref]
- El-Ansary M, Abdel-Aziz I, Mogawer S, Abdel-Hamid S, Hammam O, et al. (2012) Phase II Trial: undifferentiated versus differentiated autologous mesenchymal stem cells transplantation in Egyptian patients with HCV induced liver cirrhosis,”. Stem Cell Reviews 8: 972-981. [Crossref]
- Nagaishi K, Ataka K, Echizen E, Arimura Y, Fujimiya M (2014) Mesenchymal stem cell therapy ameliorates diabetic hepatocyte damage in mice by inhibiting infiltration of bone marrow-derived cells. Hepatology 59: 1816–1829. [Crossref]
- Kim S, Shin JS, Kim HJ, Fisher RC, Lee MJ, et al. (2007) Streptozotocin-induced diabetes can be reversed by hepatic oval cell activation through hepatic transdifferentiation and pancreatic islet regeneration. Lab Invest 87: 702–712. [Crossref]
- Wan Y, Garner J, Wu N, Phillip L, Han Y, et al. (2016) Role of stem cells during diabetic liver injury. J Cell Mol Med 20: 195-203. [Crossref]
- Kiran G, Nandini CD, Ramesh HP, Salimath PV (2012) Progression of early phase diabetic nephropathy in streptozotocin-induced diabetic rats: Evaluation of various kidney-related parameters. Indian J Exp Biol 50: 133-140. [Crossref]
- Navarro-González JF, Mora-Fernández C (2008) The role of inflammatory cytokines in diabetic nephropathy. J am soc nephrol 19: 433-442. [Crossref]
- Parvizi MR, Parviz M, Tavangar SM, Soltani N, Kadkhodaee M, et al. (2014) Protective effect of magnesium on renal function in STZ-induced diabetic rats. J Diabetes Metab Disord 13: 84. [Crossref]
- Papazova DA, Oosterhuis NR, Gremmels H, van Koppen A, Joles JA, et al. (2015) Cell-based therapiesfor experimental chronic kidney disease: a systematic review and meta-analysis. J Dis Model Mech 8: 281–293. [Crossref]