Post-homogenization instability of phosphorylation sites in proteins, and the insensitivity and high costs of most proteomics analytical methods have been major barriers in tracking cell signalling networks in minute specimens of cells and tissues. While antibody microarrays have been promising tools for quantifying changes in protein expression and phosphorylation, the interpretation of findings from their applications have been complicated by issues of protein- protein interactions and cross-reactivity with off-target proteins. We used the human A431 cervical carcinoma cell line that over-expresses the epidermal growth factor (EGF) receptor to investigate its signal transduction mechanisms. Chemical cleavage of proteins at cysteine residues at the time of homogenizing the A431 cells permitted preservation of the autophosphorylation of this receptor in response to brief stimulation of these cells with EGF and revealed many downstream signalling events. Most of the EGF-induced changes in protein phosphorylation observed with the antibody microarray were validated by Western blotting with the intended targets, although many of these also false positives that arose from cross-reactivity with the EGF receptor itself. Some false-negatives from blocked epitopes may have stemmed from interactions with SH2 domain-containing adapter proteins that were resistant to chemical cleavage and internal interactions of flanking arginine and lysine residues with phosphosites.
Antibody microarray, Epidermal growth factor (EGF), A431 cells, Protein phosphorylation, Cell signaling, Signal transduction
Protein phosphorylation may be the predominant mechanism for the reversible post-translational regulation of proteins [1,2]. The vast majority of proteins in the human proteome may be subjected to phosphorylation, and although over 250,000 distinct phosphosites have already been identified by mass spectrometry (www.phosphosite.org)[3], the actual number of potential sites may be closer to a million (www.phosphonet.ca). Tracking changes in protein phosphorylation provides valuable insights into the status of signalling networks within cells. To preserve the phosphorylation of proteins in lysates from cells and tissues, the inclusion of cocktails of protein phosphatase and protease inhibitors in homogenization buffers has been routinely used for over three decades [4]. To explore how well this practice actually worked, we focused on tracking the phosphorylation of the EGF receptor and downstream signalling proteins in A431 cells, which over-express this receptor-tyrosine kinase and undergo apoptosis with longer term exposure to EGF [5-10].
Here we demonstrate that homogenization of cells in standard buffer with phosphatase inhibitors is insufficient to stabilize most protein phosphorylations, and we show that fragmentation of proteins at cysteine residues is as an effective strategy to better maintain the phosphorylated state of the phosphosites so that they can be monitored with high content antibody microarrays. While antibody microarrays may have issues with cross-reactivity with off-target proteins, they can permit the simultaneous tracking of hundreds of diverse proteins of interest with high sensitivity and speed.
Cell culture and cysteine chemical cleavage
Human A431 cervical carcinoma cells (American Type Culture Collection, Manassas, VA; tested for, and found free of, Mycoplasma contamination) were validated by Western blotting with three different pan-specific antibodies for the EGF receptor (Cat. NK052-4, NK052-5 and NK052-6, Kinexus Bioinformatics, Vancouver, B.C., Canada), which demonstrated at least 5-fold higher expression levels for this protein than found in a panel of other human cell lines and mouse tissues. The A431 cells were grown in 100 x 20 mm tissue culture dishes (Cat. 83.3902 Sarstedt) in Dulbecco’s Modified Eagle Medium (DMEM) (Cat. 12800017, ThermoFisher, Rockford, IL) supplemented with 10% fetal bovine serum (FBS) (Cat. 1248320, ThermoFisher) up to ~70% confluence and were then incubated in DMEM without FBS for 18 hours. The cells were treated with 100 ng/ml EGF for up to 5 min at 37ºC, and washed with ice-cold phosphate-buffered saline (PBS). After removal of the PBS by aspiration, the cells were scrapped from the dishes with a rubber policeman into 100 µl of one of three types of following ice-cold lysis buffers: Standard Homogenizing Buffer (SHB) [1% Triton X-100, 5 mM EDTA, 2 mM EGTA, 20 mM MOPS, 25 mM NaF, 25 mM Na4P2O7, 1.0 mM Na3VO4, 60 mM beta-glycerophosphate, 50 nM phenylarsine oxide, 1 mM Pefabloc, 3 mM benzamidine, 10 µM leupeptin, 0.5 µM aprotinin, 1 mM dithiothreitol, 100 mM NaCl] (for Methods 1 and 2); CCC Homogenizing Buffer [SHB that also included 0.4 mM Tris(2-carboxyethyl)phosphine hydrochloride (TCEP) at pH 9] (for Methods 3 and 4); and SDS Homogenizing Buffer [25 mM Tris-HCl, pH 6.8, 10% glycerol, 1% beta-mercaptoethanol; 0.8% sodium dodecylsulfate, 0.016% Bromophenol blue] (for Western blotting). Most of these buffer components were sourced from Sigma-Aldrich (Missouri, MO). The cell samples in all three lysis buffers were subjected to sonication for 40 seconds in intervals of 10 seconds with 10 seconds intermissions over ice. In the case of the SHB homogenization method, the homogenates were then immediately ultracentrifuged for 30 minutes at 4ºC at 50,000 rpm in a Sorvall Discovery M120 Ultracentrifuge in a S120AT2-0278 titanium rotor, and the resulting supernatant fractions were stored at -80°C until further use. In the case of the CCC homogenization method, right after sonication, the homogenates were incubated for 15 minutes with 6 mM 2-Nitro-5-thiocyanatobenzoic acid (NTCB) (Cat. N7009, Sigma-Aldrich) at 37ºC and then subjected to ultracentrifugation for 30 min at 20ºC at 50,000 rpm. The pH of the TCEP prepared supernatants was neutralized to pH 7.0, and these preparations were stable at room temperature for at least a week, but were kept at -20ºC for longer term storage.
For some experiments, A431 cell detergent-solubilized lysates prepared with Standard Homogenizing Buffer were also subjected to cysteine chemical cleavage after the supernatants were thawed after storage at -80ºC. These lysates were incubated at 37°C with 0.4 mM TCEP at pH 9 for 30 min, and then with 6 mM NTCB at 37°C for 30 min.
Protein labelling
Cell lysates prepared with the Standard homogenizing method, and not subjected to chemical cleavage, had their pH adjusted to ~ pH 8 with 100 mM sodium bicarbonate. Each sample of 100 µg of lysate protein was incubated with 40 µg of a 50/50 dye mixture of Alexa Fluor 546 dye (Cat. A20002, ThermoFisher, Rockford, IL) and Sulfo-Cyanine3 dye (Cat. 11320, Lumiprobe, Hannover, Germany) for 1 hour. The labeled proteins were resolved from unreacted dye using a 0.5 ml MicroSpin G25 Column (Cat. 27-5325-01, GE Life Sciences, Pittsburgh, PA) that was equilibrated with distilled H2O. Typically, 40 µl of the dye-labeled protein sample were applied on to the G-25 resin and the column was centrifuged for 2 min at 735 x g in a HERMLE benchtop centrifuge. A further 20 µl of PBS were then applied on to the G-25 resin and a second centrifugation was performed to recover over 75% of the dye-labeled protein in the combined eluted fractions.
Cell lysates that were subjected to CCC were incubated directly into 40 µg of the 50/50 dye mixture for 1 hour, and subsequently purified using a G-25 spin column as described in the previous paragraph. Lysates that were chemically cleaved at time of homogenization were adjusted into ~pH 8 with 100 mM sodium bicarbonate, and incubated with either 40 µg of the 50/50 dye mixture for 1 hour or with 50 µg of Sulfo-NHS-biotin for 1 hour (Cat. A8001, ApexBio, Houston, TX). After incubation, the protein samples were resolved from unbound dye or unbound biotin with a G-25 spin column.
For dye-labelling of the anti-biotin antibody, 25 µg of antibody (Cat. NM001-4, Kinexus Bioinformatics) were equilibrated with PBS following application to a G-25 spin column, and the pH of the recovered antibody solution was adjusted to ~8 with 100 mM sodium bicarbonate. The antibody was incubated with 10 µg of the 50/50 dye mixture for 1 hour, and purified from unreacted dye with a G25 column.
Antibody microarray analysis
The labeled protein lysate samples and the labeled detection antibody were diluted in PBS with 0.05% Tween-20 and 50 mM ethanolamine (Cat. E9508, Sigma-Aldrich). The Kinex™ KAM-900P antibody microarrays (Cat. AR-900P, Kinexus Bioinformatics) that were used permitted analyses of two separate samples in two divided fields on the same slide with duplicate measurements for each sample and capture antibody. The microarray was blocked with 25 mM ethanolamine in pH 8.5, and 100 mM sodium borate for 1 hour at 20ºC and was washed in three baths of PBS with 0.05% Tween-20 and a final wash in distilled water. The microarray slide was dried with nitrogen airflow, placed onto a dual well FAST slide incubation chamber (Cat. Z721336, Sigma-Aldrich) with a FAST frame slide holder (Cat. Z721212, Sigma-Aldrich) and incubated with two diluted cell lysate protein samples (400 µl of each) in a humidity chamber for 2 hours. For dye-labeled protein samples, the slides were washed and dried after incubation and scanned at 543 nm with a ScanArray GX Microarray scanner (Perkin-Elmer, Wellesley, MA). For biotin-labelled protein samples, the slides were washed, dried, secured into the FAST frame with dual well incubation chambers, and incubated with the diluted dye-labeled anti-biotin antibody for 90 min in the humidity chamber. After incubation, the slides were washed, dried under nitrogen, and scanned at 543 nm. The fluorescent signals from the scanned microarrays that were captured in a tif file image were quantified with ImaGene 9.0 microarray image analysis software (BioDiscovery, El Segundo, CA) and normalized according to the sum of all of the recorded signals per field. The values for duplicate measurements were averaged, and the mean value for the difference in duplicates from the average was typically ~14%. Replicate data sets from the same experimental category were averaged and significant differences in signal intensities between the starved and the EGF treated samples per testing category were determined using a paired Student T test (n=3 to 5). Significant differences were classified as having a p value of ≤0.05.
Immunoblotting analysis
Protein lysate samples were subjected to standard Western blotting where different lysate samples were deposited into separate lanes (~20 µg protein per well), resolved on a multi-lane SDS-PAGE gel by electrophoresis, and probed with a primary antibody after their electrotransfer on to a nitrocellulose membrane. By contrast, Kinetworks multi-immunoblotting analyses involved resolution of proteins in a 300 µg single lysate sample by SDS-PAGE and subsequent immunoblotting overnight at 4ºC with a different primary antibody in each channel of a 20-lane multiblotter (Immunetics, Boston, MA) 17). Membranes were later rinsed with Tween Tris-buffered saline, pH 7.5, and then incubated with horseradish peroxidase conjugated secondary anti-rabbit IgG antibody for 30 min at room temperature. The immunoblots were developed with enhanced chemiluminescence (ECL) Plus reagent (Amersham, Arlington Heights, IL), and signals were captured by a Fluor-S MultiImager and quantified using Quantity One software (Bio-Rad, Hercules, CA). All of the pan- and phosphosite-specific rabbit polyclonal antibodies used for immunoblotting were developed in-house at Kinexus Bioinformatics, and are commercially available from the company.
Frequency analysis algorithms
Steps for generating cysteine fragment size frequencies: Protein sequences were imported from a .txt file to MS-Excel and delimited by the character “C” to create fragments in individual cells that were cut at cysteine residues. The sizes of the fragments were determined by the character length of each cell plus 1 to account for the missing cysteine residue. The frequencies of fragment lengths from 1 to the largest fragment size were tallied up.
Steps for generating lysine fragment size frequencies: Protein sequences were imported from a .txt file to MS-Excel and delimited by the character “K” to create fragments in individual cells that were cut at lysine residues. The sizes of the fragments were determined by the character length of each cell plus 1 to account for the missing lysine residue. The frequencies of fragment lengths from 1 to the largest fragment size were tallied up.
Steps for generating lysine-arginine fragment (trypsin cut) size frequencies: In a text editor, all occurrences of “KP” were replaced with XX and all occurrences of “RP” were replaced with ZZ, since trypsin does not cut at lysine or arginine residues that are followed by a proline. The remaining “K” and “R” were both replaced by “O”. The .txt file was then imported to MS-Excel and delimited by the character “O” to create fragments in individual cells that were cut at either lysine or arginine residues. The sizes of the fragments were determined by the character length of each cell plus 1 to account for the missing lysine or arginine residue. The frequencies of fragment lengths from 1 to the largest fragment size were tallied up.
Steps for generating protein length frequencies: Protein sequences were imported from a .txt file to MS-Excel. The lengths of the proteins were determined by the character length of each cell. The frequencies of protein lengths from 1 to the largest fragment size were tallied up.
Steps for generating amino acid frequencies: Protein sequences were imported from a .txt file to MS-Excel. In separate columns, the occurrences of each amino acid were tallied up for each sequence. The frequencies of individual amino acids were summed up and divided by the total amino acid count to get the percent frequencies of each amino acid.
Post-homogenization stability of protein phosphorylation in EGF treated A431 cells
A431 cells were cultured in the absence of serum factors overnight and then briefly exposed to EGF for up to 5 minutes prior to harvesting in a buffer that contained a wide diversity of protein phosphatase and protease inhibitors. To access the phosphorylation of EGF receptor, Western blotting was performed with detergent solubilized lysates from these cells with affinity-purified antibodies for five distinct phosphosites in the ~160 kDa receptor (Fig. 1A-E). In parallel, other cultures of A431 cells that were subjected to the same treatments were directly homogenized in SDS-PAGE sample buffer and similarly analyzed by Western blotting with the same EGF receptor phosphosite-specific antibodies (Fig. 1F-J). For all five phosphosites, it was evident that most of the EGF receptors phosphorylations induced by EGF were lost with the standard homogenizing buffer that contained 1% Triton X100 (Fig. 1). While some of the improved signals for EGF receptor phosphosites may have partly arisen with the better extraction of the EGF receptor from the plasma membranes of A431 cells with stronger anionic detergent SDS, most of this receptor was actually solubilized with Triton-X100 (Supplemental Fig. S5).
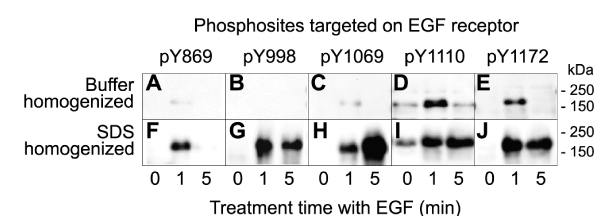
Figure 1: Instability of EGF receptor phosphosites in lysates prepared from EGF-treated A431 cells homogenized in standard buffers. Lysates from A431 cells that were serum-starved for 18 hours and then treated without and with 100 ng/ml EGF for 1 or 5 min were prepared by harvesting in standard homogenizing buffer that included protein phosphatase and protease inhibitors (A-E) or directly in sodium-dodecylsulfate-polyacrylamide gel electrophoresis (SDS-PAGE) buffer (F-J). The detergent-solubilized lysates were subjected to SDS-PAGE and Western blotted with five different phosphosite-specific antibodies that targeted distinct EGF receptor phosphosites. The region of the immunoblots that featured the EGF receptor are shown here and full-length immunoblots are provided in Supplemental Fig. S4 A-J. Additional immunoblotting data with these EGF receptor phosphosite-specific antibodies as well as pan-specific antibodies for this receptor are shown in Supplemental Fig. S5.
Chemical cleavage of proteins to maintain their phosphorylation states
The primary objective of this study was to accurately track the phosphorylation status of hundreds of signalling proteins from unfractionated crude lysates from cells with samples that contained 100 µg or less protein. To this end, we used the Kinex™ KAM-900P antibody microarray. This commercial microarray features 613 different phosphosite-specific antibodies as well as 265 pan- specific antibodies for many of the same low abundance phosphoprotein targets. Each antibody was printed in duplicate spots for probing with a lysate sample, and two samples could be analyzed independently on the same slide. As the presence of SDS in lysate buffers would interfere with antigen-antibody complex formation, we had to develop an alternate strategy to preserve the phosphorylation of proteins. Here, we explored four protocols for their effectiveness to monitor changes in protein phosphorylation and expression on this microarray (Supplemental Fig. S1).
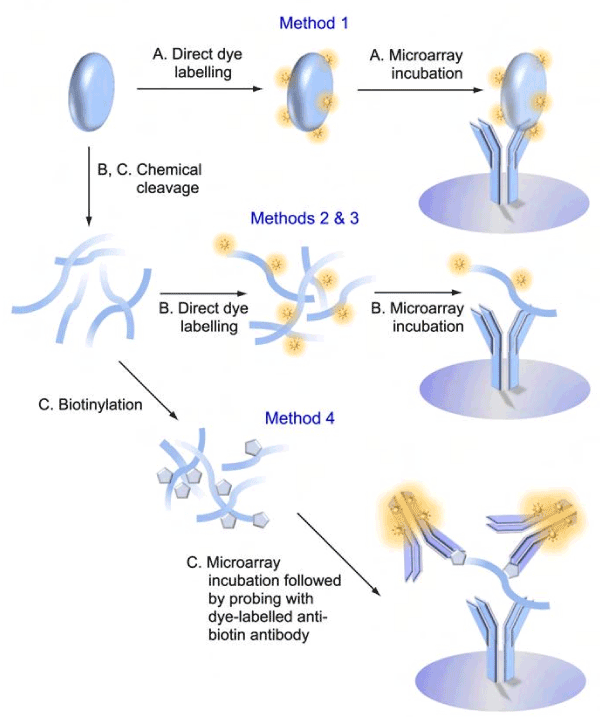
Signals from captured proteins detected on antibody microarrays can be influenced by many variables that could produce false positive and negative results. Such factors include the size of the target protein, the amount of dye that it binds, and its interactions with other proteins in complexes. Moreover, endogenous phosphatases and kinases may induce post-homogenization changes in protein phosphorylation. Many of these issues can be mitigated by cleaving the protein samples into peptide fragments, thus normalizing the amount of dye bound to the peptide epitopes and breaking protein-protein interactions.
Previously, we found that successive treatment with Tris (2-carboxyethyl) phosphine hydrochloride (TCEP) and 2-Nitro-5-thiocyanatobenzoic acid (NTCB), which cleaves proteins at cysteine residues, could be used in combination with antibody microarrays to reduce the interference of protein-protein interactions [11,12]. Many of the epitope sequences used to generate the antibodies used on the KAM-900P microarray avoided the inclusion of cysteine residues, and this afforded the opportunity to generate peptide fragments that retained the epitopes for these antibodies.
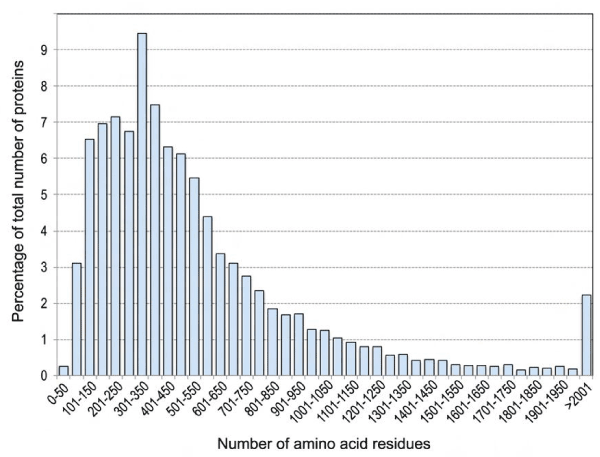
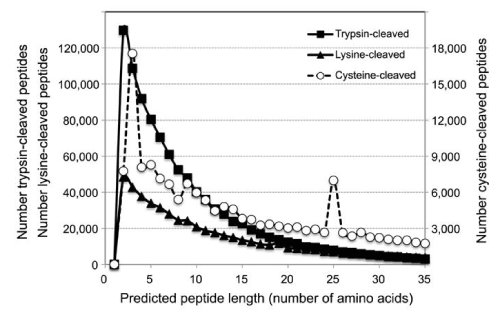
To get a notion of what might be the typical length of peptides generated with cysteine chemical cleavage (CCC) buffer, we retrieved the sequences of 20,095 human proteins from the UniProt website. About 67% of these proteins ranged from 100 to 600 amino acids in size (Supplemental Fig. S2), and of the 11,300,955 amino acid residues contained in these proteins, 2.3% corresponded to cysteine residues (Supplemental Table S1). Based on this, we would expect the average length of a CCC-generated peptide from the human proteome to be around 40 residues. We determined the predicted sequences of all of the human peptides following cleavage at cysteine residues, and the frequencies of their lengths (Supplemental Fig. S3, Supplemental Table S2). Out of 245,056 predicted peptides, about 63% were 35 amino acids long or shorter. By contrast, about 98% of the 1,031,309 predicted peptides with trypsin had lengths of 35 amino acids or less. This indicates that CCC generated protein fragments contain on average more than one lysine residue. In fact, CCC-generated peptides of 35 amino acids or less were calculated to have on average 3 lysine residues. At least 61% of all of the predicted CCC-generated peptides featured lysine residues. Since fluorescent dye labeling of peptides occurs on free amine groups found at the N-terminus of proteins and on lysine residues, CCC generated protein fragments are more likely to be successfully labelled than peptides generated by trypsin cleavage.
Antibody microarray analyses of EGF treated A431 cells
To investigate the effectiveness of CCC method, we subjected lysates from EGF-treated A431 cells to analysis with the KAM-900P antibody microarray. Scanned images of fluorescent dye-labelled proteins captured with this microarray from serum-starved cells treated for 5 minutes with EGF prior to harvesting revealed a marked reduction in the intensities of most bound lysate proteins when they were subjected to CCC after ultracentrifugation of solicited, detergent-solubilized lysates (Method 2). Quantification of the individual antibody spots demonstrated an overall 70% reduction in fluorescent dye signals (Supplemental Table S3) as compared to usage with standard homogenizing buffer (SHB) and no protein fragmentation (Method 1; Fig. 2A, B). By contrast, if the CCC was performed at the time of homogenization and during the initial sample processing (Method 3), then the strengths of the individual fluorescent dye signals were usually comparable to those observed without CCC (Fig. 2C and Supplemental Table S3). This supported the notion that the fragmentation of proteins immediately after cell homogenization markedly inhibited the actions of endogenous protein phosphatases that rapidly dephosphorylated lysate proteins. However, when the data from replicated studies with fluorescent dye-labeled lysate proteins was analyzed in aggregate for EGF-induced changes of 35% or greater in protein expression or phosphorylation, relatively few leads were observed to be statistically significant in three or more replicated experiments (Table 1).
Table 1: Comparison of lead generation from different homogenization and detections systems using EGF-treated A431 cells and the KAM-900P antibody microarray.
Method |
Protocol |
Antibody Type |
%CFC ≥ -50% |
%CFC ≥ -35% |
%CFC ≥ +35% |
%CFC ≥ +50% |
%CFC ≥ +75% |
%CFC ≥ +100% |
%CFC ≥ +150% |
1 |
SHB+DDL |
Pan-+Phospho- |
0 |
0 |
3 |
1 |
0 |
0 |
0 |
2 |
SHB+CCC+DDL |
Pan-+Phospho- |
0 |
0 |
4 |
0 |
0 |
0 |
0 |
3 |
CCCB+DDL |
Pan-+Phospho- |
0 |
0 |
7 |
2 |
1 |
0 |
0 |
4 |
CCCB+DBL |
Pan-+Phospho- |
9 |
33 |
155 |
131 |
81 |
48 |
21 |
4 |
CCCB+DBL |
Pan |
1 |
12 |
48 |
41 |
21 |
13 |
7 |
4 |
CCCB+DBL |
Phospho- |
8 |
21 |
107 |
90 |
60 |
35 |
14 |
Lysates from A431 cells that were serum-starved for 18 hours and then treated without and with 100 mg/ml EGF for 5 min were prepared by harvesting in Standard Homogenizing Buffer (SHB) or the cells were homogenized directly into Cysteine Chemical Cleavage Buffer (CCCB). For Method 1, lysate proteins from SHB processed cells were directly dye-labelled (DDL) and incubated with the KAM-900P antibody microarrays. For Method 2, lysate proteins from SHB cells were subsequently subjected to Cysteine Chemical Cleavage (CCC), and then dye-labelled prior to KAM-900P incubations. For Method 3, A431 cells were homogenized in CCCB, and then directly dye-labelled for KAM-900P analyses. For Method 4, A431 cells were homogenized in CCCB, and then directly biotin labelled (DBL). Following initial incubation with KAM-900P microarrays, the captured biotinylated lysate proteins were detected with dye-labelled anti-biotin antibodies. Each set of three to five lysates from untreated and three to five lysates from EGF-treated were separately analysed, and duplicate measurements were carried out with each antibody microarray for each lysate. Only antibodies that revealed EGF induced percentage changes from controls (%CFC) of 35% or greater that were statistically significant with p values of ≤ 0.05 with the paired, two-tailed Student T-test are shown. The full data set from which the results shown here were derived is provided in Supplemental Table S3.
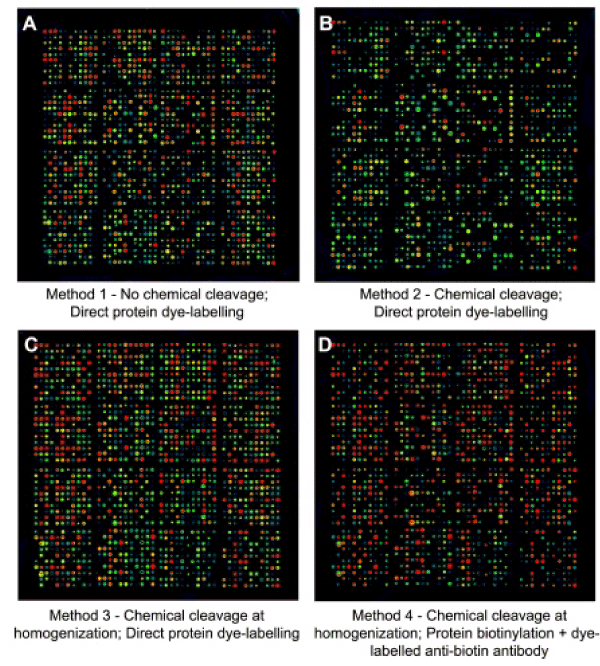
Figure 2: Scanned images of Kinex™ KAM-900P antibody microarrays incubated with lysates from EGF-treated A431 cells subjected to alternative lysate sample and antibody microarray processing strategies. A431 cells were serum-starved for 18 hours and then treated with 100 ng/ml EGF for 5 min and subjected to the four different protocols that are outlined in Supplemental Fig. S1. The strongest signals appear red and the weakest signals are blue.
One of the major issues associated with direct-dye labeling of intact lysate proteins or their fragments following CCC was the issue of carryover of free dye following the labeling reaction and resolution from dye-bound protein by gel filtration over a Sephadex G25 spin-column. While this procedure effectively removed more than 90% of the unreacted dye, residual free dye was still able to cause partial direct labelling of the capture antibodies on the microarray, despite the inclusion of 50 mM ethanolamine in an attempt to neutralize this dye. This resulted in higher background signals for many of the capture antibodies, and reduced the apparent changes in signals that resulted from the lysate proteins with respect to expression or phosphorylation. To address this problem, we devised Method 4 that involved chemical cleavage at the time of cell lysate preparation, but direct biotin-labelling (DBL) of the cellular protein rather than direct-dye labelling (DDL). Following capture on the KAM-900P antibody microarray, the biotinylated proteins were subsequently detected with fluorescent dye-labelled anti-biotin antibodies. We found this worked better than fluorescent dye-tagged avidin for detection, as this produced much lower backgrounds in control experiments, and more dye could be bound to the antibody than to avidin, which is a third of the size of immunoglobulin G.
Application of the DBL method to analyze lysates from EGF-treated A431 cells produced more than 20-times the number of statistically significant leads than observed with the DDL Method 3 (Table 1). Over 20% of tested pan- and phosphosite-specific antibodies on the KAM-900P microarray revealed EGF-induced changes of 35% or greater, and this was clearly evident from visual inspection of the scanned images of the arrays (Fig. 3) and when these array images were quantified from multiple experiments (Table 2). All of the following studies were based on comparison with the results from experiments with the antibody microarrays using the DBL Method 4.
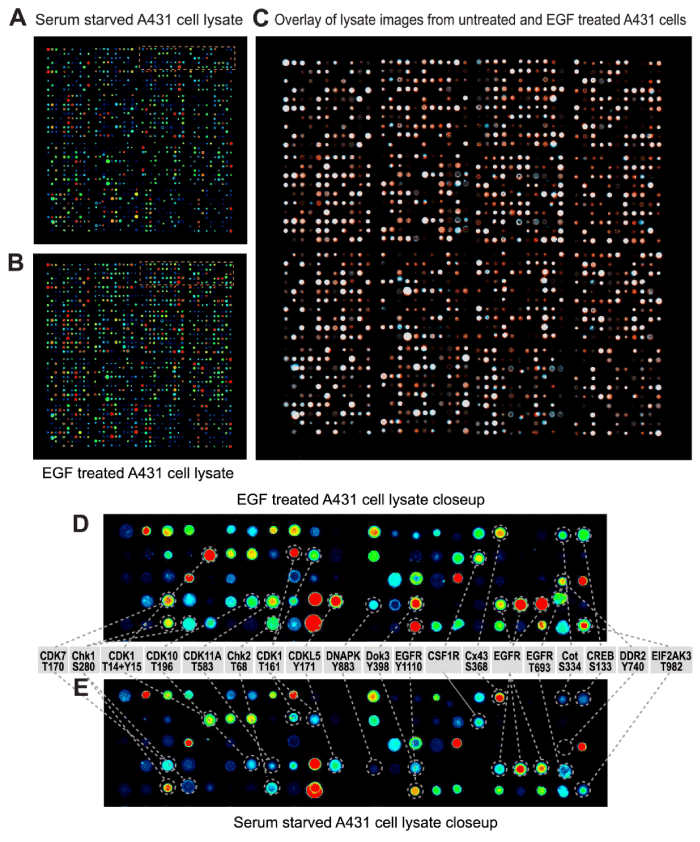
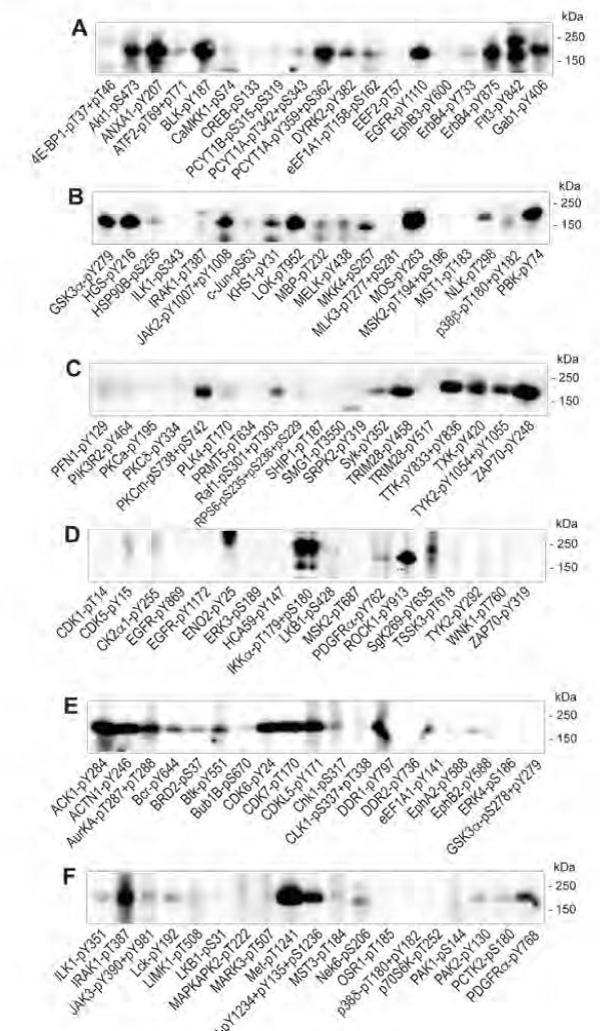
Figure 3: Visualization of cysteine chemically cleaved lysates from EGF-treated A431 cells subjected to antibody microarray analyses. Lysates from A431 cells that were serum-starved for 18 hours and then treated without (A,E) and with 100 ng/ml EGF for 5 min (B,D) were prepared by directly homogenizing the cells into cysteine chemical cleavage buffer and the detergent-solubilized lysate proteins were subsequently labeled with biotin. Following incubation with a Kinex™ KAM-900P antibody microarray, the captured biotinylated lysate proteins were then detected with fluorescent dye-labeled anti-biotin antibody. The scanned microarray images were colorized (blue for panel A and red for panel B) with Adobe Photoshop and overlaid (C). In panel C, EGF induced increases appear red, decreases appear blue and unchanged signals show up as white. The orange boxed regions in the upper right corners of panels A and B are magnified in panels E and D, respectively and EGF altered target proteins are identified. In panels A, B, D and E, the strongest signals appear red and the weakest signals are blue. Similar results were obtained in three independent experiments.
Validation of antibody microarray leads by immunoblotting
At least 107 different phosphosite-specific antibodies showed EGF-induced changes in phosphorylation of captured lysate proteins on the KAM-900P microarray (Table 2, Supplemental Table S4). We undertook validation of many of the key positive results as well as negative results to establish the reliability of the antibody microarray data from application of Method 4 with CCC and DBL. Western blots with many of the phosphosite-specific antibodies that showed EGF-induced changes are shown in Fig. 4, and Supplemental Figs. S4, S5 and S6, and the findings with specific antibodies are listed in Table 2.
Table 2: Key EGF-induced changes in protein phosphorylation in A431 cells as detected with the KAM-900P antibody microarray.
Full target protein name |
Phospho site (human) |
Serum starved average ± %S.Dev. |
EGF treated average ± %S.Dev |
Percent change from control |
Immuno-blotting validation |
ACK1 (TNK2)‡ |
Y284 |
17268±15 |
30805±7 |
+78* |
TPc |
ACTN1‡ |
Y246 |
1585±34 |
2472±19 |
+56** |
FPc |
ALK‡ |
Y1507 |
17176±22 |
26279±17 |
+53*** |
TP |
Bcr |
Y177 |
2161±26 |
3685±4 |
+71* |
|
Bcr |
Y591 |
9416±24 |
14945±10 |
+59* |
|
Bcr‡ |
Y644 |
6540±20 |
12427±7 |
+90** |
FPc |
BLK |
Y188 |
2962±23 |
10013±21 |
+238* |
FPc |
BLNK |
Y84 |
2221±19 |
4370±5 |
+97* |
|
BRD2‡ |
S37 |
651±18 |
1038±7 |
+59** |
FPc |
Btk‡ |
Y551 |
537±22 |
926±11 |
+73* |
FPc |
BUB1B‡ |
S670 |
4643±21 |
8192±10 |
+76* |
FPc |
Caldesmon |
S789 |
604±29 |
897±16 |
+49* |
|
Caveolin 2 (CAV2) |
S36 |
878±27 |
1334±16 |
+52* |
|
CDK1 (CDC2) |
T14+Y15 |
8280±5 |
18496±14 |
+123* |
|
CDK1 (CDC2) |
T161 |
1960±29 |
3443±10 |
+76* |
FP |
CDK6‡ |
Y24 |
5827±22 |
10380±20 |
+78* |
FPc |
CDK7‡ |
T170 |
19565±13 |
35186±13 |
+80* |
FPc |
CDKL5‡ |
Y171 |
5107±3 |
9406±5 |
+84*** |
FPc |
Chk1 (CHEK1)‡ |
S317 |
5249±10 |
9970±6 |
+90*** |
FPc |
CLK1 |
S337+T338 |
399±25 |
665±18 |
+67** |
FP |
Cofilin 1 (CFL1) |
S3 |
4239±10 |
7146±7 |
+69* |
TP |
Cofilin 2 (CFL2) |
S3 |
10174±20 |
15496±16 |
+52* |
|
CREB1 |
S133 |
9502±16 |
15112±3 |
+59* |
|
Crystallin aB |
S45 |
263±21 |
394±14 |
+50* |
|
Csk |
Y184 |
682±22 |
1883±2 |
+176*** |
TP |
Cyclin E1 |
T395 |
923±23 |
1877±2 |
+103* |
|
DDR1 |
Y796+Y797 |
3309±21 |
6122±3 |
+85* |
|
DDR1‡ |
Y797 |
3311±14 |
7515±7 |
+127* |
FPc |
DDR2 |
Y736 |
12420±16 |
34440±3 |
+177*** |
FP |
DNAPK |
T2609 |
1147±25 |
2693±3 |
+135* |
FP |
eEF1A1‡ |
Y141 |
1120±24 |
2597±13 |
+132*** |
FPc |
EGFR |
Y1110 |
894±21 |
2983±8 |
+234**** |
TP |
EGFR |
Y1172 |
501±26 |
906±18 |
+81*** |
TP |
EGFR |
Y1172 |
667±33 |
1802±24 |
+170* |
TP |
eIF2a |
S52 |
3779±18 |
1653±15 |
-56* |
|
eIF4G |
S1231 |
743±18 |
1251±9 |
+68*** |
|
Elk1 |
S383 |
4560±24 |
7411±15 |
+63* |
|
EphA2‡ |
Y588 |
1642±20 |
3061±11 |
+86*** |
FPc |
EphB2‡ |
Y780 |
26139±13 |
43859±10 |
+68*** |
FPc |
ErbB2 |
Y877 |
19503±38 |
52057±11 |
+167* |
FP |
ERK4 (MAPK4) |
S186 |
1192±26 |
2158±10 |
+81** |
FP |
Ezrin |
Y354 |
335±23 |
622±10 |
+86*** |
|
FAK |
S722 |
332±17 |
686±7 |
+106** |
FP |
FGR |
Y412 |
13687±6 |
5123±11 |
-63*** |
|
Full target protein name |
Phospho site (human) |
Serum starved average ± %S.Dev. |
EGF treated average ± %S.Dev |
Percent change from control |
Immuno-blotting validation |
G6PD |
Y401 |
100703±14 |
48516±31 |
-52* |
|
GluR1 |
S849 |
6241±38 |
13781±31 |
+121* |
|
|
S278+Y279 |
274±15 |
487±6 |
+78*** |
FP |
HCA59 |
Y147 |
231±16 |
382±11 |
+65** |
FP |
HDAC5 |
S498 |
1995±8 |
3726±2 |
+87**** |
|
Hsp27 |
S78 |
1624±5 |
3749±15 |
+131* |
|
|
Y156+T157 |
1007±23 |
1523±20 |
+51* |
FP |
IkBe |
S161 |
2214±17 |
3470±3 |
+57* |
|
ILK1‡ |
Y351 |
194±68 |
4830±12 |
+2394* |
FPc |
Integrin a4 |
S1021 |
18047±14 |
38721±7 |
+115** |
|
Intersectin-2‡ |
Y968 |
1936±7 |
4000±4 |
+107* |
TP |
IRAK1‡ |
T387 |
1871±14 |
4006±6 |
+114** |
TP |
IRAK4 |
T345+S346 |
1862±13 |
7222±13 |
+288** |
|
JAK3 |
Y980+Y981 |
557±27 |
894±11 |
+61* |
FP |
c-Jun |
S73 |
1065±26 |
2550±7 |
+140** |
|
c-Jun |
S243 |
2858±9 |
7068±3 |
+147*** |
|
Lck |
Y505 |
908±18 |
1643±8 |
+81*** |
|
LIMK1 |
T508 |
7589±15 |
11908±9 |
+57*** |
FP |
LKB1 |
S31 |
9102±19 |
17662±9 |
+94*** |
FP |
LKB1 |
S428 |
191±22 |
353±8 |
+85** |
FP |
MAPKAPK2 |
T222 |
3983±17 |
7534±5 |
+89* |
FP |
MAPKAPK2 |
Y225+T226 |
1099±9 |
1974±5 |
+80**** |
TP |
MARK3 |
T507 |
255±20 |
410±19 |
+61* |
TP |
MEK2 (MAP2K2) |
T394 |
3938±15 |
6447±5 |
+64* |
|
Met‡ |
T1241 |
18614±9 |
31191±6 |
+68** |
TP |
Met‡ |
Y1234+Y1235+S1236 |
10100±11 |
16120±3 |
+60* |
TP |
MOK |
Y167 |
654±20 |
1113±17 |
+70* |
FP |
MRLC2 |
S19 |
2144±12 |
4226±12 |
+97* |
|
MSK2 (RPS6KA4) |
T687 |
692±23 |
1247±5 |
+80* |
FP |
MST3 |
T184 |
3637±12 |
7318±15 |
+101* |
FP |
mTOR (FRAP) |
S2448 |
20151±20 |
7150±29 |
-65* |
|
Nek6‡ |
S206 |
7480±13 |
13286±7 |
+78* |
FPc |
NMDAR1 |
S896 |
433±27 |
1351±13 |
+212*** |
|
OSR1 |
T185 |
623±18 |
1273±6 |
+104*** |
FP |
p38a MAPK (MAPK14) |
T180+Y182 |
1162±3 |
3402±18 |
+193* |
|
p38d MAPK (MAPK13) |
T180+Y182 |
2162±16 |
5860±13 |
+171* |
|
p53 |
S33 |
1211±37 |
1968±20 |
+63* |
|
p53 |
S37 |
2770±5 |
8135±12 |
+194* |
|
p70 S6K (RPS6KB1) |
T252 |
2201±14 |
6219±21 |
+183* |
|
p70 S6K (RPS6KB1) |
T444+S447 |
196±18 |
331±9 |
+69* |
TP |
PAK1 |
S144 |
725±22 |
2027±25 |
+180* |
TP |
PAK1/2/3 |
S144/S141/S154 |
667±33 |
1636±16 |
+145*** |
|
PAK2‡ |
Y130 |
483±26 |
1074±19 |
+122* |
FPc |
PAK4 |
S474 |
2977±21 |
7118±3 |
+139* |
FP |
Full target protein name |
Phospho site (human) |
Serum starved average ± %S.Dev |
EGF treated average ± %S.Dev |
Percent change from control |
Immuno-blotting validation |
PCTAIRE1 |
Y176 |
1775±25 |
2931±8 |
+65* |
FPc |
PCTAIRE2‡ |
S180 |
19343±11 |
33677±3 |
+74*** |
FPc |
PDGFRA |
Y754 |
2291±9 |
4417±16 |
+93* |
|
PDGFRA‡ |
Y768 |
6938±10 |
10623±13 |
+53* |
FPc |
PIK3R1 |
Y467 |
403±14 |
949±19 |
+136* |
FP |
PIK3R1‡ |
Y580 |
1987±6 |
4322±3 |
+117**** |
FPc |
PKCd (PRKCD) |
T507 |
9069±13 |
3992±5 |
-56* |
|
PKCm (PRKCM)‡ |
S738+S742 |
1098±11 |
2349±5 |
+114* |
FPc |
Rb |
T356 |
15804±7 |
7922±4 |
-50*** |
|
RSK1 (RPS6KA1) |
T359 |
32830±9 |
12257±21 |
-63* |
|
STAT2 |
Y690 |
6698±41 |
3407±53 |
-49* |
|
TAK1 (MAP3K7) |
S439 |
19422±19 |
8042±38 |
-59** |
|
A431 cells were serum-starved for 18 hours and subsequently incubated without and with 100 ng/ml EGF for 5 minutes prior to harvesting in cysteine chemical cleavage buffer. Lysate proteins that were biotinylated as described in Method 4 and captured on the KAM-900P antibody microarray were detected with dye-labeled anti-biotin antibody. Averages are calculated from three separate microarray analyses with duplicate measurements performed for each analysis and the % standard deviations are shown. Another set of A431 lysates were prepared by harvesting the cells directly into SDS-PAGE sample buffer and these were subjected to Western blotting. "True positive" (TP) and "true negative" (TN) correspond to correlation between the positive and negative effects, respectively, of EGF treatment between the antibody microarray and Western blotting results for the target protein. "False positive" (FP) results correspond to an apparent change with EGF treatment that could not be confirmed in the target protein by Western blotting. FPc = false positive, but a similar EGF-induced change in one or more cross-reactive proteins on the Western blot that correlates with the antibody microarray results. "False negative" (FN) corresponds to an EGF-associated change on the Western blot that was not evident with the antibody microarray. ‡ Reacts with EGF receptor (EGFR) in EGF-treated A431 cells on Western blots or a protein that migrates on SDS-PAGE gels like the EGFR. Significance * p≤0.05, ** p≤0.01, *** p≤0.005, **** p≤0.001 based on paired, two-tailed Student T-test. Supplemental Table S4 provides further information, including the sources of these antibodies and the UniProt identification codes for the target proteins.
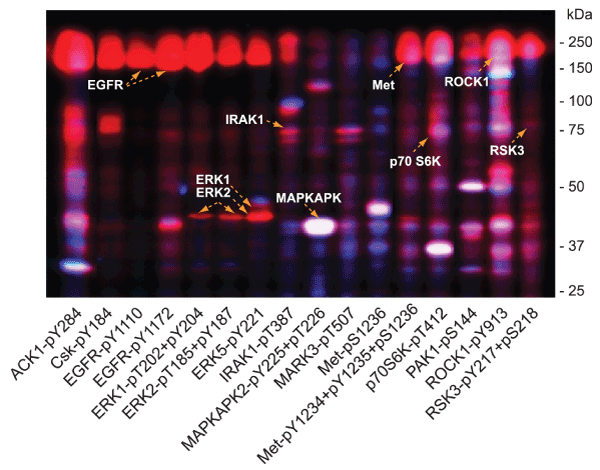
Figure 4. Validation of EGF induced protein phosphorylation antibody microarray leads from A431 cells subjected to multi-immunoblot analyses. Lysates from A431 cells that were serum-starved for 18 hours and then treated without and with 100 ng/ml EGF for 5 minutes were prepared by directly homogenizing the cells into SDS-PAGE sample buffer. These lysates were subjected to Kinetworks™ multi-immunoblotting with 16 different phosphosite-specific antibodies analysed on the same immunoblots, and the scanned chemiluminescent images of these developed blots were separately colorized (blue for lysates from untreated A431 cells, and red for lysates from EGF-treated cells) with Adobe Photoshop and overlaid. EGF induced increases in protein phosphorylation appear red, decreases appear blue and unchanged signals show up as white bands. Target proteins for the antibodies are indicated based on their immunoreactivity and expected sizes on the immunoblots.
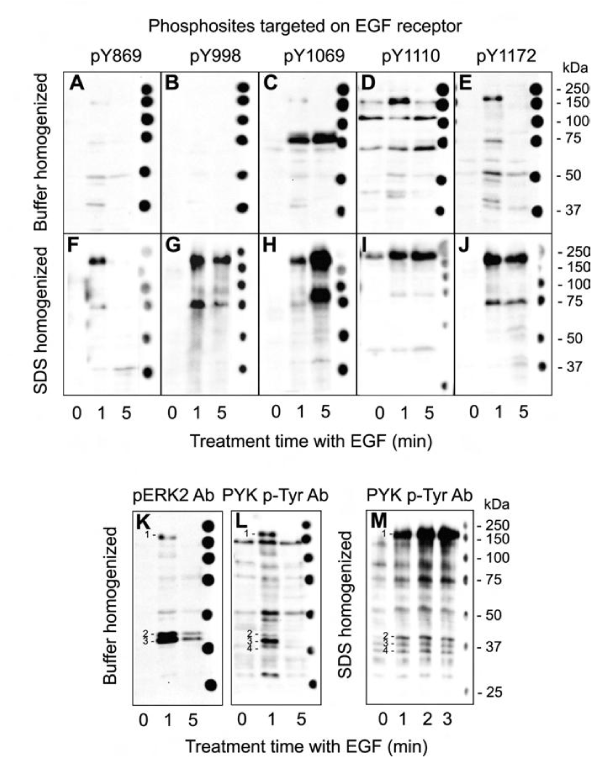
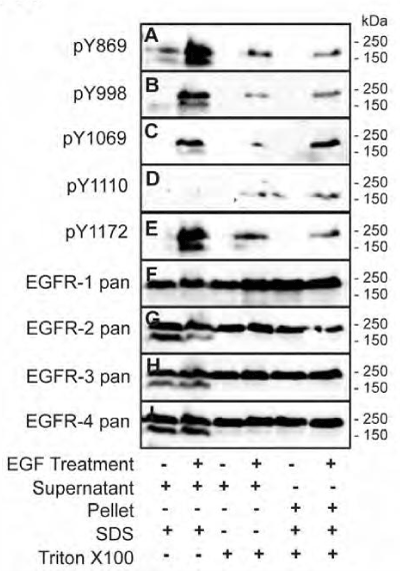
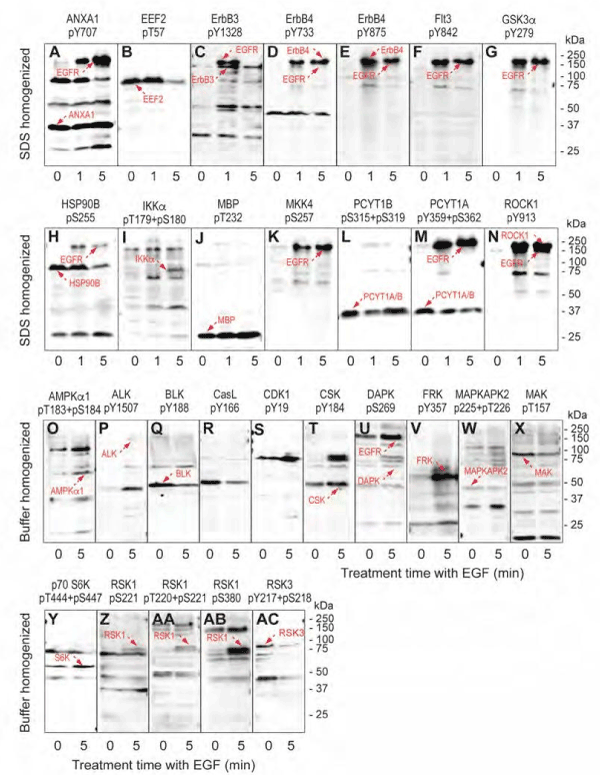
Table 3 summarizes the results from these immunoblot tests with 174 different phosphosite-specific antibodies. Of the tested antibodies, 91 indicated changes in target protein phosphorylation, but only 27 (30%) of these could be confirmed by Western blotting. For 30 (33%) of the tested antibodies in this “positive” set, Western blotting did not reveal any immunoreactive proteins so these “hits” could still be correct. For the remaining 34 antibodies (37%) in this “positive” set, while the changes in the target proteins could not be confirmed by Western blotting, it appeared these false positives arose from cross-reactivity with off-target proteins, and in particular with the EGF receptor. We also examined 83 phosphosite-specific antibodies that failed to show any significant changes with EGF treatment of the A431 cells based on the KAM-900P results. Of these, 74 were found to have no changes (23%) or no target detection (77%) by Western blotting as well. Of the other 9 antibodies from this “negative” set, 8 of these successfully detected their targets, which were observed to be altered in phosphorylation with EGF treatment based on the Western blotting. Overall, nearly 60% of the results from the antibody microarray appeared to reflect true positives and true negatives, and the false positives in all cases with detected immune reactivity were due to off-target proteins that were also affected by EGF treatment of the A431 cells.
Table 3: Correlation with EGF-induced changes in protein phosphorylation in A431 cells as detected with the KAM-900P antibody microarray and Western blotting.
Validation result |
Number |
% |
Number target detections by immunoblotting |
Increased EGFR detection by immunoblotting |
Increased detection of non-EGFR off-targets by immunoblotting |
True positive |
27 |
15.5 |
27 |
9 |
6 |
True negative |
74 |
42.5 |
17 |
12 |
12 |
False positive (FPc) |
64 (34) |
36.8 (17.2) |
6 |
25 |
9 |
False negative |
9 |
5.2 |
8 |
2 |
4 |
A431 cells were serum-starved for 18 hours and subsequently incubated without and with 100 ng/ml EGF for 5 minutes prior to harvesting in cysteine chemical cleavage buffer. Lysate proteins that were biotinylated and captured on the KAM-900P antibody microarray were detected with dye-labelled anti-biotin antibody in accordance to Method 4. Another set of A431 lysates were prepared by harvesting the cells directly into SDS-PAGE sample buffer and these were subjected to Western blotting with 174 different phosphosite-antibodies that were also printed on the antibody microarray. Definitions of the validation results are described in the legend to Table 2.
From the Western blotting analyses, it was evident that EGF-induced increased phosphorylation of the EGF-receptor as a cross-reactive protein was a common observation with many different antibodies (Supplemental Fig. S7). With 118 non-EGF receptor-based phosphotyrosine site-specific antibodies, 30 of these gave strong cross-reaction with the EGF receptor in lysates from EGF-treated A431 cells, and another 6 yielded weak, but detectable signals (Supplemental Table S5). Furthermore, 11 and 9, respectively, of the phosphoserine- and phosphothreonine-site-specific antibodies also showed immunoreactivity with the EGF receptor in these immunoblots. It should be noted that all of these phosphosite-specific antibodies had undergone negative purification with phosphotyrosine-agarose twice in order to reduce non-specific phosphotyrosine-binding. This cross-reactivity with phosphosite-specific antibodies may reflect the very high level of over-expression of the EGF receptor in A431 cells and the extensive phosphorylation of this receptor in response to EGF [5,6]. Databases such as PhosphoNET (www.phosphonet.ca) and PhosphoSitePlus (www.phosphosite.org) [3] document at least 32 serine-, 23 tyrosine-, and 17 threonine-phosphorylation sites that have been identified in the human EGF receptor by mass spectrometry studies, and phosphorylation is often also induced at serine and threonine sites in addition to tyrosine sites with engagement of the EGF receptor with its ligands.
2021 Copyright OAT. All rights reserv
In addition to false positives that appear to have arisen from cross-reactivities with the phosphosite-specific antibodies, there was also an issue related to false negatives as well. This was evident with the lack of detection of changes in the phosphorylation of the MAP kinases ERK1 and ERK2 with the KAM-900P antibody microarray (Supplemental Table S3), despite clear increases in the phosphorylation of these particular kinases by Western blotting (Supplemental Figure S7K). It appears that some phosphoepitopes may be blocked by local binding of the oxygen atoms on the phosphate with neighbouring nitrogen atoms in arginine and lysine residues that flank the phosphosites. Based on continuing studies in our laboratory, it seems that such internal charged interactions may be difficult to disrupt without also causing loss of the binding of the capture antibodies on microarrays with these phosphosites on some target proteins. This is a significant issue that can affect the reliability of not only antibody microarrays, but other immunological techniques such as immunoprecipitation, ELISA and immunohistochemistry that rely of detection of certain phosphoepitopes with antibodies. We have also found that enzymatic cleavage of lysate proteins with trypsin, which normally hydrolyzes proteins after basic amino acid residues, also failed to reveal EGF-induced ERK1 and ERK2 phosphorylation. In fact, at least 4-fold few EGF-induced changes were evident with the KAM-900P antibody microarrays using tryptic fragments as compared with the cysteine chemical cleavage Method 4 (data not shown).
Effect of cysteine chemical cleavage on phosphotyrosine binding domains
One of the most surprising outcomes of this study was the large number of EGF-induced changes in protein levels as revealed with pan-specific antibodies (Table 1). Sixty pan-specific antibodies showed EGF-induced increases or decreases of 35% or more in apparent protein expression with only 5 minutes of exposure to the A431 cells. Amongst the most consistent EGF changes observed with two independent pan-specific antibodies that target different epitopes on the same protein were: decreases in EGF receptor; and increases in HSP90, ERK1, JAK2, and p38-beta MAP kinase (Supplemental Table S3). However, conflicting changes with different pan-specific antibodies were observed for other target proteins such as MST1, PDGFRB, and RafB.
One of the possible explanations for apparent changes in protein expression was the masking of epitopes on CCC-generated protein fragments by adapter/scaffolding protein domains that might not be as susceptible to CCC. This could include phosphotyrosine-sites that are targeted by SH2 and PTB family phosphotyrosine-binding domains [13-15]. It is also feasible that capture of tyrosine phosphorylated CCC-generated peptides bound to SH2 and PTB domains to pan-specific antibodies on the microarray might enhance the detect of these peptides if these domains were also biotinylated.
To investigate this possibility, we identified the number and location of cysteine residues in 116 human SH2 domains (Supplemental Tables S6 and S7) and 56 human PTB domains (Supplemental Tables S6 and S8). Approximately 84% of the PTB domains featured 3 or more cysteine residues, which might be expected to be sensitive to CCC, resulting in loss of functionally active structures. By contrast, two-thirds of the SH2 domains had two or less cysteine residues with 18 of these having none at all. Therefore, it is possible that certain SH2 domains might be able to bind to tyrosine phosphorylated CCC-generated peptides and prevent binding to the capture antibodies on the microarray, and this could be a confounding factor in the interpretation of results from similar studies conducted with other ligand-activated receptor-tyrosine kinases to explore their signaling networks in cells.
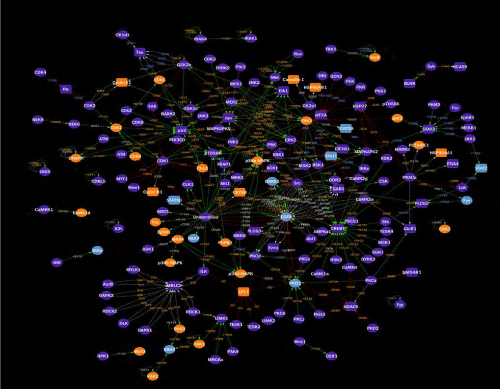
Mapping EGF-induced changes in protein expression and phosphorylation: The capability to track extensive changes in protein expression and phosphorylation in cell and tissue specimens with antibody microarrays with higher sensitivity and accuracy presents exciting opportunities to better define the architecture of their cell signalling networks and how they are specifically altered in response to diverse conditions. However, a major challenge is how to better connect the most significant alterations in these interaction networks to uncover their interrelationships in a way that is more amenable to visual inspection.
Towards this end, we have created a database of over 10,000 kinase-substrate relationships (KSR’s), for which it has been experimentally documented that a specific protein kinase phosphorylates a specific phosphosite in a substrate protein. For most of these KSR’s, the functional consequence of the phosphorylation is known or highly predictable. These KSR’s are available for viewing in the KinaseNET (www.kinasenet.ca) website. We extracted those KSR entries from the KinaseNET database where the effects of EGF on proteins and their phosphosites were observed on the microarray to be altered by 45% or more, and filtered out those changes that were confirmed as false positives and due to cross-reactive proteins by the Western blotting validation experiments in the present study. We then used the Cytoscape 3.4 program [16,17] to rapidly create two types of phosphorylation network maps of the effects of 5 minutes of EGF exposure in A431 cells. One of these KiNetscape maps is more qualitative (Supplemental Fig. S8), whereas the other KiNetscape map better highlights the most significant changes (Supplemental Fig. S9). In future studies, we plan to perform careful time course studies with other experimental model systems to explore changes in phosphorylation networks with even higher density antibody microarrays and combine the KiNetscape maps to create animations that track the dynamic nature of their cell signalling systems.
Supplemental Information and Source Data files are available with the online version of the paper. Full listing of the Kinase-Substrate Relationships used for the KiNetscape maps are available at the KinaseNET website (www.kinasenet.ca).
We thank Jordan Chiu, Yezen Dean, Kristy Dever, Claire Doyon, Kevin Gonzalez, Tony Han, Ryan Hounjet, Zhong Hua, Alexander Mann, Sara Marello, Jeremy Nan, Desiree Pagulayan, Colm Quirke, Enoli de Silva, Catherine Sutter, Paula Tao, Alisa Too, and Jeffrey White for their help in the production of the immunogenic peptides and the purifications and characterization of the antibodies that were utilized on the Kinex™ KAM-900P antibody microarray.
Conflict of Interest: SP and his family are the majority shareholders of Kinexus.
Author Contributions: SP and LY conceived the study and wrote the initial drafts of the manuscript. SP prepared the figures and final draft of the manuscript. LY performed most the experimental work with some preliminary studies carried out by NA. DFHW synthesized the peptides used to make the antibodies on the Kinex™ KAM-900P microarray. CS and SP performed the bioinformatics analyses.
Footnotes: This work was supported in whole by Kinexus Bioinformatics Corporation.
The abbreviations used are: CCC, cysteine chemical cleavage; CCCB, cysteine chemical cleavage buffer; DBL, direct biotin-labeling; DDL, direct-dye labeling; SHB, standard homogenizing buffer.
View supplementary data
- Jünger MA, Aebersold, R (2014) Mass spectrometry-driven phosphoproteomics, patterning the systems biology mosaic. Rev Dev Biol 3: 83-112.
- Humphrey SJ, James DE, Mann M (2015) Protein Phosphorylation: A major switch mechanism for metabolic regulation. Trends Endocrinol Metab 26: 676-687.
- Hornbeck PV, Zhang B, Murray B, Kornhauser JM, Lathan V, Skrzypek E (2015) PhosphoSitePlus, 2014, mutations, PTMs and recalibrations. Nucl Acids Res 43: D512-520.[CrossRef]
- Novak-Hofer I, Thomas G (1984) An activated S6 kinase in extracts from serum- and epidermal growth factor-stimulated Swiss 3T3 cells. J Biol Chem 259: 5995-6000. [CrossRef]
- Linsley PS, Fox, CF (1980) Direct linkage of EGF to its receptor: characterization and biological relevance. J Supramol Struct 14: 441-459.
- Hunter T, Cooper, JA (1981) Epidermal growth factor induces rapid tyrosine phosphorylation of proteins in A431 human tumor cells. Cell 24: 741-752.
- Buss JE, Kudlow JE, Lazar CS, Gil, GN (1982) Altered epidermal growth factor (EGF)-stimulated protein kinase activity in variant A431 cells with altered growth responses to EGF. Proc Natl Acad Sci USA 79: 2574-2578.
- Ciaccio MF, Wagner JP, Chuu CP, Lauffenburger DA Jones, RB (2010) Systems analysis of EGF receptor signaling dynamics with microwestern arrays. Nat Methods 7: 148-155. [CrossRef]
- Foerster S, Kacprowski T, Dhople VM, Hammer E, Herzog S, Saafan H, Bien-Möller S, Albrecht M, Völker U, Ritter, CA (2013) Characterization of the EGFR interactome reveals associated protein complex networks and intracellular receptor dynamics. Proteomics 13: 3131-3144.
- Alanazi I, Ebrahimie E, Hoffmann P, Adelson, DL (2013) Combined gene expression and proteomic analysis of EGF induced apoptosis in A431 cells suggests multiple pathways trigger apoptosis. Apoptosis 18: 1291-1305.
- Wu J, Gage DA, Watson JT (1996) A strategy to locate cysteine residues in proteins by specific chemical cleavage followed by matrix-assisted laser desorption/ionization time-of-flight mass spectrometry. Anal Biochem 235: 161-174.
- Zhang H, Shi X, Pelech S (2016) Monitoring protein kinase expression and phosphorylation in cell lysates with antibody microarrays. Protein kinase screening and Profiling. Edited by Hicham Zegzouti and Said Goueli. Humana Press USA. Methods in Molecular Biology 1360: 107-122.
- Uhlik MT, Temple B, Bencharit S, Kimple AJ, Siderovski DP, Johnson GL (2005) Structural and evolutionary division of phosphotyrosine binding (PTB) domains. J Mol Biol 345: 1-20. [CrossRef]
- Liu BA, Nash PD (2012) Evolution of SH2 domains and phosphotyrosine signalling networks. Philos Trans R Soc Lond B Biol Sci 367: 2556-2573. [CrossRef]
- Wagner MJ, Stacey MM, Liu BA, Pawson T (2013) Molecular mechanisms of SH2- and PTB-domain-containing proteins in receptor tyrosine kinase signaling. Cold Spring Harb Perspect Biol 5: a008987. [CrossRef]
- Su G, Morris, JH, Demchak B, Bader, GD (2014) Biological network exploration with Cytoscape 3. Curr Protoc Bioinformatics 47: 8.13.1-24. [CrossRef]
- Pelech S, Sutter C, Zhang H (2003) Kinetworks protein kinase multiblot analysis. Methods Mol Biol 218: 99-111. [CrossRef]