Pancreas is a small organ approximately six inches long, located at upper abdomen and adjacent to the small intestine. It is located at the back and deep into the human body. Therefore, it difficult to obtain a pancreas image clearly using ultrasound machine. In order to solve this problem, MATLAB software was used to filter and segment the ultrasound pancreas images using various methods. The images were selected based on high quality images produced from five subjects using AplioMX device from Toshiba ultrasound machine with a 3.5MHz convex transducer.
In this study, there were various technique of filter used including Kaun filter, Wiener filter, Frost filter and Anisotropic Diffusion filter in order to reduce spackle noise of ultrasound pancreas images. Then, the filtered images were measured using Mean Square Error (MSE), Power Signal to Noise Ratio (PSNR), Average Difference (AD), Normalized Cross-Correlation (NCC), Maximum Difference (MD), Structural Content (SC), and Normalized Absolute Error (NAE) formula to evaluate the best quality images before undergo the segmentation process. As the result, Wiener filter was selected. In the segmentation process, the active countor method and level set method were evaluated. Then, the area of binary image and error percentage were calculated. As a conclusion, it shows that the filtering process using Wiener filter and segmentation method using level sets method has been successfully done to produce the best geometry of pancreas image.
segmentation, filtering, Kaun, Frost, Anistropic diffusion, Weiner, convex tranducer
From the previous studies, ultrasonographer found that the pancreas was quite controversial to measure the geometrical especially for the diameter and length. It is because the pancreas is very difficult to see clearly through ultrasound modality. Results from the ultrasound images consisted a few limitations such as speckle noise, attenuation, low contrast and local changes of intensity [1]. The speckle noise has an adverse effect on image quality. The effects of speckle noise can reduce the spatial resolution of ultrasound image and making less details of the image [2]. Therefore, image enhancement and segmentation is an essential technique that can be used in ultrasound image processing. This paper proposes an approach to obtain a pancreas image clearly and accurate in geometry from ultrasound machine.
Filtering is a part of image enhancement method. There are many types of image filtering techniques. In this study, the Kaun filter, Wiener filter, Frost filter and Anisotropic Diffusion filter were used to eliminate the speckle noise. To be noted, the Kaun is a new version of filter that is very useful to reduce the speckle noise [2]. It generates their output images by computing a linear combination of the centre pixel intensity in the filter window with the average intensity of the window [3]. Moreover, it was used mainly to filter the speckled at medical imaging image and designed to eliminate noise and speckle while retain the edge and the characteristics of the images [4]. Besides, the Kaun filter also smoothes the image without removing edges or sharp features in the images. The Wiener filter was also used in medical image processing especially in ultrasound image to reducing speckle noise. In addition, this filter also can use to eliminate the ‘blurring’ in images because of linear motion [5]. The advantages of the Wiener filter are to enhance the image qualities and simulated power spectrum of speckle [6]. To be noted, the Frost filter is used for despeckling method. The despeckling method is the process to eliminating speckle noise from medical ultrasound images [2]. Moreover, the Frost also preserving edges in images after filtering. The anisotropic diffusion filter is a technique that aims to reduce image noise without removing important parts of the image information such as edges and other important details for image interpretation. As demonstrated by previous study, it can also be used as despeckling method [2].
In the biomedical imaging techniques, the segmentation method was used to facilitate and replace the image into something that is seen meaningful and clear. Therefore, analysis of image would be easy. The image segmentation basically to detect objects and boundaries such as lines and curves in the image. Besides, this technique can provide clear images and there is no need to set a common point and it suitable for other parts of human body [7-9]. In this recent study, the active countor and level set method were also implemented to segment the ultrasound pancreas image. The former method is very famous and used extensively in recent for segmentation of ultrasound images [10]. In addition, it shows excellent performance in image segmentation [11]. To be noticed, the level set method is one of the segmentation processes produce better medical images for diagnosis purposes [12]. This is because this method can be segmenting the boundaries in which the way of defining gradient and its initial curves of level set is very easy to define [13].
In this study, an approach to obtain a pancreas image clearly and accurate in geometry from ultrasound 2D images using MATLAB is purposed. This is due to the fact that the pancreas location in the abdomen makes it suitable to perform diagnosis using ultrasound modality. However, pancreas itself has complex anatomy and its surrounding tissues make interpretation of the images to become such a demanding task [14-15]. Using several MATLAB codes, the image of pancreas can be seen clearly.
In this part, the authors describe the step of image acquisition, and explain on image enhancement and segmentation methods. The images of pancreas were acquired using AplioMX from Toshiba ultrasound machine with a 3.5MHz convex transducer by an expert radiographer. The images were saved into processing unit tools through our developed hardware in DICOM format.
Image processing
Figure 1 shows the flow chart of the process of enhancement and segmentation different section of pancreas image. By using MATLAB codes, original images acquired from ultrasound machine that has five subjects was selected. The Kaun filter was used to remove speckle noise of image. After the image was filtered, we set a Region of Interest (ROI). In this method, specific MATLAB codes were used to specify a boundary. After determined the desired ROI, concatenated images were created.
Figure 1. Flowchart of image processing
Image Enhancement
Image enhancement was used to enhance the perception of information in images for human viewers and provide a better predictive view for the current image processing techniques. The enhancement process can be categorized and can be divided into spatial domain filtering, morphological filtering, histogram equalization, frequency domain Gaussian low pass filtering as well as wavelet filtering [14-15]. In this study, we used the Kaun, Frost, Annistropic Diffusion and Wiener filter for enhancement and smoothing process. The best method was chosen after several evaluations.
Kaun Filter
The multiplicative noise model is converted into a signal dependent additive noise model. The filter is based on the prediction of the mean and variance pixel of the interest as similar to the local mean and variance of all pixels in the moving kernel. The weighting function of Kaun filter is given as [16]:
Kaun filter is a new version of filters and it has been discovered to remove the speckle noise. The output images and average intensity of the window was created using Kaun Filter from calculating a linear combination of the centre pixel intensity in the filter window. Besides, it also preserving and smoothing the features as well as the edges.
Frost Filter
Frost filter replaces the pixel of interest with the total weighted value of the moving (nxn) kernel. The weighting factor is decrease with distance through the pixel of interest. If the kernel increases, the weighting factors also will increase for the central pixels as variance. This filter assumes stationary noise and multiplication noise statistics. Equation of Frost filter can be expressed as below [18]:
where k is normalization constant and n is moving kernel size.
Anisotropic Diffusion Filter
The function of anisotropic diffusion filter is to eliminate the speckle noise. The main advantage of the filter is not changed and destroyed the image information that is useful and important for image edges. This filter is according to the nonlinear partial differential equation (PDE). The equation can be expressed as below [2]:
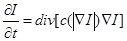
where c is difussion coeficient image and I is initial image.
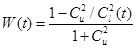
Wiener filter
In terms of mean square error, the Wiener filter is optimum. It reduces the total mean square error of inverse filtering and noises moothing process. It also is a linear estimation of the original image. The Wiener filter in Fourier domain can be expressed as below [19]:
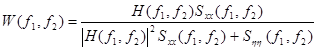
where is power spectra of the original image,
  is additive noise and
  isblurring filter.
Image Segmentation
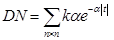
For image segmentation process, level sets methods have been chosen. A new variational formulation of level set without re-initialization method has been proposed by Li et al. [16-17]. Generally, they have proposed the following numerical integral:
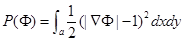
Then, based on defined functional  , following variational formulation has develop:
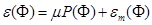
where  is parameter control and
  is energy to drive the motion of zero level curve.
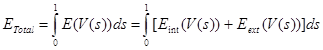
Basically, there are few advantages by using this new proposed method. This method gives a fast curve evolution and it can be simply implemented via simple finite difference. The level set function can also be initialized with general functions that are more effective and efficient to construct thus make it easier to practically used as compared to commonly used signed distance function [17]. The active contour method depends on energy minimization which two-dimensional curve of the image space is deformed. The primary contour for this method is to define the edge which near to the object. In order to detect the edge, the energy function is implemented. It consists of variety arithmetic techniques, the edge detection and segmentation process for specified contour. The energy function for this method can be expressed as below:
The active contour method has their own weakness. First is very sensitive to define initial curve position and secondly the formation of minimum energy points due to the appearances of noise in the image. It is the contour trap for a local currency and stray from the path of the original [17].
Image Quality Measurement
Image Quality Measure (IQM) is represented as a data that used to evaluate the imaging systems or processing techniques. The most frequently and famous used measures are deviations between the coded and original images. The Mean Square Error (MSE) or Signal To Noise Ratio (SNR) is usually used for image quality measurement [20]. In this study, we used MSE, Peak SNR, Normalized Absolute Error, Structural Content, Average Difference, Maximum Difference, and Normalized Cross-Correlation formula to measure the quality of images.
Mean Square Error
Mean Square Error (MSE) is a measure on how accurately each individual input sample can be recovered using the channel output. The MSE equation can be expressed as following formula [21]:
where m×n is the resolution of frames, is an original image and
  is noisy images.
Peak Signal to Noise Ratio
Peak signal to noise ratio (PSNR) is a ratio represented between the maximum possible value (power) of a signal and the power of distorting noise. It would affect on the quality of its representation. It can be shown as follows [22]:
where n is denoted the nth frames.
Normalized Cross-Correlation
Normalized Cross-Correlation (NCC) is useful to a measure of covariance between two random variables of vectors in statistics. In this study, the variables are and . The equation shows as below [23]:
where m×n is resolution of frames, is an original image and is noisy images.
Average Difference
Average Difference (AD) is useful to measure the statistical dispersion. It means that the measurement is equal to the average absolute difference of two independent values that coming from a probability distribution. Average difference equation is denoted as follows [24]:
where m×n is the resolution of frames, is an original image and is noisy images.
Structural Content
This measure is also called as structural content, given by equation as follows:
The decompressed image is better quality if the value is near to 1 and large value of SC means that the image is of poor quality [25].
Maximum Difference
Maximum Difference (MD) has a good correlation with MOS. Hence, this is preferred as a very simple measure to measure the compressed picture quality by using different compression techniques [26]. This measure can be applied using the following equation:
To be noted, poor quality images give high value in MD [25].
Normalized Absolute Error
Normalised Absolute Error (NAE) computed by equation below:
This is useful to measure of how far is the decompressed image from the original image with the value of zero being the perfect fit [27]. Poor quality of the images indicated high value in NAE [25].
This section shows the results and discussion for every steps and procedures. Five parts of the results was developed during the study as follows; reduce speckle noise by applying several filters while the image segmentation was using level sets and active contour methods. Figure 2 shows the original image of pancreas using ultrasound modality. In order to select the best image, we used several filters method and calculation process was made that includes peak signal to noise ratio, mean square error, structural content, normalized absolute error, normalized cross-correlation, maximum difference and average difference to see the quality of images after filtering process.
Figure 2. Original pancreas image from ultrasound modality
Images Filtering
In this study, we used the Kaun, Anisotropic Diffusion, Weiner and Frost filter to remove or reduce the noise from original ultrasound images. Figure 3 illustrated the images of pancreas after the Kaun, Anisotropic Diffusion, Weiner and Frost filter were applied, respectively.
Observation from Figure 3a until Figure 3d shows that the noise was eliminated roughly. Without filtering process, it will be difficult to make image segmentation process. Unfortunately, we cannot clearly have differentiated ultrasound pancreas images before and after filtering process by the observation from human eyes but we can see it through the data comparison between various calculation as mentioned earlier. Table 1 shows the result of data comparison between four filters method in term of image quality measurements. All the data was calculated by using MATLAB software.
Figure 3. Images after the (a) Kaun, (b) Anisotropic Diffusion, (c) Weiner and (d) Frost filtration
As shown in the Table 1, the Weiner filter is the best filter compared to Kaun, Anisotropic Diffusion and Frost filter in term of image quality. This is due to high value of Normalized Cross-Correlation and Peak Signal Noise Ratio. Meanwhile, for Mean Square Error, Normalized Absolute Error, Structural Content, Average Difference and Maximum Difference is lower than the Kaun, Anisotropic Diffusion and Frost filter. MSE in Weiner filter give the lowest value which was 21.4168 compared to the others. After the filtering process and image quality measurements were done for the different type of filters, then we later proceed the image segmentation by applying Weiner filter.
PSNR: Peak Signal to Noise Ratio, MSE:Mean SquareError, NAE: Normalized Absolute Error, MD: Maximum Difference, SC: Structural Content, AD: Average Difference, NCC: Normalized Cross-Correlation
Segmentation Images
In this study, we differentiated the level sets and active contour method to segment the images. We segmented 3 times for each the level sets and active contour method. To measure the quality of these method, we calculated the area of pancreas for original image (change to binary), level set and active contour images. The calculation of area has been done using MATLAB codes. Then, we made a comparison between them by applying percentage error formula.
Level Sets Method
Figure 4 until Figure 6 show the result for each step that we performed using level sets method. Figure 7 shows the initial contour that we manually set for segmenting the pancreas. In this method, different points were chosen to be set manually from the initial contour. Three images were selected based on the several points of initial contour; 28, 31 and 36 points. Points of initial contour will give different results as well.
Figure 4. Initial Contour; a) 36, b) 31, c) 28 points
Figure 5. After 20 iterations; a) 36, b) 31, c) 28 points
Figure 6. : Binary images; a) 36, b) 31, c) 28 points
Figure 7. Initial contour; a) Pixel length 1, b)Pixel length 2, c)Pixel length 3
In the Figure 8, the result shows that the segmentation process of level sets after 20 iterations while in Figure 9 is the result of the pancreas image after being chance to binary image in order to shows the whole of the pancreas region.
Active Contour Method
In this method, different pixel lengths were chosen for the initial contour. Three images were selected due to several pixels’ length of initial contour; 20 height and 200 width (240:260 300:500), 10 height and 190 width (240:250 300:490) and 15 height and 210 width (245:260 290:500). Initial contour was set at the pancreas region in original ultrasound image. Pixel length of initial contour will give different results as well. Based on the results, Figure 7 until Figure 9 shows the result for each step that we performed using active contour method. Figure 7 shows the initial contour that we manually set for segmenting the pancreas by setting the pixel length. In the Figure 8, we can see the result of level sets segmentation after 50 iterations while in Figure 9 is the result of the pancreas image after being chance to binary image.
Figure 8. After 50 iterations; a) Pixel length 1, b) Pixel length 2, c) Pixel length 3
Figure 9. Binary images; a) Pixel length 1, b) Pixel length 2, c) Pixel length 3
From the result of this study, we successfully segmented the pancreas image using both the active contour and level sets method. It can be described that both method is suitable to be used in medical image processing.
Area of Binary Images
To check the quality after images segmentation, we performed a code to calculate the area of binary images using MATLAB. Before proceed to calculate area and error, we draw manually the pancreas using tools in AplioMX Toshiba ultrasound machine and converted into binary image using MATLAB. Figure 10 shows the binary images of pancreas from the original image.

Figure 10. Binary image of original ultrasound pancreas image
Based on the result from the ultrasound machine, the pancreas area from original ultrasound image was 9.4955×10³. For direct comparison, both segmentation methods are shown in Table 2. Table 2 also shows the percentage error measurement for the level sets and active contour method.
Based on Table 2, we can see that the image in (c) for level sets method gives the lowest error in percentage which is 29.57%. It shows that the smallest number of points during initial contour will give better results as well. While for active contour method, the image in (a) gives much better in this method where 71.69% of error occurred. This is due to the suitable length of pixels during initial contour. Moreover, this study shows that the level sets method is a good segmentation method compared to the active contour process. The image segmentation of pancreas using the level sets method would have better result.