Abstract
Cyclooxygenase-2 (COX-2) plays a crucial role in colorectal carcinogenesis. Accumulating studies investigating the association between COX-2 genetic variants (-765G>C, -1195G>A, and 8473T>C) and colorectal cancer (CRC) susceptibility generated conflicting results. To explore the potential correlation, we conducted a meta-analysis based on eligible case-control epidemiological studies. Databases of Medline, Embase and CNKI were screened for eligible papers focusing on the relationship between COX-2 polymorphisms and CRC risk. The pooled odds ratio (OR) and 95% confidence interval (95% CI) was calculated to estimate the significance of such an association. A total of twelve studies for -765G>C, eight studies for COX-2 -1195G>A, and seven studies for 8473T>C were enrolled in this meta-analysis. On the whole, -1195 A allele carriers presented increased incidence rate of CRC compared with G allele carriers (OR=1.227, 95% CI=1.060-1.419, POR=0.006). The result was consistent in subgroup analysis of sample size ≥500 (OR=1.232, 95% CI=1.064-1.426, POR=0.005). As for -765C allele, an associated higher CRC risk was observed only in Asian descents under the heterozygote and dominant model (OR=1.477, 95% CI=1.148-1.898, POR=0.002; OR=1.451, 95% CI=1.146- 1.747, POR=0.001, respectively). In contrast, no linkage was defined between 8473T>C polymorphism and CRC susceptibility under all four genetic models. Considering the interactive influence of gene background and environmental factors on CRC, the smokers with -765GG genotype had a 1.761-fold greater risk to develop CRC. In summary, -1195G>A polymorphism contributed to CRC susceptibility worldwide whereas -765G>C was a potential CRC risk factor only in Asian population. Smokers with -765GG genotype would be more susceptible to CRC development. Large-sample, well-matched studies with consideration of gene-gene and gene-environment interaction are awaited to validate the findings.
Key words
genetic variant, COX-2, colorectal cancer, meta-analysis
Introduction
Colorectal cancer (CRC) is a leading common cause of cancer mortality in both men and women worldwide [1]. In 2013, estimated 150,000 cases of CRC are newly diagnosed and more than one-third of these patients are expected to die of this disease, accounting for 9% of all cancer-related deaths [2]. Though the molecular mechanism underlying the colorectal carcinogenesis still remains unclear, the linkage between inflammation and CRC development has been well recognized [3].
As a pro-inflammatory enzyme, cyclooxygenase-2 (COX-2) enhanced tremendously in response to pro-inflammatory and mitogenic stimuli resulting in redundant synthesis of prostaglandins from arachidonic acid [4]. It was believed that COX-2 played a key role in carcinogenesis due to its influence on cell proliferation, cell apoptosis, angiogenesis and immune response [5,6]. Of interest, almost 85% of CRC individuals presented with high COX-2 expression, which was associated with advanced stage and poor survival among CRC patients [7,8]. Coincidently, it was widely reported that non-steroidal anti-inflammatory drugs (NSAIDs), known as the COX-2 inhibitor, were among the most promising agents for CRC prevention [9]. Susceptible populations treated with NSAIDs could reach an approximately 60% reduction in CRC occurrence [10]. All the above information supported the idea that COX-2 had a vital impact on CRC development and could be a molecular target for colorectal cancer prevention [11].
As widely accepted, the function of COX-2 enzyme was dependent on COX-2 expression and COX-2 activity. Functional genetic variations in COX-2 may alter the expression and activity of COX-2 enzyme, and therefore affect the individual’s susceptibility to CRC occurrence. To date, a lot of functional polymorphisms have been identified in the COX-2 gene mapped in 1q25.2-q25.3. Among these, -765G>C, -1195G>A and 8473T>C are the most extensively studied polymorphisms in CRC. The first study for -765G>C, -1195G>A and 8473T>C polymorphism evaluating their influence on the risk to develop CRC was published in 2001 [12], 2004 [13] and 2006 [14], respectively. Since then, a large amount of studies come forward [15,16-27]. However, the results of these studies were controversial. Taking COX-2 -1195G>A polymorphism for example, the result from Siezen’s work demonstrated that COX-2 -1195G>A was not correlated to the risk of CRC onset [15]. In contrast, another research done by Tan et al suggested a positive association between them [16]. To shed light on these inconclusive findings, we performed the current meta-analysis to quantitatively evaluate the potential impact of the above three polymorphisms on CRC susceptibility. Interactive influence between environmental factors and gene polymorphisms on CRC risk would be also estimated if there was enough data for OR and 95%CI calculation.
Methods
Search strategy for eligible studies
We screened Medline, Embase, and CNKI (China National Knowledge Infrastructure) databases for relevant researches investigating the association of COX-2 polymorphisms with CRC susceptibility. The key words were listed as follows: ‘cyclooxygenase-2’ or ‘COX-2’ or ‘prostaglandin synthase 2’ or ‘PTGS2’, ‘colorectal cancer’ or ‘colorectal adenocarcinoma’, ‘polymorphism’ or ‘variant’ or ‘genotype’ or ‘single nucleotide polymorphism’ or ‘SNP’ and ‘risk’ or ‘susceptibility’ (last search was updated on August 20, 2013). The corresponding references within the retrieved reviews or meta-analysis were manually screened for additional eligible studies. No language restriction was considered in this meta-analysis. The following inclusion criteria were applied to select eligible studies: (1) case-control study; (2) investigation of the possible influence of COX-2 polymorphisms on colorectal carcinogenesis; (3) focusing on the three common polymorphisms of COX-2, namely -765G>C, -1195G>A and 8473T>C; (4) the cases were histopathologically proved CRC; (5) sufficient data for calculating odds ratio (OR) and 95% confidence interval (95%CI). In addition, if the enrolled studies contained overlapping or same subjects, the latest study with the largest amount of samples would be chose.
Data extraction
Two authors (Pan Y and Gao S) reviewed and retrieved useful information from all eligible papers independently. The following parameters were extracted from each study: year of publication, first author, country, ethnicities (Asian, Caucasian, or mixed descent), source of control (hospital-based or population-based), total number of cases and controls, genotyping method, and adjusted potential confounding variables (Table 1). Discrepancy was addressed by discussion among all authors to reach a consensus.
Table S1. Characteristics of 16 eligible studies in this comprehensive meta-analysis
PCC, population-based case-control; HCC, hospital-based case-control; PCR-CTPP, polymerase chain reaction with confronting two-pair primers; PCR-RFLP, polymerase chain reaction - restriction fragment length polymorphism assay; NA, not available
First author (Year) |
Country |
Ethnicity |
Control origin |
Cases |
Controls |
Genotyping method |
Adjusted potential confounding variables |
Hamajima (2001) [12] |
Japan |
Asian |
HCC |
148 |
241 |
PCR-CTPP |
NA |
Cox (2004) [13] |
Spain |
Caucasian |
HCC |
290 |
272 |
TaqMan assay |
Adjusted for age, gender, smoking status-duration and BMI |
Koh (2004) [14] |
Singapore |
Asian |
PCC |
310 |
1177 |
TaqMan assay |
Adjusted for alcohol consumption; but not for age, gender, BMI, smoking status |
Siezen (2006) [15] |
Netherlands |
Caucasian |
PCC |
682 |
1142 |
PCR-RFLP |
Adjusted for age and gender |
Tan (2007) [16] |
China |
Asian |
HCC |
1000 |
1300 |
PCR-RFLP |
Adjusted for age and gender |
Xing (2008) [17] |
China |
Asian |
HCC |
137 |
199 |
PCR-RFLP |
Adjusted for age, gender, smoking status, alcohol duration and BMI |
Iglesias (2009) [18] |
Spain |
Caucasian |
HCC |
284 |
123 |
PCR-RFLP |
Adjusted for age and gender |
Thompson (2009) [19] |
USA |
Caucasian |
PCC |
421 |
480 |
TaqMan assay |
Adjusted for smoking status; but not for age, gender, BMI and alcohol status |
Hoff (2009) [20] |
Netherlands |
Caucasian |
HCC |
326 |
369 |
PCR-RFLP |
Adjusted for age and gender |
Andersen (2009) [21] |
Denmark |
Caucasian |
PCC |
359 |
765 |
TaqMan assay |
Adjusted for gender |
Pereira (2010) [22] |
Portugal |
Caucasian |
HCC |
117 |
256 |
PCR-RFLP or rt-PCR |
Adjusted for gender, BMI and smoking status; but not for age |
Wang (2012) [23] |
USA |
Caucasian |
HCC |
305 |
359 |
TaqMan assay |
Adjusted for age and gender |
Daraei (2012) [24] |
Iranian |
Asian |
PCC |
110 |
120 |
PCR-RFLP |
Adjusted for age and gender, BMI and smoking status |
Zhang (2012) [25] |
China |
Asian |
HCC |
343 |
340 |
PCR-RFLP |
Adjusted for age, gender, smoking status and alcohol status |
Ross (2013) [26] |
Australian, Spanish |
Caucasian |
HCC |
183 |
223 |
PIRA assay, TaqMan assay |
NA |
Li (2013) [27] |
China |
Asian |
HCC |
451 |
629 |
PCR-RFLP |
Adjusted for gender; but not for age and BMI |
Statistical analysis
The influence of COX-2 polymorphisms on individuals’ differential susceptibility to CRC development was estimated by crude OR and 95% CI under four genetic models including heterozygote model, variant homozygote model, dominant model and recessive model. In order to eliminate the potential effect of confounding factors, stratification analyses were performed by variables of ethnicity, sample size and source of controls.
Chi square-based Q-test and I2 test were applied to evaluate the heterogeneity among the included studies [28,29]. If p>0.05, meta-analysis was performed using the fixed-effects model [30], otherwise, the random effects model [31] was applied. In the circumstance of high between-study heterogeneity, sensitivity analysis was recommended to be conducted to confirm the consistence of the conclusions. In terms of publication bias, funnel plot, Begg’s rank correlation method [32] as well as Egger’s weighted regression method [33] were basically applied.
HWE of genotypes distribution in control group from each individual study was estimated using the Pearson’s goodness-of-fit chi-square test. STATA software (version 12.0, Stata Corporation, USA) was used to perform the meta-analysis. P<0.05 was designated as significant difference.
Results
Characteristics of eligible studies
In this meta-analysis, we quantitatively evaluated the influence of three common genetic variants in COX-2 on the CRC susceptibility using the meta-analytic method. In summary, twelve studies for -765G>C [12-14,16-24], eight studies for -1195G>A [15,16,19-22,25,27], and seven studies for 8473T>C [13,15,19,21,25,26] polymorphism including 5466 CRC cases and 7995 controls were finally enrolled in this study. The flow chart of study selection was displayed in Figure 1. Table S1 and S2 listed the detailed information of 16 eligible publications. These three polymorphisms were located either in the promoter or in the 3’-UTR of COX-2 gene (Figure 2). Among these studies, seven studies consisted of Asian population and nine of Caucasian ethnicity. As for sources of control, nine studies were hospital-based case-control studies, while the rest were population-based case-control studies. DNA was extracted from peripheral blood among all studies and the polymorphisms of COX-2 were genotyped using PCR- RFLP, PCR-CTPP or TaqMan assay.
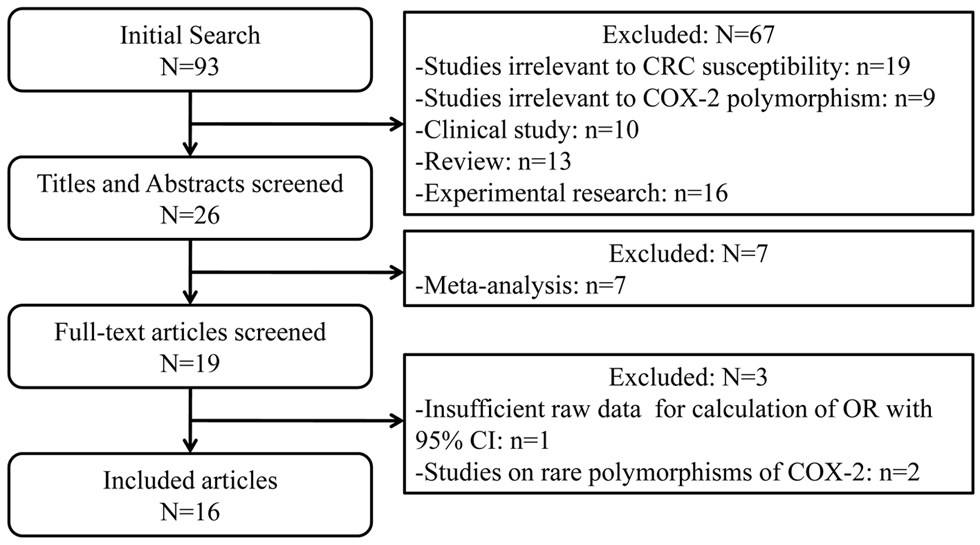
Figure 1. Flow chart for the current meta-analysis
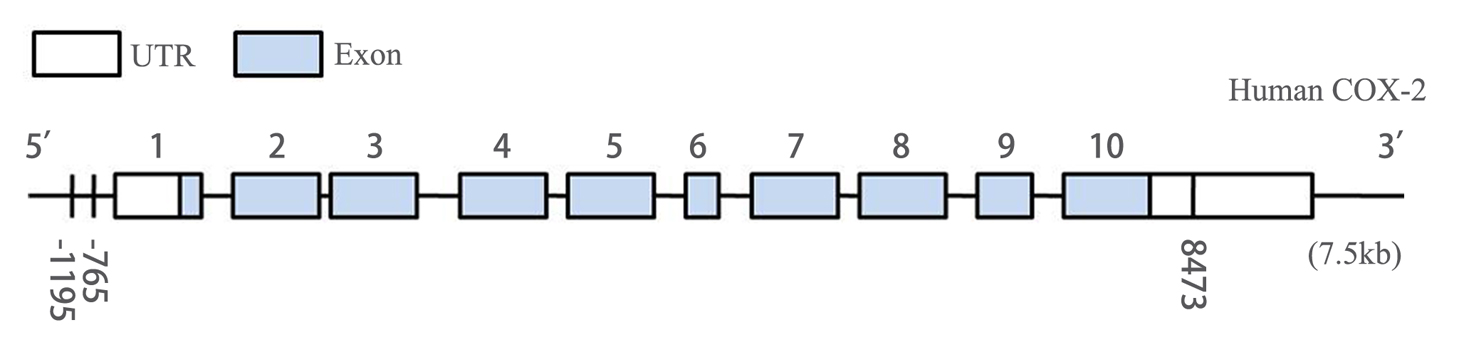
Figure 2. Genomic structure of human COX-2 gene consists of 10 exons and 9 introns. -1195G>A polymorphism and -765G>C polymorphism located in the promoter region, and 8473T>C polymorphism mapped in the region of 3’UTR of COX-2.
In the current meta-analysis, it was evident that different polymorphisms, -1195G>C, -765G>C and 8473T>C, differentially contributed to the development of CRC under variable genetic models. In addition, confounding factors such as ethnicity, source of control, sample size, environmental factors such as smoking, NSAIDs would affect the results of such an association. Therefore, combinational analysis and subgroup analysis were conducted in each COX-2 polymorphism.
Meta-analysis of the association between -1195G>A and CRC risk
Eight studies of -1195G>A [15,16,19-22,25,27] with 3648 cases and 5219 controls estimated the correlation of COX-2 -1195G>A to CRC susceptibility. As a whole, genetic variant -1195 A allele of COX-2 significantly increased the risk of CRC occurrence (AG vs. GG, OR=1.227, 95% CI= 1.060-1.419, Ph=0.085, POR=0.006). (Figure 3, Table S3,) It was well known that large sample size could increase the statistical power on such a relationship. Of interest, we identified consistent result that A allele was associated with CRC susceptibility in the subgroup of sample size ≥500 under two genetic models (AG vs. GG, OR=1.232, 95% CI=1.064-1.426, Ph=0.056, POR=0.005; AA vs. AG+GG, OR=1.162, 95% CI=1.006-1.342, Ph=0.042, POR=0.041). (Figure 4 A-B, Table S3,). In addition, the results remained consistent when excluded two studies deviated from HWE. Sensitivity analysis confirmed that all results of -1195G>A polymorphism turned out to be stable.
Table S2. Summary of specific COX-2 polymorphisms and HWE in each study
HWE, Hardy-Weinberg equilibrium was calculated by goodness-of-fit x2-test.
Author
|
-765G>C |
HWE
|
-1195G>A |
HWE |
8473T>C |
HWE |
GG |
CG |
CC |
GG |
AG |
AA |
TT |
CT |
CC |
Hamajima [12] |
140/230 |
8/11 |
0/0 |
0.72 |
|
|
|
|
|
|
|
|
Cox [13] |
150/170 |
59/77 |
11/10 |
0.73 |
|
|
|
|
140/126 |
121/120 |
29/25 |
0.64 |
Koh [14] |
273/1067 |
37/110 |
NA |
|
|
|
|
|
|
|
|
Siezen [15] |
|
|
|
|
29/61 |
191/354 |
410/665 |
0.13 |
313/529 |
254/444 |
75/108 |
0.3 |
Tan [16] |
919/1237 |
81/63 |
0/0 |
0.37 |
178/300 |
502/692 |
320/308 |
0.02 |
|
|
|
|
Xing [17] |
119/169 |
17/29 |
1/1 |
0.84 |
|
|
|
|
|
|
|
|
Iglesias [18] |
172/76 |
99/43 |
13/4 |
0.48 |
|
|
|
|
|
|
|
|
Thompson [19] |
291/343 |
119/121 |
11/15 |
0.16 |
9/15 |
138/168 |
275/297 |
0.13 |
176/216 |
189/199 |
56/65 |
0.08 |
Hoff [20] |
241/249 |
75/112 |
10/8 |
0.17 |
12/13 |
101/124 |
213/232 |
0.47 |
|
|
|
|
Andersen [21] |
267/566 |
83/186 |
9/13 |
0.14 |
13/25 |
116/258 |
230/482 |
0.18 |
147/315 |
178/355 |
34/95 |
0.74 |
Pereira [22] |
77/166 |
38/83 |
2/7 |
0.19 |
4/6 |
43/73 |
70/177 |
0.63 |
54/118 |
51/114 |
10/24 |
0.64 |
Wang [23] |
207/238 |
87/111 |
11/10 |
0.18 |
|
|
|
|
|
|
|
|
Daraei [24] |
38/53 |
67/58 |
5/9 |
0.32 |
|
|
|
|
|
|
|
|
Zhang [25] |
|
|
|
|
50/94 |
216/184 |
77/62 |
0.09 |
218/202 |
105/115 |
20/23 |
0.24 |
Ross [26] |
|
|
|
|
|
|
|
|
74/107 |
93/83 |
16/33 |
0.01 |
Li [27] |
|
|
|
|
87/114 |
248/336 |
116/179 |
0.05 |
|
|
|
|
| |
|
|
|
|
|
|
|
|
|
|
|
|
|
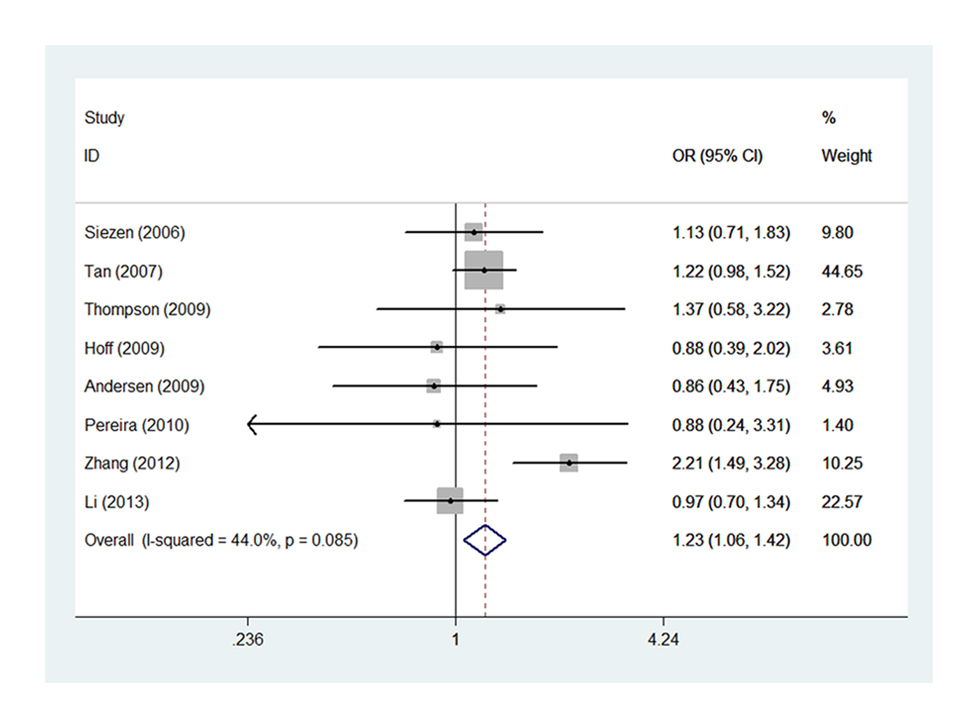
Figure 3. Forest plot of COX-2 -1195G>A polymorphism correlating to CRC susceptibility: AG vs. GG.
Table 3: Summary of the OR and P value for the association between three common polymorphisms of COX-2 and CRC susceptibility
ORs, odds ratios; COX-2, cyclooxygenase-2; CRC, colorectal cancer; CI, confidence interval; Ht, heterozygote; WT Ho, wide-type homozygote; VR Ho, variant homozygote; Ph, P values for heterogeneity from Q test. Random-effects model was used when P value for heterogeneity test <0.05; otherwise, fixed-model was used. POR, the P values of the pooled OR
Genetic model |
|
Ht vs. WT Ho |
VR Ho vs. WT Ho |
Dominant model |
Recessive model |
-765G>C |
n |
CG/GG |
CC/GG |
CG+CC/GG |
CC/CG+GG |
|
|
OR (95%CI) |
Ph |
POR |
OR (95%CI) |
Ph |
POR |
OR (95%CI) |
Ph |
POR |
OR (95%CI) |
Ph |
POR |
Total |
12 |
1.035[0.871,1.231] |
0.034 |
0.696 |
1.144[0.811,1.613] |
0.666 |
0.442 |
1.012[0.881,1.162] |
1.000 |
0.871 |
1.118[0.801,1.559] |
0.902 |
0.513 |
Ethnicity |
Caucasian |
6 |
0.938[0.811,1.086] |
0.380 |
0.392 |
1.148[0.778,1.695] |
0.898 |
0.486 |
0.965[0.831,1.101] |
0.540 |
0.534 |
1.168[0.794,1.719] |
0.850 |
0.429 |
Asian |
5 |
1.477[1.148,1.898] |
0.242 |
0.002 |
0.847[0.289,2.479] |
0.694 |
0.762 |
1.415[1.146,1.747] |
0.387 |
0.001 |
0.665[0.236,1.874] |
0.553 |
0.440 |
Mixed |
1 |
0.901[0.643,1.262] |
- |
0.545 |
1.265[0.526,3.038] |
- |
0.599 |
0.931[0.673,1.289] |
- |
0.667 |
1.306[0.547,3.118] |
- |
0.548 |
Source of control |
PB |
4 |
1.107[0.911,1.345] |
0.224 |
0.307 |
0.870[0.512,1.479] |
0.248 |
0.608 |
0.987[0.791,1.232] |
0.935 |
0.908 |
0.941[0.562,1.575] |
0.394 |
0.817 |
HB |
8 |
1.003[0.758,1.326] |
0.018 |
0.986 |
1.404[0.827,2.384] |
0.859 |
0.209 |
1.026[0.840,1.253] |
1.000 |
0.801 |
1.254[0.753,2.089] |
0.924 |
0.384 |
Sample size |
≥500 |
7 |
1.009[0.789,1.289] |
0.006 |
0.946 |
1.187[0.806,1.750] |
0.923 |
0.385 |
1.061[0.867,1.299] |
0.016 |
0.563 |
1.216[0.827,1.787] |
0.866 |
0.320 |
<500 |
5 |
1.088[0.851,1.391] |
0.566 |
0.500 |
0.970[0.491,1.918] |
0.808 |
0.931 |
1.078[0.848,1.370] |
0.678 |
0.540 |
0.872[0.449,1.693] |
0.682 |
0.685 |
-1195G>A |
n |
AG/GG |
AA/GG |
AG+AA/GG |
AA/AG+GG |
|
|
OR(95%CI) |
Ph |
POR |
OR (95%CI) |
Ph |
POR |
OR (95%CI) |
Ph |
POR |
OR (95%CI) |
Ph |
POR |
Total |
8 |
1.227[1.060,1.419] |
0.085 |
0.006 |
1.287[0.948,1.749] |
0.009 |
0.106 |
1.255[0.976,1.613] |
0.030 |
0.077 |
1.109[0.946,1.301] |
0.008 |
0.203 |
Ethnicity |
Caucasian |
5 |
1.048[0.762,1.442] |
0.910 |
0.771 |
1.145[0.840,1.560] |
0.686 |
0.392 |
1.112[0.818,1.510] |
0.781 |
0.498 |
1.083[0.959,1.223] |
0.269 |
0.199 |
Asian |
3 |
1.350[0.902,2.020] |
0.006 |
0.145 |
1.499[0.871,2.581] |
0.001 |
0.144 |
1.402[0.917,2.143] |
0.002 |
0.118 |
1.203[0.837,1.729] |
0.004 |
0.319 |
Control source |
PB |
3 |
1.096[0.766,1.568] |
0.700 |
0.616 |
1.227[0.866,1.737] |
0.599 |
0.250 |
1.329[1.141,1.548] |
0.625 |
0.343 |
1.126[0.981,1.294] |
0.809 |
0.092 |
HB |
5 |
1.253[0.898,1.750] |
0.023 |
0.185 |
1.297[0.823,2.042] |
0.002 |
0.262 |
1.274[0.889,1.826] |
0.007 |
0.187 |
1.077[0.809,1.435] |
0.001 |
0.611 |
Sample size |
≥500 |
7 |
1.232[1.064,1.426] |
0.056 |
0.005 |
1.336[0.980,1.821] |
0.009 |
0.067 |
1.281[0.991,1.658] |
0.024 |
0.059 |
1.162[1.006,1.342] |
0.042 |
0.041 |
<500 |
1 |
0.884[0.236,3.308] |
- |
0.854 |
0.593[0.162,2.166] |
- |
0.429 |
0.678[0.188,2.450] |
- |
0.553 |
0.665[0.422,1.048] |
- |
0.079 |
8473T>C |
n |
CT/TT |
|
|
CC/TT |
|
|
CT+CC/TT |
|
|
CC/CT+TT |
|
|
|
|
OR(95%CI) |
Ph |
POR |
OR (95%CI) |
Ph |
POR |
OR (95%CI) |
Ph |
POR |
OR (95%CI) |
Ph |
POR |
Total |
7 |
1.032[0.922,1.156] |
0.266 |
0.583 |
0.967[0.806,1.161] |
0.688 |
0.720 |
1.017[0.914,1.132] |
0.597 |
0.752 |
0.939[0.789,1.117] |
0.351 |
0.477 |
Ethnicity |
Caucasian |
6 |
1.061[0.940,1.197] |
0.304 |
0.339 |
0.984[0.813,1.190] |
0.615 |
0.865 |
1.045[0.932,1.171] |
0.716 |
0.454 |
0.947[0.790,1.134] |
0.254 |
0.553 |
Asian |
1 |
0.846[0.610,1.173] |
- |
0.316 |
0.806[0.430,1.511] |
- |
0.501 |
0.839[0.616,1.143] |
- |
0.266 |
0.853[0.460,1.585] |
- |
0.616 |
Control source |
PB |
4 |
1.045[0.907,1.203] |
0.561 |
0.547 |
1.019[0.818,1.269] |
0.306 |
0.867 |
1.040[0.910,1.189] |
0.737 |
0.564 |
0.990[0.804,1.218] |
0.192 |
0.922 |
HB |
3 |
0.895[0.724,1.106] |
0.878 |
0.305 |
0.922[0.632,1.346] |
0.840 |
0.674 |
0.898[0.734,1.098] |
0.846 |
0.293 |
0.964[0.669,1.390] |
0.837 |
0.845 |
Sample size |
≥500 |
5 |
0.997[0.883,1.126] |
0.588 |
0.963 |
0.999[0.821,1.214] |
0.578 |
0.990 |
0.996[0.888,1.118] |
0.671 |
0.948 |
0.987[0.820,1.189] |
0.457 |
0.892 |
<500 |
2 |
1.289[0.947,1.756] |
0.112 |
0.107 |
0.779[0.466,1.302] |
0.624 |
0.341 |
1.167[0.870,1.566] |
0.259 |
0.302 |
0.675[0.413,1.101] |
0.315 |
0.115 |
Systemic review of the association between -765G>C and CRC susceptibility
On the whole, polymorphism -765G>C did not influence CRC susceptibility under any of the four genetic models. Studies involved in the meta-analysis were heterogeneous for the diversity of ethnicity composition, discrepancy of source of controls, difference of genetic background as well as variation in sample size, all of which may change the final results. Therefore, subgroup analysis was carried out to consider the confounding factors’ potential influence. As for -765G>C polymorphism, a significantly high CRC risk was found only in the subgroup of Asian descents under the heterozygote and dominant model (CG vs. GG, OR=1.477, 95% CI= 1.148-1.898, Ph=0.242, POR=0.002; CG+CC vs. GG, OR=1.451, 95% CI=1.146-1.747, Ph=0.387, POR=0.001, respectively) (Figure 5 A-B, Table S3).
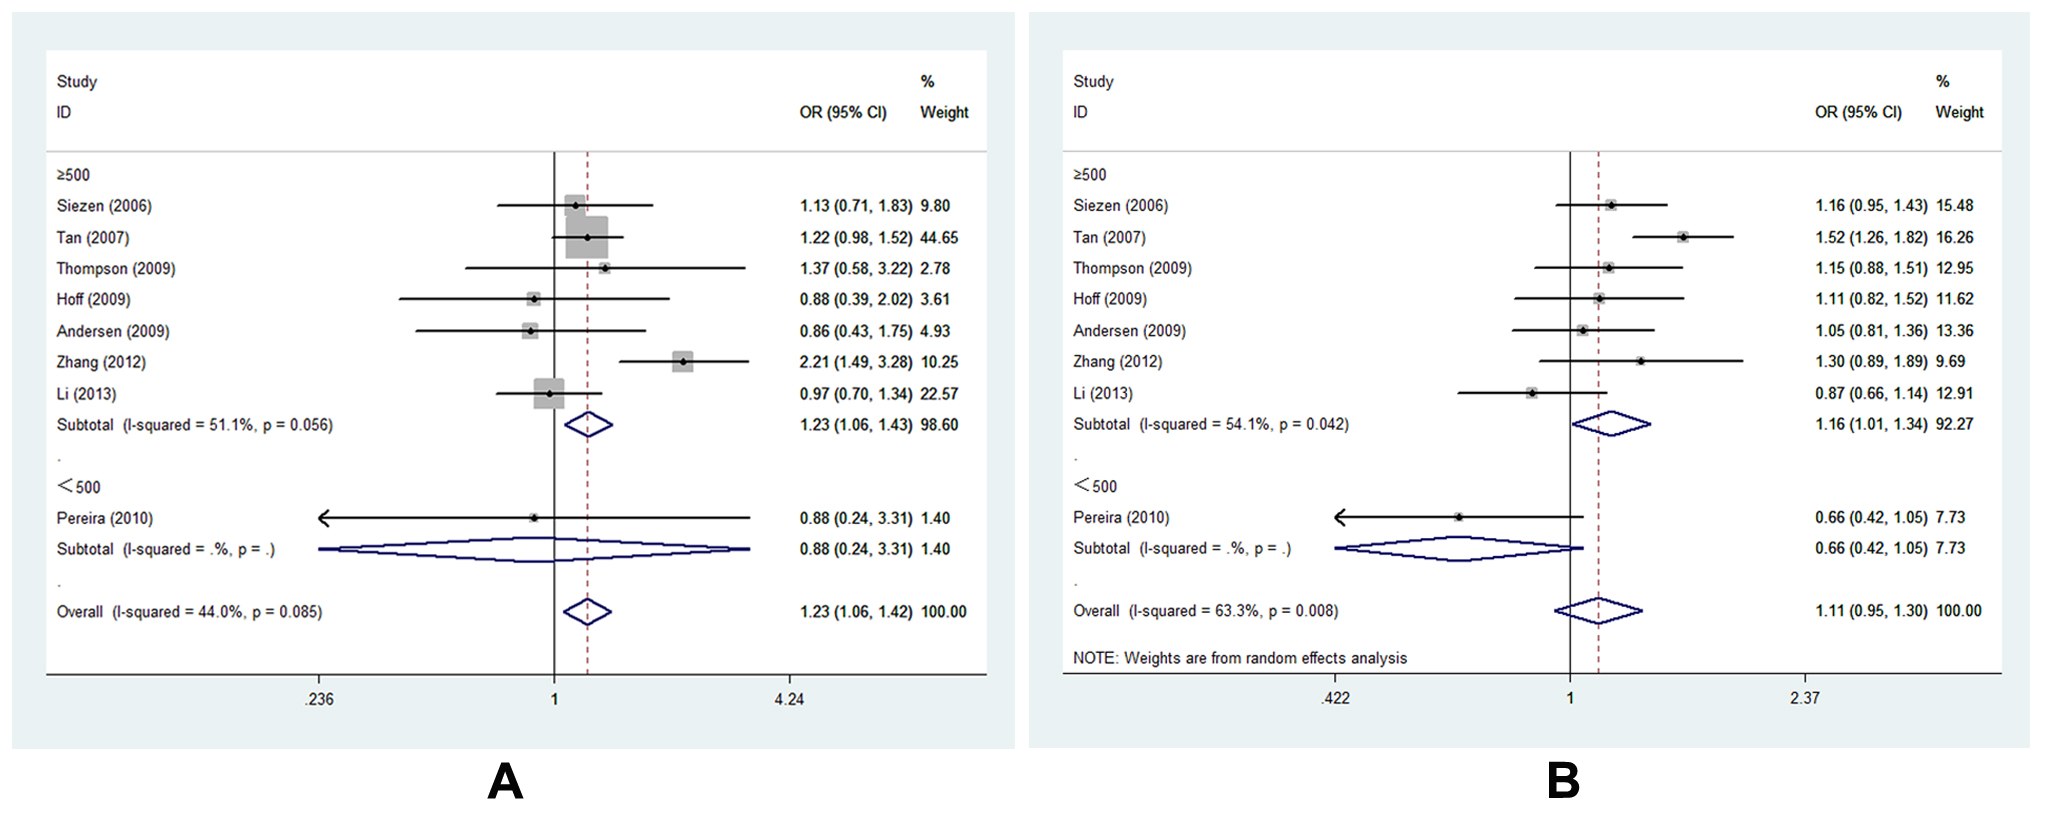
Figure 4. Forest plot of COX-2 -1195G>A polymorphism correlating to CRC susceptibility in subgroup analysis of sample size in different genetic models: A, forest plot for -1195G>A (AG vs. GG, size≥500); B, forest plot for -1195G>A (AA vs. AG+GG, size≥500)
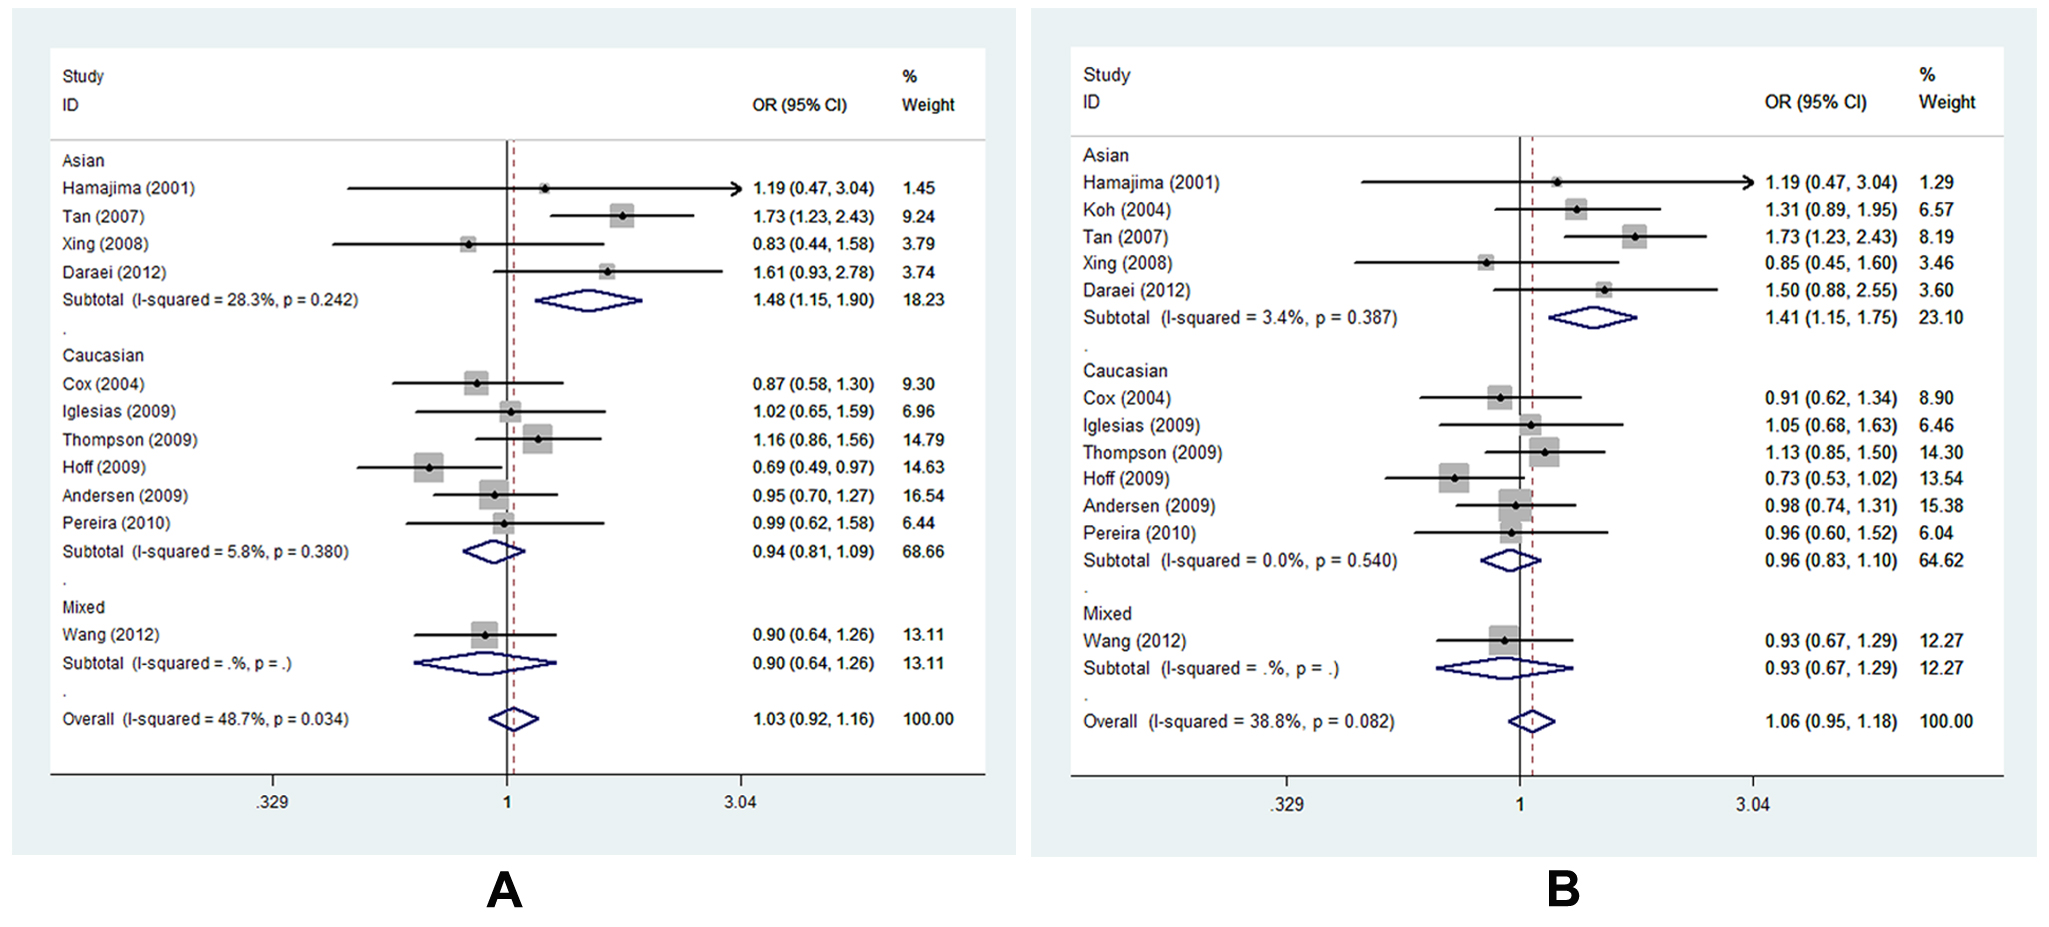
Figure 5. Forest plot of COX-2 -765G>C polymorphism correlating to CRC susceptibility in subgroup analysis of ethnicity in different genetic models: A, forest plot for -765G>C (CG vs. GG); B, forest plot for -765G>C (CG+CC vs. GG).
Meta-analysis of the association between 8473T>C and CRC risk
The correlation between 8473T>C polymorphism and CRC risk wasn’t identified either on the whole or in any subgroup (Table S3).
Systemic review of the interactive influence of environmental factors and COX-2 polymorphisms on CRC susceptibility
Among the 16 eligible studies, only five articles reported the potential interactive impact of environment factors and COX-2 polymorphisms on CRC susceptibility [17,21,22,24,27]. And what’s more, the results were controversial (Table S4). Take NASID for example, one study reported that CRC risk reduction was associated with NSAID use among those with the COX-2 -1195AA genotype [27]. Another paper proved a negative result for such a relationship [21]. The condition was similar regarding smoking. Smoking associated risk was stronger among those with -765GG genotype, showing that smokers had a 2.682-fold greater risk of CRC than nonsmokers [17]. In contrast, negative finding was found in Daraei’s work [24]. Herein, we conduct a meta-analysis to estimate the precise interactive effect based on the limited available data. The result shown that smokers with -765GG genotype would be more susceptible to CRC occurrence than nonsmokers (OR=1.761, 95% CI=1.144-2.711, Ph=0.286, POR=0.010) (Figure 6, Table S4).
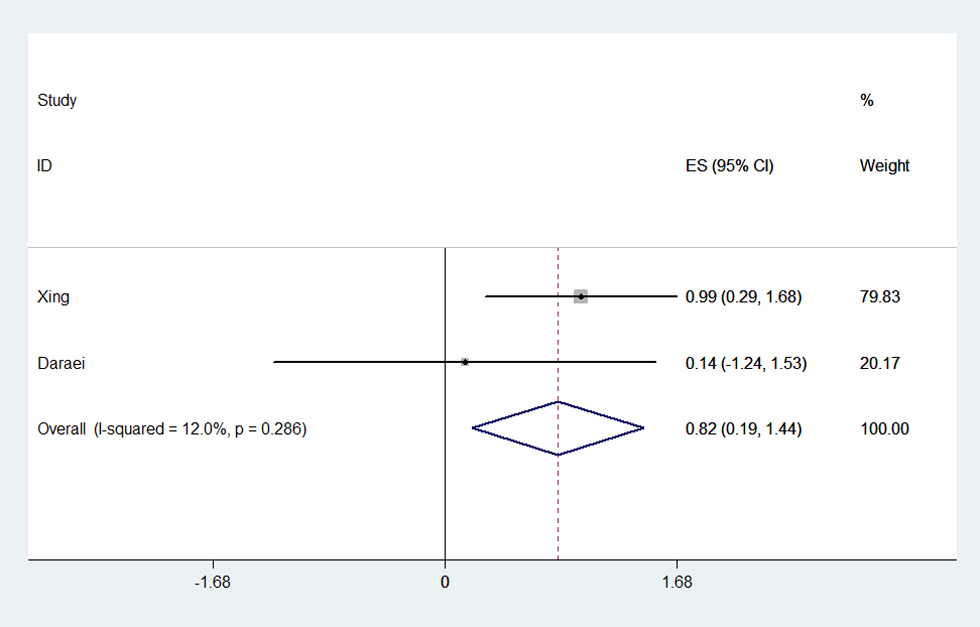
Figure 6. Forest plot of smoking associated risk for CRC in -765GG genotype. The meta-analysis was performed using effect/CI combination by generating lnor, lnll and lnul parameters.
Table 4. Summary of the OR and P value for the interactive influence of polymorphisms in COX-2 and environmental factors on CRC risk
ORs, odds ratios; COX-2, cyclooxygenase-2; CRC, colorectal cancer; CI, confidence interval; Random-effects model was used when P value for heterogeneity test <0.05; otherwise, fixed-model was used.
-1195G>A |
NSAIDs use |
AA(OR, 95%CI) |
GA+GG(OR, 95%CI) |
P-value |
combined P-value |
Andersen [21] |
No |
Ref |
0.943[0.689, 1.292] |
- |
0.715 |
|
|
Yes |
1.020[0.728, 1.428] |
1.004[0.659, 1.531] |
0.908 |
0.984 |
|
Li [27] |
No |
Ref |
1.08[0.78, 1.49] |
- |
>0.05 |
|
|
Yes |
0.19[0.04-0.87] |
0.58[0.22, 1.50] |
<0.05 |
>0.05 |
0.734 |
-1195G>A |
Smoking status |
AA(OR, 95%CI) |
GA+GG(OR, 95%CI) |
P-value |
combined P-value |
Pereira [22] |
No |
Ref |
0.776[0.405, 1.488] |
- |
0.445 |
|
|
Yes |
0.659[0.354, 1.226] |
6.085[2.322, 15.95] |
0.188 |
0.000 |
|
Li [27] |
No |
Ref |
1.50[1.02, 2.22] |
- |
>0.05 |
|
|
Yes |
1.26[0.77-2.06] |
1.08[0.72, 1.62] |
>0.05 |
>0.05 |
|
0.077 |
-765G>C |
NSAIDs use |
GG(OR, 95%CI) |
GC+CC(OR, 95%CI) |
P-value |
combined P-value |
Andersen [21] |
No |
Ref |
1.094[0.775, 1.546] |
- |
0.609 |
|
|
Yes |
1.135[0.830, 1.553] |
0.876[0.542, 1.414] |
0.426 |
0.587 |
|
Daraei [24] |
No |
Ref |
1.933[1.067, 3.501] |
- |
0.030 |
|
0.125 |
|
Yes |
0.994[0.341, 2.896] |
0.598[0.232, 1.538] |
0.991 |
0.286 |
|
-765G>C |
Smoking status |
GG(OR, 95%CI) |
GC+CC(OR, 95%CI) |
P-value |
combined P-value |
Xing [17] |
No |
Ref |
0.618[0.250, 1.526] |
- |
0.297 |
|
|
Yes |
2.682[1.336, 5.385] |
2.265[0.894, 5.734] |
0.006 |
0.085 |
|
Daraei [24] |
No |
Ref |
1.548[0.872, 2.746] |
- |
0.135 |
|
|
Yes |
1.153[0.288, 4.609] |
1.681[0.693, 4.080] |
0.840 |
0.251 |
0.010 |
Publication bias
The publication bias of all illegible articles was evaluated by funnel plot, Begg’s test as well as Egger’s tests. The symmetrical shape of the funnel plots (Figure 7 A-D) indicated that no distinct publication bias was existed in all polymorphisms analysis. In addition, the calculated results from Begg’s test and Egger’s test statistically validated the negative outcome (Figure 8).
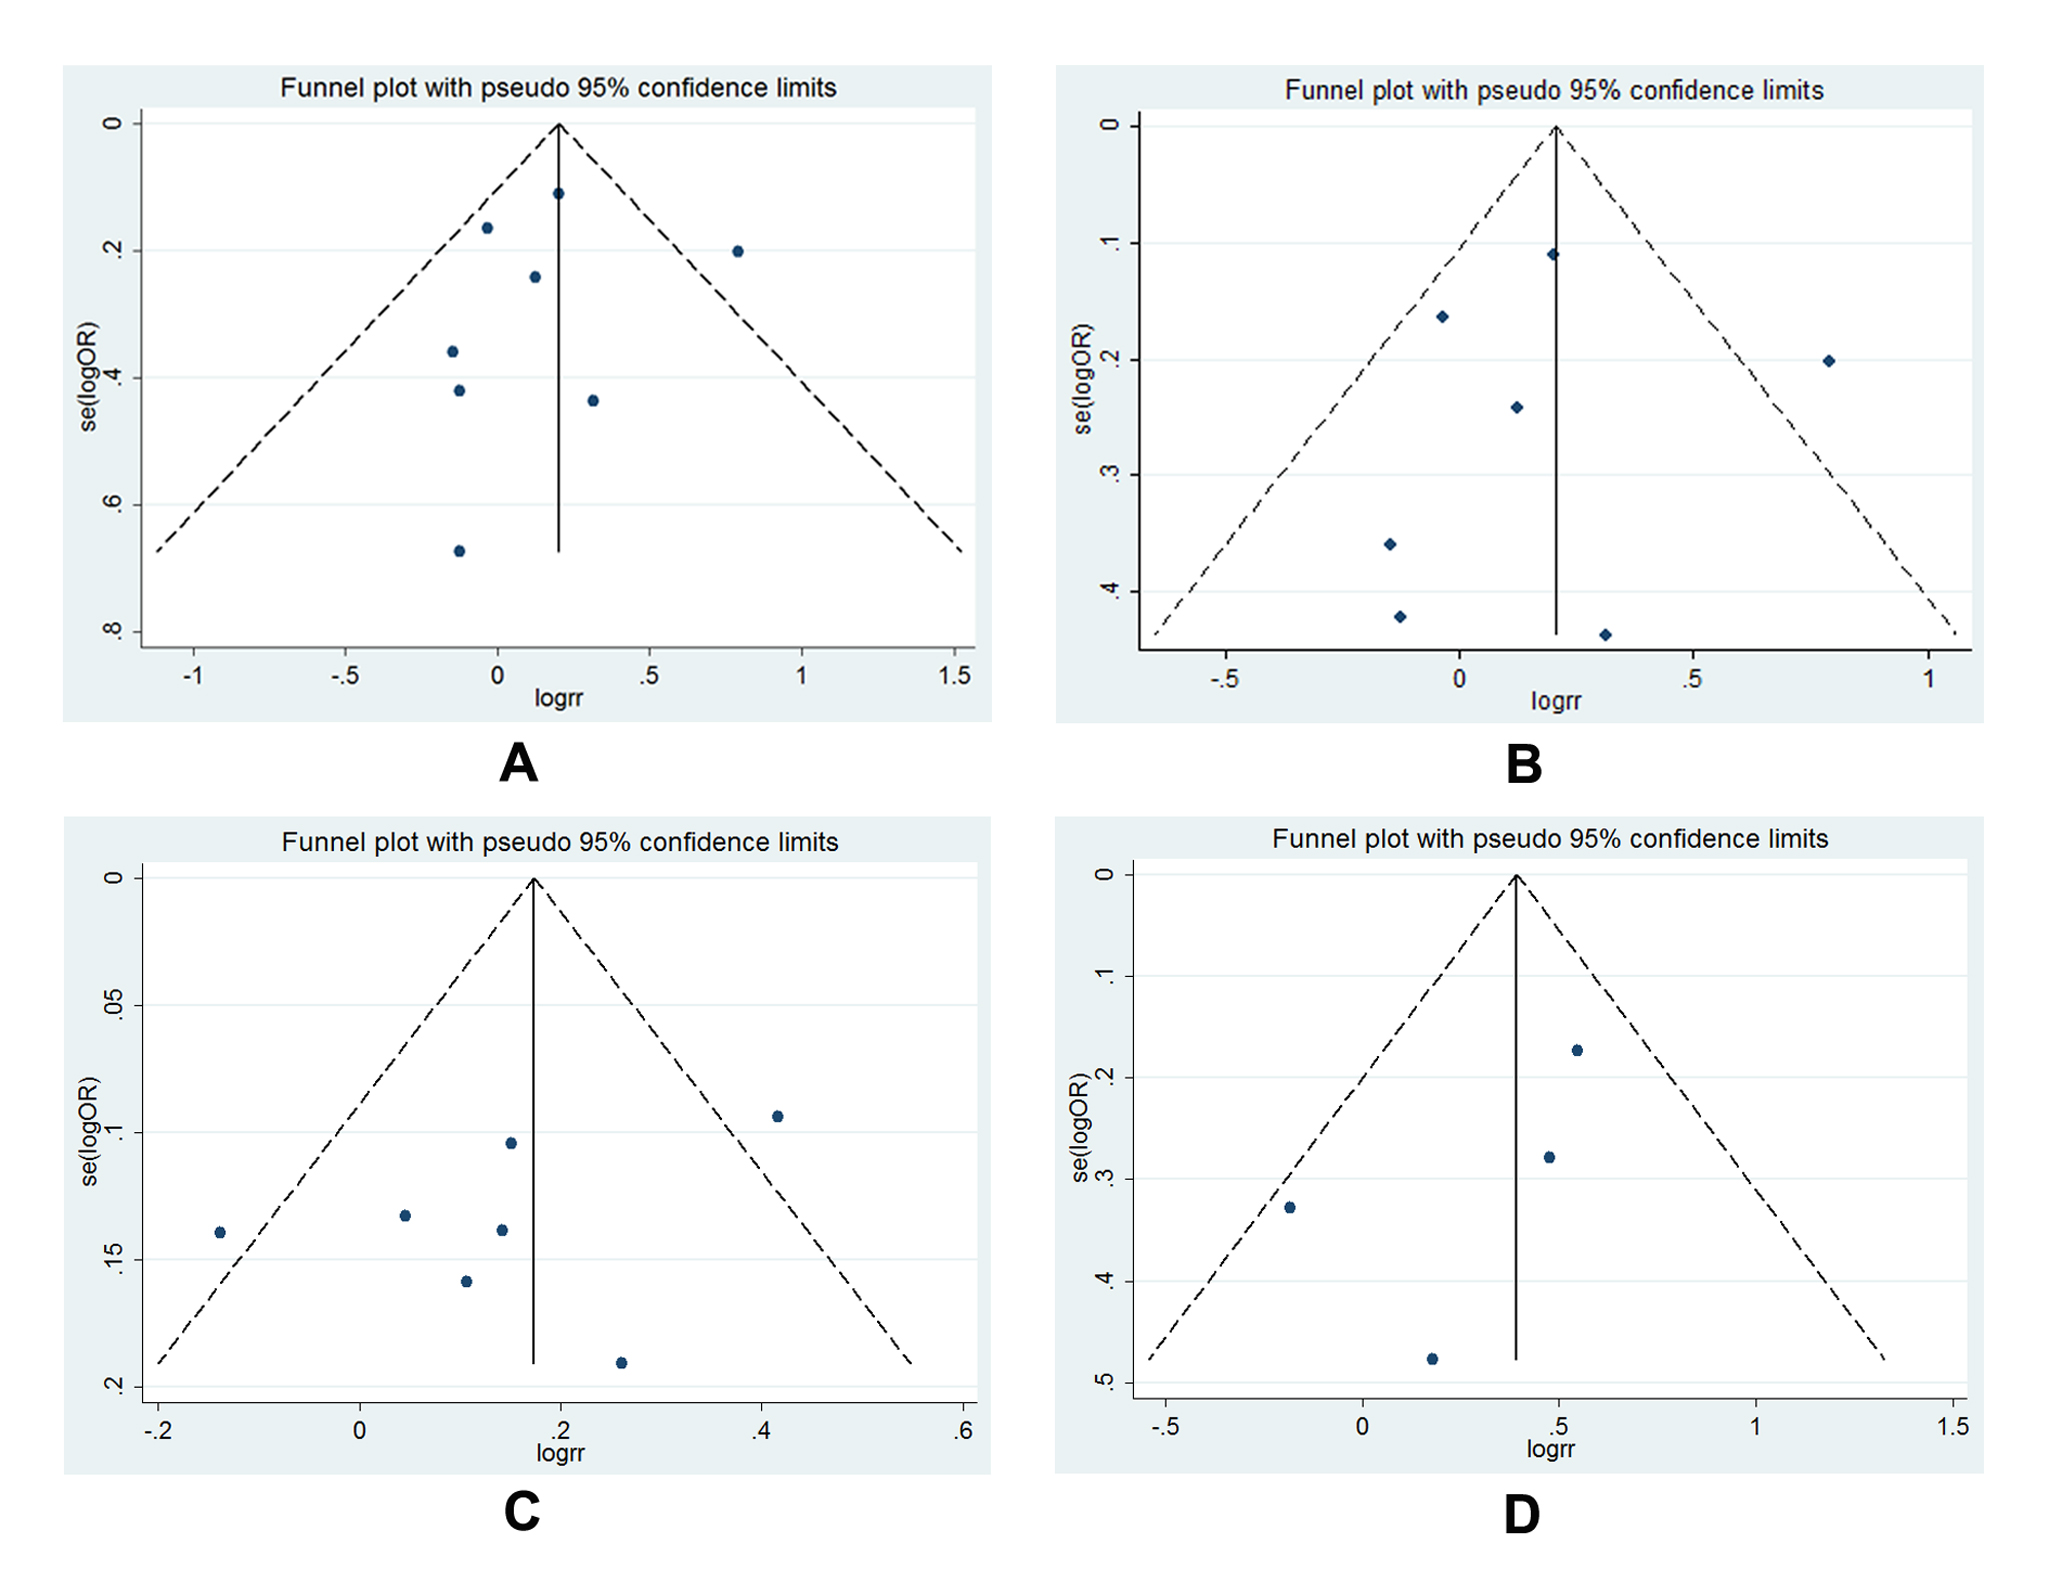
Figure 7. Funnel plot for publication bias test: A, funnel plot for -1195G>A (AG vs. GG); B, funnel plot for -1195G>A (AG vs. GG, size≥500); C, funnel plot for -1195G>A (AA vs. AG+GG, size≥500); D, funnel plot for -765G>C (CG vs. GG, Asian) and -765G>C (CG+CC vs. GG, Asian); each point represents an individual study involved in this updated meta-analysis; E, Statistical analysis of P value for Begg’s funnel plot and Egger’s publication bias plot.
Discussion
Colorectal cancer (CRC) is the third most common malignancy worldwide initiating from unbalanced changes of genetic variation and environmental factors for a long time [34]. Inflammation is recognized as a crucial risk factor for CRC [3]. As a pro-inflammatory enzyme, increasing amount of studies exploring the potential effect of COX-2 on CRC initiation and development has proved its important role in colorectal carcinogenesis [5,6,35]. Functional genetic variations in COX-2, resulting in alteration of COX-2 enzyme expression and/or activity, may influence the risk of individuals to develop CRC [36]. As reported, the -1195A>G and -765G>C polymorphisms, identified in the promoter region of COX-2 [37,38], and 8473T>C polymorphism in an AU-rich elements region (3’UTR) might change the genetic susceptibility for CRC onset through the modulation effect on COX-2 [39-41]. However, the results turned out to be contradictory. In such a case, we performed the present meta-analysis including twelve studies for -765G>C [12-14,16-24], eight studies for -1195G>A [15,16,19-22,25,27], and seven studies for 8473T>C [13,15,19,21,25,26] to clarify the potential influence of these three polymorphisms on the susceptibility to CRC. Based on the findings of this meta-analysis, we suggested that -1195G>A polymorphism was significantly correlated to CRC susceptibility worldwide whereas -765G>C was a potential CRC risk factor only in Asian population. In addition, 8473T>C polymorphism had no influence on CRC susceptibility.
Though the mechanisms underlying the contribution of COX-2 -1195G>A and -765G>C polymorphism to CRC onset were not clearly elucidated, several studies implied that variant A allele of -1195G>A and C allele of -765G>C could increase the COX-2 expression and activity [37,38]. Interestingly, we identified an increased CRC susceptibility in -765G>C polymorphism only in the Asian descents, which was opposite to previous studies [13,20] in a Caucasian or Dutch population. Several reasons could be clearly interpreted the differential affections of -765C carriers for CRC development in different ethnicities. First of all, different ethnicities possessed different genetic backgrounds. In this meta-analysis, the frequency of C allele of Asians and Caucasians in controls was significantly different, that was 0.03 for Asians and 0.16 for Caucasians, respectively. Secondly, environmental factors such as smoking could increase individual’s CRC risk with specific genotypes [17,22]. Thirdly, published studies have reported that NSAIDs can reduce the risk of CRC [9,10,42] through inhibiting the COX-2 enzyme activity and prostaglandin synthesis. Compared with Asia, Europe and USA were the larger consumers of NSAIDs. Thus, the risk effect of the COX-2 -765G>C polymorphism could be more evident in Asia population. As for 8473T>C polymorphism, it was considered to be a potential candidate to modulate COX-2 expression through altering mRNA stability and degradation attributing to location in the 3’-untranslated region (UTR) of COX-2 [43-45]. However, 8473T>C polymorphism was not associated with CRC occurrence in this meta-analysis, which was in accordance with previously published studies [13,15,19,21,22,25]. In contrast, it was reported that 8473T>C polymorphism tremendously affected the genetic susceptibility for other epithelial malignancies, such as prostate cancer [46], lung cancer [47]. These findings seemed to suggest that the role of 8473T>C polymorphism was different or even opposite in different types of cancer.
Interactive influence between gene background and environmental factors was considered the root cause of CRC development [34]. One study reported that CRC risk reduction was associated with NSAID use among those with the COX-2 -1195AA genotype [27]. Moreover, smoking associated risk was stronger among those with -765GG genotype, showing that smokers had a 2.682-fold greater risk of CRC than nonsmokers [17]. However, other studies reported opposite findings [21,24]. Herein, we evaluated the combined effect using meta-analytic method. On the basis of two available studies of the same polymorphism in Asian population [17,24], we suggested that smokers with -765GG genotype would be more susceptible to CRC occurrence than nonsmokers. Nevertheless, null association was identified between NASIDs and -1195G>A, -765G>C polymorphism due to only two papers of each polymorphism, one of Asian and one of Caucasian. Therefore, the result should be interpreted with caution and more studies of different ethnicities with the consideration of gene-gene and gene-environment interactions should be conducted to valid the findings.
In this systematic review, no publication bias existed. However, several limitations needed to be mentioned. First of all, sample size sharply deviated from 230 to 2300 among included studies. The studies with small sample size may not have enough statistical power to identify the authentic association between specific polymorphisms and CRC risk. Secondly, the baseline of controls and cases, such as age, gender, NSAIDs use, smoking status, was not uniformly adjusted in each study, which may generate confounding bias. The current meta-analysis was carried out based on the unadjusted ORs. Therefore, the results from the meta-analysis should be interpreted with caution and more rigorous analyses should be performed with adequate available data. Thirdly, though the influence of gene-environment interactions on CRC risk was estimated in this meta-analysis, it was hard to obtain a strong conclusion due to the limited available studies. More studies were urgently needed to increase the statistical power.
In conclusion, -1195G>A polymorphism contributed to CRC susceptibility worldwide whereas -765G>C polymorphism dramatically influenced the CRC risk among Asian descents. The smokers with -765GG genotype would be more susceptible to CRC development. Further large-scale studies with the consideration of gene-gene and gene-environment interactions are warranted to validate the findings.
Acknowledgments
We thank all the people who give technical support and useful discussion of the paper.
References
- Jemal A, Bray F, Center MM, Ferlay J, Ward E, et al. (2011) Global cancer statistics. CA Cancer J Clin 61: 69-90. [Crossref]
- Siegel R, Naishadham D, Jemal A (2013) Cancer statistics, 2013. CA Cancer J Clin 63: 11-30. [Crossref]
- Wang D, Dubois RN (2010) The role of COX-2 in intestinal inflammation and colorectal cancer. Oncogene 29: 781-788. [Crossref]
- Smith WL, Langenbach R (2001) Why there are two cyclooxygenase isozymes. J Clin Invest 107: 1491-1495. [Crossref]
- Yao L, Liu F, Hong L, Sun L, Liang S, et al. (2011) The function and mechanism of COX-2 in angiogenesis of gastric cancer cells. J Exp Clin Cancer Res 30: 13. [Crossref]
- Wang YH, Wu MW, Yang AK, Zhang WD, Sun J, et al. (2011) COX-2 Gene increases tongue cancer cell proliferation and invasion through VEGF-C pathway. Med Oncol 28 Suppl 1: S360-366. [Crossref]
- Elzagheid A, Emaetig F, Alkikhia L, Buhmeida A, Syrjänen K, et al. (2013) High cyclooxygenase-2 expression is associated with advanced stages in colorectal cancer. Anticancer Res 33: 3137-3143. [Crossref]
2021 Copyright OAT. All rights reserv
- Peng L, Zhou Y, Wang Y, Mou H, Zhao Q (2013) Prognostic significance of COX-2 immunohistochemical expression in colorectal cancer: a meta-analysis of the literature. PLoS One 8: e58891. [Crossref]
- Dube C, Rostom A, Lewin G, Tsertsvadze A, Barrowman N, et al. (2007) The use of aspirin for primary prevention of colorectal cancer: a systematic review prepared for the U.S. preventive services task force. Ann Intern Med 146: 365-375. [Crossref]
- Baron JA, Cole BF, Sandler RS, Haile RW, Ahnen D, et al. (2003) A randomized trial of aspirin to prevent colorectal adenomas. N Engl J Med 348: 891-899. [Crossref]
- Brown JR, DuBois RN (2005) COX-2: a molecular target for colorectal cancer prevention. J Clin Oncol 23: 2840-2855. [Crossref]
- Hamajima N, Takezaki T, Matsuo K, Saito T, Inoue M, et al. (2001) Genotype Frequencies of Cyclooxygenease 2 (COX2) Rare Polymorphisms for Japanese with and without Colorectal Cancer. Asian Pac J Cancer Prev 2: 57-62. [Crossref]
- Cox DG, Pontes C, Guino E, Navarro M, Osorio A, et al. (2004) Polymorphisms in prostaglandin synthase 2/cyclooxygenase 2 (PTGS2/COX2) and risk of colorectal cancer. Br J Cancer 91: 339-343. [Crossref]
- Siezen CL, Bueno-de-Mesquita HB, Peeters PH, Kram NR, van Doeselaar M, et al. (2006) Polymorphisms in the genes involved in the arachidonic acid-pathway, fish consumption and the risk of colorectal cancer. Int J Cancer 119: 297-303. [Crossref]
- Koh WP, Yuan JM, van den Berg D, Lee HP, Yu MC (2004) Interaction between cyclooxygenase-2 gene polymorphism and dietary n-6 polyunsaturated fatty acids on colon cancer risk: the Singapore Chinese Health Study. Br J Cancer 90: 1760-1764. [Crossref]
- Tan W, Wu J, Zhang X, Guo Y, Liu J, et al. (2007) Associations of functional polymorphisms in cyclooxygenase-2 and platelet 12-lipoxygenase with risk of occurrence and advanced disease status of colorectal cancer. Carcinogenesis 28: 1197-1201. [Crossref]
- Xing LL, Wang ZN, Jiang L, Zhang Y, Xu YY, et al. (2008) Cyclooxygenase 2 polymorphism and colorectal cancer: -765G>C variant modifies risk associated with smoking and body mass index. World J Gastroenterol 14: 1785-1789. [Crossref]
- Iglesias D, Nejda N, Azcoita MM, Schwartz S Jr, González-Aguilera JJ, et al. (2009) Effect of COX2 -765G>C and c.3618A>G polymorphisms on the risk and survival of sporadic colorectal cancer. Cancer Causes Control 20: 1421-1429. [Crossref]
- Thompson CL, Plummer SJ, Merkulova A, Cheng I, Tucker TC, et al. (2009) No association between cyclooxygenase-2 and uridine diphosphate glucuronosyl- transferase 1A6 genetic polymorphisms and colon cancer risk. World J Gastroenterol 15: 2240-1144. [Crossref]
- Hoff JH, te Morsche RH, Roelofs HM, van der Logt EM, Nagengast FM, et al. (2009) COX-2 polymorphisms -765G-->C and -1195A-->G and colorectal cancer risk. World J Gastroenterol 15: 4561-4565. [Crossref]
- Andersen V, Ostergaard M, Christensen J, Overvad K, Tjønneland A, et al. (2009) Polymorphisms in the xenobiotic transporter Multidrug Resistance 1 (MDR1) and interaction with meat intake in relation to risk of colorectal cancer in a Danish prospective case-cohort study. BMC Cancer 9: 407. [Crossref]
- Pereira C, Pimentel-Nunes P, Brandão C, Moreira-Dias L, Medeiros R, et al. (2010) COX-2 polymorphisms and colorectal cancer risk: a strategy for chemoprevention. Eur J Gastroenterol Hepatol 22: 607-613. [Crossref]
- Wang J, Joshi AD, Corral R, Siegmund KD, Marchand LL, et al. (2012) Carcinogen metabolism genes, red meat and poultry intake, and colorectal cancer risk. Int J Cancer 130: 1898-1907. [Crossref]
- Khorshidi F, Haghighi MM, Nazemalhosseini Mojarad E, Azimzadeh P, Damavand B, et al. (2012) PTGS2 (COX2) -765G>C gene polymorphism and risk of sporadic colorectal cancer in Iranian population. Asian Pac J Cancer Prev 15: 3507-11. [Crossref]
- Zhang Y, Liu CM, Peng HP, Zhang JZ, Cai XQ, et al. (2012) Relationship between polymorphisms in the promoter region of the COX-2 gene and susceptibility to colorectal cancer. World Chinese J Digestol 20: 1579-1584.
- Ross J, Lockett L, Brookes D, Tabor B, Duesing K, et al. (2013) An association between the PTGS2 rs5275 polymorphism and colorectal cancer risk in families with inherited non-syndromic predisposition. Eur J Hum Genet 21: 1389-1395. [Crossref]
- Li S, Zhao X, Wu Z, Li Y, Zhu L, et al. (2013) Polymorphisms in arachidonic acid metabolism-related genes and the risk and prognosis of colorectal cancer. Fam Cancer 12: 755-765. [Crossref]
- Cochran WG (1954) The combination of estimates from different experiments. Biometrics 10: 101-129.
- Higgins JP, Thompson SG, Deeks JJ, Altman DG (2003) Measuring inconsistency in meta-analyses. BMJ 327: 557-560. [Crossref]
- Mantel N, Haenszel W (1959) Statistical aspects of the analysis of data from retrospective studies of disease. J Natl Cancer Inst 22: 719-748. [Crossref]
- DerSimonian R, Laird N (1986) Meta-analysis in clinical trials. Control Clin Trials 7: 177-188. [Crossref]
- Begg CB, Mazumdar M (1994) Operating characteristics of a rank correlation test for publication bias. Biometrics 50: 1088-1101. [Crossref]
- Egger M, Davey Smith G, Schneider M, Minder C (1997) Bias in meta-analysis detected by a simple, graphical test. BMJ 315: 629-634. [Crossref]
- Weitz J, Koch M, Debus J, Höhler T, Galle PR, et al. (2005) Colorectal cancer. Lancet 365: 153-165. [Crossref]
- Mariani F, Sena P, Marzona L, Riccio M, Fano R, et al. (2009) Cyclooxygenase-2 and hypoxia-inducible factor-1 alpha protein expression is related to inflammation, and up-regulated since the early steps of colorectal carcinogenesis. Cancer Lett 279: 221-9. [Crossref]
- Pereira C, Medeiros RM, Dinis-Ribeiro MJ (2009) Cyclooxygenase polymorphisms in gastric and colorectal carcinogenesis: are conclusive results available? Eur J Gastroenterol Hepatol 21: 76-91. [Crossref]
- Papafili A, Hill MR, Brull DJ, McAnulty RJ, Marshall RP, et al. (2002) Common promoter variant in cyclooxygenase-2 represses gene expression: evidence of role in acute-phase inflammatory response. Arterioscler Thromb Vasc Biol 22: 1631-1636. [Crossref]
- Zhang X, Miao X, Tan W, Ning B, Liu Z, et al. (2005) Identification of functional genetic variants in cyclooxygenase-2 and their association with risk of esophageal cancer. Gastroenterology 129: 565-576. [Crossref]
- Dixon DA, Kaplan CD, McIntyre TM, Zimmerman GA, Prescott SM (2000) Post-transcriptional control of cyclooxygenase-2 gene expression. The role of the 3'-untranslated region. J Biol Chem 275: 11750-11757. [Crossref]
- Langsenlehner U, Yazdani-Biuki B, Eder T, Renner W, Wascher TC, et al. (2006) The cyclooxygenase-2 (PTGS2) 8473T>C polymorphism is associated with breast cancer risk. Clin Cancer Res 12: 1392-1394. [Crossref]
- Campa D, Zienolddiny S, Maggini V, Skaug V, Haugen A, et al. (2004) Association of a common polymorphism in the cyclooxygenase 2 gene with risk of non-small cell lung cancer. Carcinogenesis 25: 229-235. [Crossref]
- Gupta RA, Dubois RN (2001) Colorectal cancer prevention and treatment by inhibition of cyclooxygenase-2. Nat Rev Cancer 1: 11-21. [Crossref]
- Cok SJ, Morrison AR. (2001) The 3’-untranslated region of murine cyclooxygenase-2 contains multiple regulatory elements that alter message stability and translational efficiency. J Biol Chem 276(25): 23179-85. [Crossref]
- Moore AE, Young LE, Dixon DA (2012) A common single-nucleotide polymorphism in cyclooxygenase-2 disrupts microRNA-mediated regulation. Oncogene 31: 1592-1598. [Crossref]
- Caput D, Beutler B, Hartog K, Thayer R, Brown-Shimer S, et al. (1986) Identification of a common nucleotide sequence in the 3’-untranslated region of mRNA molecules specifying inflammatory mediators. Proc Natl Acad Sci U S A 83: 1670-4. [Crossref]
- Mandal RK, Mittal RD (2011) Polymorphisms in COX-2 gene influence prostate cancer susceptibility in a northern Indian cohort. Arch Med Res 42: 620-626. [Crossref]
- Park JM, Choi JE, Chae MH, Lee WK, Cha SI, et al. (2006) Relationship between cyclooxygenase 8473T>C polymorphism and the risk of lung cancer: a case-control study. BMC Cancer 6: 70. [Crossref]