Type-2 diabetes mellitus (T2DM) remains a leading contributor to cardiovascular mortality worldwide. This study was conducted to investigate the pattern of circulating endothelial progenitor cells (EPCs) in T2DM patients in comparison with MetS subjects in relation to inflammatory changes. Methods: The study retrospectively evolved 101 patients (54 subjects with T2DM and 47 patients with MetS) and 35 healthy volunteers. The flow cytometry was used for predictably distinguishing cell subsets, which depend on expression of CD45, CD34, CD14, Tie-2, and VEGFR2. Biomarkers were measured at baseline of the study. Results: Patients with MetS have demonstrated lower incidence of dyslipidemia, lower concentrations of HbA1c, fasting blood glucose, insulin, and LDL-C when compared with T2DM subjects. Higher HDL-C and HOMA-IR were found in T2DM patients than in MetS subjects. There is a significant difference between the medians of absolute numbers and frequencies of CD14+CD309+ and CD14+CD309+Tie2+ in healthy volunteers and patients with dysmetabolic disorders respectively. CD14+CD309+ and CD14+CD309+Tie2+ subsets of circulating EPCs were determined in higher concentration among MetS subjects in comparison with T2DM patients. Osteoprotegerin (OPG) and hs-C-reactive protein (CRP), improve significantly predictive model based on T2DM + number of multiple cardiovascular risk factors (MCRFs) >3 for decreased both angiopoetic phenotypes of circulating EPCs. In conclusion, we suggest that inflammatory biomarkers (hs-CRP, OPG) may consider statistically significant predictors for decreased EPCs labeled CD14+CD309+ and CD14+CD309+Tie2+ among dysmetabolic patients without preexisting atherosclerotic lesions of coronary arteries.
diabetes mellitus, metabolic syndrome, circulating endothelial-derived progenitor cells, cardiovascular risk factors
Metabolic syndrome (MetS) and type-2 diabetes mellitus (T2DM) are considered causality factors of cardiovascular diseases (CVD) [1,2]. MetS and T2DM frequently associate with cardiovascular risk factors and contribute endothelial dysfunction (ED), atherogenesis, oxidative stress, inflammation and coagulation [3-5]. Recent studies have been shown that T2DM patients have been demonstrated the most severe ED than MetS subjects [6]. In fact ED associates with poor clinical outcomes in patients with established CVD [7]. In this context, pathogenic factors that induce ED at the earlier stages might have a causality value for CVD progression [4].
Endothelial progenitor cells (EPCs) is a population of mononuclear cells that expresses endothelial and progenitor markers i.e. CD34+ antigen and VEGFR-2+ vascular growth ligands (Vascular Endothelial Growth Factor Rreceptor-2), CD133+, as well as CD14+, and Tie2+ (tyrosine kinase ligand) [8]. EPCs may play a pivotal role in mechanisms of tissue repair, maturation of endothelial cells, angiogenesis, and revascularization [9]. EPCs are mobilized from bone marrow and probably from peripheral tissues upon injury in result in growth factors and inflammatory cytokines over production [10]. There are evidences regarding elevated EMPs as a marker of ED [11]. Indeed, increased production of reactive oxygen species, insulin resistance, reduced NO bioavailability have been identified as mediators of tissue injury and ED [12,13]. In contrast, T2DM has well characterized as dysmetabolic state with depletion of circulating EPCs resulting in severely reduced angiogenic capacity in vivo [14]. Although decreased number and impaired functions of CD34+CD133+ EPCs in T2DM patients might lead to increased frequency of CVD events [15,16], the role of angiogenic subsets of EPCs in T2DM and MetS is still not fully understood. The aim of the study: to investigate the pattern of circulating EMPs in T2DM patients in comparison with MetS subjects in relation to inflammatory changes.
The study retrospectively evolved 101 patients (54 subjects with T2DM and 47 patients with MetS) and 35 healthy volunteers who were examined in three our centers (City Hospital # 6, Regional Center of Cardiovascular Diseases, and Regional Zaporozhye Hospital located in Zaporozhye, Ukraine) between February 2013 and November 2013.
Study included the following: 1) already diagnosed T2DM, 2) documented MetS. Following were excluded from the study: 1) patients with typical anginal symptoms, 2) subjects with evidences of preexisting coronary artery disease, i.e. myocardial infarction/ acute coronary syndrome, 3) angiographic evidence of asymptomatic coronary atherosclerosis obtained by contrast-enhanced multispiral tomography angiography provided prior study entry, 4) heart failure, 5) declined glomerular filtration rate <60 mL/min/1.73 m2, 6) candidates for insulin therapy. All the patients have given their informed written consent for participation in the study.
T2DM was diagnosed with revised criteria provided by American Diabetes Association when source documents were reviewed [17]. When one or more of the following components were found (glycated hemoglobin [HbA1c] ≥6.5%; fasting plasma glucose ≥7 mmol/L; 2-h plasma glucose ≥11.1 mmol/L during an oral glucose tolerance test; a random plasma glucose ≥11.1 mmol/L; exposure of insulin or oral antidiabetic drugs; a previous diagnosis of T2DM) T2DM was determined. MetS was diagnosed based on the National Cholesterol Education Program Adult Treatment Panel III criteria [18]. Patients were enrolled in the MetS cohort when at least three of the following components were defined: waist circumference ≥90 cm or ≥80 cm in men and women respectively; high density lipoprotein (HDL) cholesterol <1.03 mmol/l or <1.3 mmol/l in men and women respectively; triglycerides ≥1.7 mmol/l; blood pressure ≥130/85 mmHg or current exposure of antihypertensive drugs; fasting plasma glucose ≥5.6 mmol/L or previously defined as T2DM or treatment with oral antidiabetic agents or insulin. Current smoking was defined as consumption of one cigarette daily for three months. Anthropometric measurements were made using standard procedures.
No untreated subjects were enrolled. Patients with T2DM were treated with life-style modification, diet and orally taken antidiabetic drugs except sulfonylurea derivates and glitazones. Metformin in monotherapy or in combination with glinides and/ or gliptines was given in individually optimized daily doses to be achieving full or partly full control for T2DM. Therefore, insulin was not used in enrolled patients. Subjects with MetS were treated with life-style modification and diet, therefore metformin was given in 12 patients.
Methods for visualization of coronary arteries
Contrast-enhanced multispiral computed tomography angiography has been performed for all the patients with dysmetabolic disorder prior to their inclusion in the study on Optima СТ660 scanner (GE Healthcare, USA) using non-ionic contrast Omnipaque (Amersham Health, Ireland) [19]. Obtained results were interpreted by cardiologist and one of sub-investigator independently each other before study entry.
Cardiovascular risk calculation
A 10-year cardiovascular risk for study patients was calculated using the Framingham General Cardiovascular Risk Score (2008) by on-line calculator and interpreted using contemporary approaches [20].
Calculation of glomerular filtration rate
Glomerular filtration rate (GFR) was calculated with CKD-EPI formula [21].
To determine circulating biomarkers, blood samples were collected at baseline in the morning (at 7-8 a.m.) into cooled silicone test tubes wherein 2 mL of 5% Trilon B solution were added. Then they were centrifuged upon permanent cooling at 6,000 rpm for 3 minutes. Plasma was collected and refrigerated immediately to be stored at a temperature -70°С. Serum adiponectin, RANKL and osteoprotegerin (OPG) were measured by high-sensitive enzyme-linked immunosorbent assays using commercial kits (R&D Systems GmbH, Wiesbaden-Nordenstadt, Germany) according to the manufacturers’ recommendations. The inter-assay coefficients of variation were as follows: adiponectin: 5%, RANKL: 7.0%; OPG: 8.2%.
High-sensitive C-reactive protein (hs-CRP) was measured by commercially available standard kit (R&D Systems GmbH, Wiesbaden-Nordenstadt, Germany). The intra-assay and inter-assay coefficients of variation were <5%.
Serum uric acid level (SUA) was determined by enzymatic methods using a Beckman Synchron LX20 chemistry analyzer. The analytical average range for SUA was 0.5–12 mg/dL.
Fasting insulin level was measured by a double-antibody sandwich immunoassay (Elecsys 1010 analyzer, F. Hoffmann-La Roche Diagnostics, Mannheim, Germany). The intra-assay and inter-assay coefficients of variation were <5%. The lower detection limit of insulin level was 1.39 pmol/L.
Insulin resistance was assessed by the homeostasis model assessment for insulin resistance (HOMA-IR) [22] using the following formula:
HOMA-IR (mmol/L × µU/mL)=fasting glucose (mmol/L) × fasting insulin (µU/mL)/22.5
Concentrations of total cholesterol (TC) (Catalog Number 3460-06, MaxDiscovery™ Cholesterol Enzymatic Assay Kit, Bioo Scientific Corporation, USA), cholesterol of high-density lipoproteins (LDL-C) (Catalog Number DZ128A-KB1, Diazyme Europe GmbH, Germany), and cholesterol of high-density lipoproteins (HDL-C) (Catalog Number DZ129A-KY1, Diazyme Europe GmbH, Germany) were measured by enzymatic colorimetric method according standardized methodology on Beckman Synchron LX20 chemistry analyzer.
Direct Enzymatic HbA1c Assay was used for glycated hemoglobin A1c (HbA1c) measurements (Catalog Number DZ168A-K, Diazyme Europe GmbH, Germany) on Beckman Synchron LX20 chemistry analyzer.
The flow cytometric technique (FCT) was used for predictably distinguishing circulating cell subsets, which depend on expression of CD45, CD34, CD14, Tie-2, and VEGFR2, using High-Definition Fluorescence Activated Cell Sorter (HD-FACS) methodology [23]. Accordingly, the cells in question were labeled on the basis of their forward scatter characteristic (FSC) and side scatter characteristic (SSC) profiles. The cells were directly stained and analyzed for phenotypic expression of surface proteins using anti-human monoclonal antibodies, including anti-CD45 FITS (BD Biosciences, San Jose, CA, USA), anti-CD34 FITS (BD Biosciences), anti-VEGFR-2 known as anti-CD309 (BD Biosciences), anti-Tie2 (BD Biosciences) and anti-CD14 (BD Biosciences). The fluorescence minus one technique was used to provide negative controls and establish positive stain boundaries. After lysis of erythrocytes with UTILIZE wash solution, the samples were centrifuged at 200 × g for 15 min; then they were washed twice with PBS and fixed immediately. Double- or triple-positive events were determined using Boolean principles (“and”, “not”, “or”, etc.). Circulating EPCs were defined as CD34/VEGFR2 positive cells with lack of CD45 expression. From each tube 500,000 events were analyzed. For CD14+ populations, co-expression with Tie-2− and/or VEGFR-2− was determined using quadrant analysis. Standardized cell counts were presented as a percentage of the total of the white blood cells count, identified as the total number of all CD45+ cells. The representative example of immune phenotype determination of EPCs is reported in Figure 1.
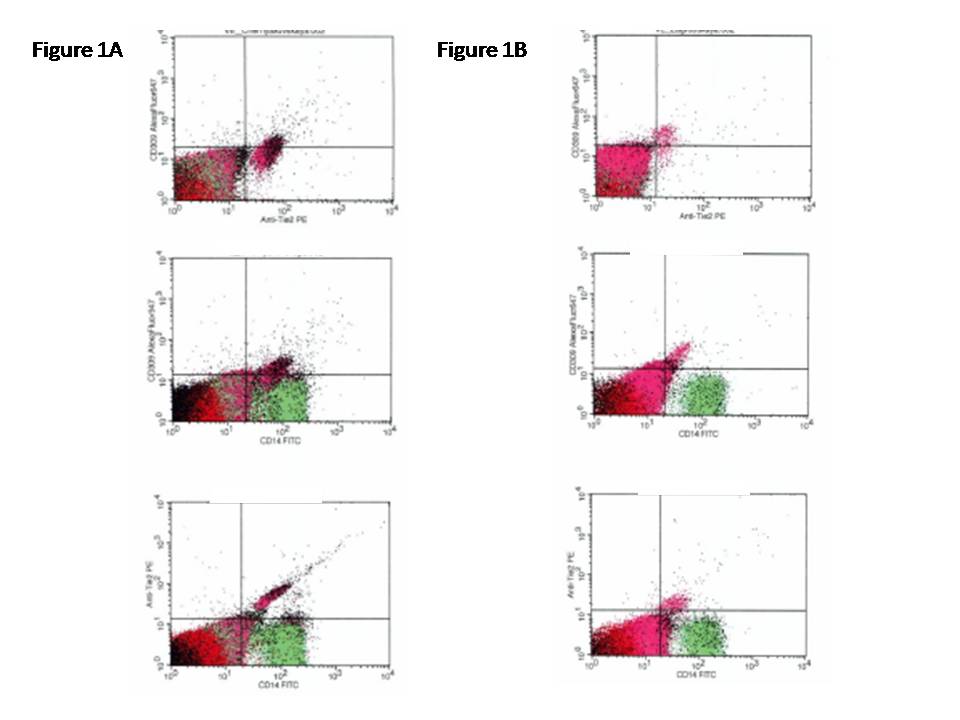
Figure 1. The representative example of immune phenotype determination of EPCs by multi-colors flow cytometric technique.
In Figure 1A, the variable expressions of the CD14+CD309+ and CD14+CD309+Tie2+ antigenes are documented in MetS patients. In Figure 1B, the variable expressions of the CD14+CD309+ and CD14+CD309+Tie2+ antigens re documented in T2DM subjects
Statistical analysis of the results obtained was performed in SPSS system for Windows, Version 22 (SPSS Inc, Chicago, IL, USA). The data were presented as mean (М) and standard deviation (±SD) or 95% confidence interval (CI); as well as median (Ме) and 25%-75% interquartile range (IQR). To compare the main parameters of patient cohorts, two-tailed Student t-test or Mann-Whitney U-test were used. To compare categorical variables between groups, Chi2 test (χ2) and Fisher F exact test were used. Predictors of depleted EPCs in patients were examined in multivariable regression analysis. A two-tailed probability value of <0.05 was considered as significant.
general characteristic of patients participating in the study was reported in Table 1. The mean age for patients with dysmetabolic disorder and healthy volunteers was 48.34 years and 46.12 years (P=0.68). Therefore 63.3% of dysmetabolic disorder patients and 65.7% of healthy volunteers were men (P=0.86). As expected, there was a significant difference between healthy volunteers and entire cohort of enrolled patients in BMI, waist circumference, cardiovascular risk factors (hypertension, dyslipidemia, adherence to smoking), HOMA-IR, lipid abnormalities, and Framingham risk score. HbA1c, fasting blood glucose, insulin, hs-CRP, TG, sRANKL, osteoprotegerin, and adiponectin were higher in patient cohort when compared with healthy volunteers. Therefore, no significant increase in circulating CD34+ subset cells (CD45+CD34+ and CD45−CD34+) in dysmetabolic patients when compared with healthy volunteers was found. The authors suppose that there are decreased CD14+ subsets of EPCs in dysmetabolic subjects. Indeed, there is a significant difference between the medians of absolute numbers and frequencies of CD14+CD309+ and CD14+CD309+Tie2+ in healthy volunteers and patients with dysmetabolic disorders respectively.
Table 1. general characteristic of patients participating in the study
|
Healthy volunteers (n=35) |
Entire cohort of enrolled patients (n=101) |
P value |
Age, years |
46.12 ± 4.22 |
48.34 ± 7.80 |
0.68 |
males, n (%) |
23 (65.7%) |
64 (63.3%) |
0.86 |
BMI, kg/m2 |
21.5 (25-75% IQR=16.1–23.5) |
28.7 (25-75% IQR 16.5–32.4) |
0.001 |
Waist circumference, sm |
78 (25-75% IQR=63–89) |
91 (25-75% IQR=71–103) |
0.001 |
Hypertension, n (%) |
- |
68 (67.3%) |
0.001 |
Dyslipidemia, n (%) |
- |
59 (58.4%) |
0.001 |
T2DM, n (%) |
- |
54 (53.5%) |
0.001 |
MetS, n (%) |
- |
47 (46.5%) |
0.001 |
Adherence to smoking, n (%) |
6 (17.1%) |
31 (30.7%) |
0.001 |
Framingham risk score |
2.55 ± 1.05 |
8.12 ± 2.88 |
0.001 |
Systolic BP, mm Hg |
122 ± 5 |
136 ± 6 |
0.001 |
Diastolic BP, mm Hg |
72 ± 4 |
86 ± 6 |
0.001 |
Heart rate, beats per 1 min. |
66 ± 6 |
72 ± 7 |
0.01 |
GFR, mL/min/1.73 m2 |
102.1 (95% CI=91.4–113.2) |
93.1 (95% CI=79.5–109.7) |
0.12 |
HbA1c, % |
4.75 (95% CI=4.36-5.12) |
7.0 (95% CI=4.3-9.2) |
0.001 |
fasting blood glucose, mmol/L |
4.52 (95% CI=4.43-4.76) |
5.40 (95% CI=3.4-9.1) |
0.01 |
Insulin, µU/mL |
4.98 (25-75% IQR=1.5–14.1) |
15.15 (25-75% IQR=13.69-16.62) |
0.001 |
HOMA-IR, mmol/L × µU/mL |
1.01 (25-75% IQR=0.91-1.07) |
3.83 (25-75% IQR=3.47-4.20) |
0.001 |
creatinine, μmol/L |
62.1 (95% CI=55.7–82.4) |
70.5 (95% CI=59.6–88.3) |
0.24 |
Total cholesterol, mmol/L |
4.76 (95% CI=4.21-5.05) |
5.3 (95% CI=4.6-6.0) |
0.001 |
LDL-C, mmol/L |
3.10 (95% CI=2.78–3.21) |
3.60 (95% CI=3.20–4.18) |
0.001 |
HDL-C, mmol/L |
1.13 (95% CI=1.05–1.17) |
0.94 (95% CI=0.92–1.06) |
0.001 |
TG, mmol/L |
1,18 (95% CI=1.07–1.30) |
1,68 (95% CI=1.44–1.98) |
0.001 |
SUA, mmol/L |
17.1 (95% CI=9.1–25.7) |
23.8 (95% CI=15.8–31.3) |
0.05 |
hs-CRP, mg / L |
4.11 (25-75% IQR=0.97 – 5.03) |
7.96 (25-75% IQR=4.72 – 9.34) |
0.001 |
sRANKL, pg / mL |
16.10 (25-75% IQR=2.1-30.1) |
25.80 (25-75% IQR=15.2-46.5) |
0.002 |
Osteoprotegerin, pg / mL |
88.3 (25-75% IQR=37.5-136.6) |
725.9 (25-75% IQR=579.9-871.9) |
0.001 |
Adiponectin, mg / L |
6.17 (25-75% IQR=3.44-10.15) |
13.65 (25-75% IQR=10.12-24.93) |
0.001 |
CD45+CD34+, % |
1.90 (25-75% IQR=1.49–2.10) |
2.10 (25-75% IQR=1.70–2.35) |
0.66 |
CD45+CD34+, cells × 103/μL |
0.114 (25-75% IQR=0.095–0.120) |
0.112 (25-75% IQR=0.090–0.121) |
0.76 |
CD45−CD34+ × 10−4, % |
1.00 (25-75% IQR=0.69–1.35) |
1.02 (25-75% IQR=0.86–1.28) |
0.84 |
CD45−CD34+, cells × 10−1/μL |
0.06 (25-75% IQR=0.05–0.07) |
0.057 (25-75% IQR=0.053–0.067) |
0.86 |
CD14+CD309+ × 10−4, % |
71.00 (25-75% IQR=61.50–96.00) |
57.00 (25-75% IQR=43.20–81.50) |
0.02 |
CD14+CD309+, cells × 10−1/μL |
4.26 (25-75% IQR=3.70–5.74) |
2.96 (25-75% IQR=2.25–4.21) |
0.01 |
CD14+CD309+Tie2+ × 10−4, % |
7.70 (25-75% IQR=4.20–12.20) |
5.50 (25-75% IQR=3.05–8.15) |
0.04 |
CD14+CD309+Tie2+, cells × 10−1/μL |
0.465 (25-75% IQR=0.253–0.710) |
0.270 (25-75% IQR=0.241–0.411) |
0.01 |
Note: Data are presented as mean and ±SE or 95% CI; median and 25-75% IQR. Categorical variables are expressed as numerous (n) and percentages (%). P-value is a comparison of mean or median variables between both cohorts (ANOVA test).
Abbreviations: CI – confidence interval; IQR – inter quartile range; BMI - Body mass index, T2DM – type two diabetes mellitus, TG – triglycerides, BP – blood pressure, BMI - Body mass index, GFR - glomerular filtration rate, EMPs – endothelial-derived microparticles; HDL-C - high-density lipoprotein cholesterol, LDL-C - Low-density lipoprotein cholesterol, hs-CRP – high sensitive C reactive protein, sRANKL – serum receptor activator of NF-κB ligand.
According to Table 2, patients with MetS have demonstrated lower incidence of dyslipidemia, lower concentrations of HbA1c, fasting blood glucose, insulin, and LDL-C when compared with T2DM subjects. Higher HDL-C and HOMA-IR were found in T2DM patients than in MetS subjects. Interestingly, similarities of circulating levels of EPCs different origin were determined in both cohorts apart from absolute numerous of CD14+CD309+ and CD14+CD309+Tie2+ EPCs. CD14+CD309+ and CD14+CD309+Tie2+ subsets of circulating EPCs were determined in higher concentration among MetS subjects in comparison with T2DM patients (P=0.18 and P=0.012 respectively).
Table 2. Demographic, risk factors, blood pressure, circulating biomarkers, and endothelial-derived microparticles in MetS and T2DM patients
|
MetS patients (n=47) |
T2DM patients (n=54) |
P value |
Age, years |
48.30 ± 3.94 |
48.50 ± 6.60 |
0.88 |
males, n (%) |
30 (63.8%) |
34 (63.0%) |
0.96 |
BMI, kg/m2 |
28.2 (25-75% IQR=16.7–31.0) |
28.5 (25-75% IQR=16.8–32.1) |
0.92 |
Waist circumference, sm |
92 (25-75% IQR=69–105) |
89 (25-75% IQR=72–100) |
0.12 |
Hypertension, n (%) |
32 (68.0%) |
36 (66.7%) |
0.78 |
Dyslipidemia, n (%) |
26 (55.3%) |
33 (61.1%) |
0. 026 |
Adherence to smoking, n (%) |
16 (34.0%) |
15 (27.7%) |
0.44 |
Framingham risk score |
8.09 ± 2.12 |
8.18 ± 2.32 |
0.78 |
Systolic BP, mm Hg |
137 ± 4 |
136 ± 5 |
0.94 |
Diastolic BP, mm Hg |
87 ± 5 |
86 ± 4 |
0.96 |
Heart rate, beats per 1 min. |
71 ± 6 |
72 ± 5 |
0.96 |
GFR, mL/min/1.73 m2 |
92.5 (95% CI=83.1–107.4) |
93.8 (95% CI=80.4–106.8) |
0.92 |
HbA1c, % |
6.82 (95% CI=4.61-5.37) |
7.3 (95% CI=4.3-9.1) |
0.036 |
fasting blood glucose, mmol/L |
5.46 (95% CI=4.23-4.76) |
5.54 (95% CI=4.49-9.0) |
0.042 |
Insulin, µU/mL |
14.2 (25-75% IQR=12.5–15.7) |
15.6 (25-75% IQR=12.9-16.8) |
0.048 |
HOMA-IR, mmol/L × µU/mL |
3.45 (25-75% IQR=3.22-3.78) |
3.86 (25-75% IQR=3.41-4.10) |
0.012 |
creatinine, μmol/L |
72.3 (95% CI=56.1–86.9) |
71.2 (95% CI=59.9–87.2) |
0.94 |
Total cholesterol, mmol/L |
5.3 (95% CI=4.5-5.9) |
5.4 (95% CI=4.8-5.8) |
0.96 |
LDL-C, mmol/L |
3.48 (95% CI=3.30–4.07) |
3.80 (95% CI=3.20–4.20) |
0.012 |
HDL-C, mmol/L |
1.01 (95% CI=0.90–1.13) |
0.94 (95% CI=0.88–1.04) |
0.014 |
TG, mmol/L |
1.77 (95% CI=1.62–1.95) |
1.45 (95% CI=1.42–1.51) |
0.044 |
SUA, mmol/L |
23.1 (95% CI=16.2–29.7) |
23.9 (95% CI=15.9–30.1) |
0.86 |
hs-CRP, mg / L |
7.87 (25-75% IQR=4.92 – 9.43) |
8.10 (25-75% IQR=4.80 – 9.54) |
0.24 |
sRANKL, pg / mL |
24.10 (25-75% IQR=14.7-36.9) |
26.20 (25-75% IQR=15.3-40.7) |
0.26 |
Osteoprotegerin, pg / mL |
718.5 (25-75% IQR=572.1-846.2) |
732.1 (25-75% IQR=587.5-866.3) |
0.38 |
Adiponectin, mg / L |
13.61 (25-75% IQR=9.74-22.35) |
14.12 (25-75% IQR=10.12-23.10) |
0.88 |
CD45+CD34+, % |
2.11 (25-75% IQR=1.72–2.28) |
2.06 (25-75% IQR=1.73–2.25) |
0.86 |
CD45+CD34+, cells × 103/μL |
0.114 (25-75% IQR=0.094–0.122) |
0.109 (25-75% IQR=0.091–0.117) |
0.56 |
CD45−CD34+ × 10−4, % |
1.02 (25-75% IQR=0.89–1.25) |
1.01 (25-75% IQR=0.88–1.22) |
0.88 |
CD45−CD34+, cells × 10−1/μL |
0.060 (25-75% IQR=0.055–0.066) |
0.056 (25-75% IQR=0.052–0.064) |
0.82 |
CD14+CD309+ × 10−4, % |
59.12 (25-75% IQR=48.10–82.30) |
52.37 (25-75% IQR=44.60–76.20) |
0.054 |
CD14+CD309+, cells × 10−1/μL |
3.35 (25-75% IQR=2.57–4.18) |
2.71 (25-75% IQR=2.31–3.52) |
0.018 |
CD14+CD309+Tie2+ × 10−4, % |
6.03 (25-75% IQR=3.42–8.05) |
4.95 (25-75% IQR=3.14–7.44) |
0.052 |
CD14+CD309+Tie2+, cells × 10−1/μL |
0.294 (25-75% IQR=0.245–0.396) |
0.253 (25-75% IQR=0.232–0.311) |
0.012 |
Note: Data are presented as mean and ±SE or 95% CI; median and 25-75% IQR. Categorical variables are expressed as numerous (n) and percentages (%). P-value is a comparison of mean or median variables between both cohorts (ANOVA test).
Abbreviations: CI – confidence interval; IQR – inter quartile range; BMI - Body mass index, T2DM – type two diabetes mellitus, BP – blood pressure, BMI - Body mass index, GFR - glomerular filtration rate, EPCs – endothelial progenitor cells; TG – triglycerides, HDL-C - high-density lipoprotein cholesterol, LDL-C - Low-density lipoprotein cholesterol, hs-CRP – high sensitive C reactive protein, sRANKL – serum receptor activator of NF-κB ligand.
The univariate linear correlations between both absolute numerous of EPCs with immune phenotypes labelled CD14+CD309+ and CD14+CD309+Tie2+, cardiovascular risk factors, hemodynamic performances, and other biomarkers were evaluated. The data have shown that absolute numerous of CD14+CD309+ were inversely related with T2DM (r=-0.542, P=0.003), BMI (r=-0.54, P=0.001), OPG (r=-0.518, P=0.001), number of multiple cardiovascular risk factors (MCRFs) (r=-0.486, P=0.001), hs-CRP (r=-0.478, P=0.001), sRANKL (r=-0.477, P=0.001), adiponectin (r=-0.402, P=0.001), eGFR (r=-0.398, P=0.001), Framingham risk score (r=-0.394, P=0.001), TG (r=-0.392, P=0.001), creatinine (r=-0.387, P=0.001), SUA (r=-0.315, P<0.001), gender (r=-0.318, P<0.001 for male), dyslipidemia (r=-0.313, P=0.001), age (r=-0.275, P=0.001), smoking (r=-0.212, P=0.001), and positively related with HOMA-IR (r=0.465, P=0.001).
Therefore, absolute numerous of CD14+CD309+Tie2+ EPCs were negatively related T2DM (r=-0.55, P=0.001), OPG (r=-0.522, P=0.001), number of MCRFs (r=-0.492, P=0.001), hs-CRP (r=-0.486, P=0.001), BMI (r=-0.483, P=0.001), adiponectin (r=-0.472, P=0.001), sRANKL (r=-0.466, P=0.001), TG (r=-0.412, P=0.001), eGFR (r=-0.392, P=0.001), Framingham risk score (r=-0.39, P=0.001), creatinine (r=-0.365, P=0.001), dyslipidemia (r=-0.322, P=0.001), SUA (r=-0.309, P<0.001), gender (r=-0.303, P<0.001 for male), age (r=-0.262, P=0.001), smoking (r=-0.211, P=0.001), and positively related with HOMA-IR (r=0.482, P=0.001). No significant association of absolute numerous of CD14+CD309+ and CD14+CD309+Tie2+ EPCs with fasting plasma glucose, HbA1c, number of MetS components, means of systolic and diastolic BP, waist circumference was found. We did not find possible age- and gender-related correlation between metabolic status and the presence of EPCs.
Using multivariate age- and gender-adjusted logistic regression analysis, independent impact of T2DM (odds ratio [OR]=1.08, P=0.003), hs-CRP per 4.50 mg/L (OR=1.12, P=0.001), OPG per 125.5 pg/mL (OR=1.14, P=0.001), number of MCRFs >3 (OR=1.15, P=0.001), HOMA-IR per 0.65 mmol/L × µU/mL (OR=1.04, P=0.001) on decreased of CD14+CD309+ EPCs was determined (Table 3). Therefore, CD14+CD309+Tie2+ EPCs were prone negatively impact by T2DM (OR=1.10, P=0.001), hs-CRP per 4.50 mg/L (OR=1.12, P=0.001), number of MCRFs >3 (OR=1.17, P=0.001), OPG per 125.5 pg/mL (OR=1.11, P=0.001), and HOMA-IR per 0.65 mmol/L × µU/mL (OR=1.06, P=0.001).
Table 3. The independent predictors of depletion of circulating EPCs. The results of age- and gender-adjusted multivariate logistic regression analysis
Factors |
CD14+CD309+ EPCs |
CD14+CD309+Tie2+ EPCs |
OR (95% CI) |
P Value |
OR (95% CI) |
P Value |
Hypertension (present vs. abcent ) |
0.99 (0.87–1.04) |
0.001 |
1.05 (0.97–1.11) |
0.001 |
Dyslipidemia (present vs abcent ) |
1.04 (0.92–1.22) |
0.001 |
1.02 (0.96–1.15) |
0.001 |
T2DM (present vs. abcent ) |
1.08 (1.04–1.12) |
0.003 |
1.10 (1.02–1.20) |
0.001 |
BMI per 5.0 kg/m2 |
1.05 (0.97–1.18) |
0.001 |
1.05 (0.95–1.07) |
0.002 |
hs-CRP per 4.50 mg/L |
1.12 (1.03–1.20) |
0.001 |
1.12 (1.06–1.24) |
0.001 |
Number of MCRFs >3 |
1.15 (1.07–1.30) |
0.001 |
1.17 (1.11–1.22) |
0.001 |
TC per 0.65 mmol/L |
1.03 (0.88–1.10) |
0.002 |
1.01 (0.98–1.10) |
0.001 |
SUA per 4.5 mmol/L |
1.02 (0.94–1.14) |
0.001 |
1.04 (0.96–1.10) |
0.002 |
OPG per 125.5 pg / mL |
1.14 (1.07–1.26) |
0.002 |
1.11 (1.08–1.21) |
0.001 |
Adiponectin, per 9.5 mg/L |
1.02 (0.99–1.04) |
0.002 |
1.01 (0.98–1.05) |
0.001 |
HOMA-IR per 0.65 mmol/L × µU/mL |
1.04 (1.00–1.06) |
0.001 |
1.06 (1.02–1.07) |
0.001 |
sRANKL per 12.5 pg / mL |
1.03 (0.98–1.07) |
0.001 |
1.02 (0.99–1.04) |
0.002 |
Abbreviations: CI – confidence interval; IQR – inter quartile range; BMI - Body mass index, T2DM – type two diabetes mellitus, BMI - Body mass index, EPCs - endothelial progenitor cells; TG – triglycerides, hs-CRP – high sensitive C reactive protein, sRANKL – serum receptor activator of NF-κB ligand, MCRFs—multiple cardiovascular risk factors.
The results of our study demonstrate that depletion of circulating EPC number with angiopoetic capacity labeled CD14+CD309+ and CD14+CD309+Tie2+ was defined among dysmetabolic patients. Moreover, circulating level of CD14+CD309+ and CD14+CD309+Tie2+ EPCs was significant lower in T2DM persons when compared with MetS patients. Therefore, inflammatory cytokines i.e. OPG and hs-CRP appeared significant association with decreased CD14+CD309+ and CD14+CD309+Tie2+ EPC subsets among dysmetabolic subjects. We suggest that low-intensity inflammation that is common in dysmetabolic person population may impact negatively on CVD development through worse of endothelial reparation process that is realized by recruitment of EPCs with angiopoetic activity.
Recent studies have shown a closely association of serum levels of OPG and hs-CRP with T2DM [24,25]. Indeed, OPG is considered a candidate for biomarker, which modulating vascular remodeling effects and CVD development and progression [26]. In fact, OPG is over expressed on endothelial and smooth muscle cells in vasculature in dysmetabolic states [27]. Moreover, epidemiological studies have examined the relations of OPG to CVD events and mortality [28-31]. Strong associations of hs-CRP with components of MetS, T2DM, other inflammatory cytokine levels, as well as CVD events were found in several investigations [32-34]. Higher level of OPG and hs-CRP in MetS and T2DM reflected chronic low grade inflammation possibly mediates the development of diabetic complications and clinical CVD outcomes through ED [35]. ED may be realized as result in altered endothelial cell activity and endothelial integrity due to dysregulation of vascular wall repair processes [36] mediatied angiogenic EPCs [37]. Indeed, there are evidences that decreased number and/ or functionally impaired EPCs are one of the major risk factors for the development of micro vascular complications in dysmetabolic patients [38].
Results of the presented study have shown that increased circulating level of inflammatory cytokines in T2DM patients may lead to more much deficiency of angiogenic EPCs when compared with MetS, while frequencies and absolute numbers of other immune phenotype EPCs may be comparable. Probably, OPG and hs-CRP seems to be determinant for depleted circulating EPCs levels and relates a progress from MetS and prediabetes to T2DM. Interestingly, that glycemic control, BMI, insulin resistance were not defined as independent predictors for decreased CD14+CD309+ and CD14+CD309+Tie2+ EPCs in dysmetabolic patients, but T2DM, numbers of CVD risk factors, OPG and hs-CRP were determined. These data sort with opinion provided by investigators regarding EPCs as a potential novel marker of vascular integrity, homeostasis process, metabolic abnormalities, and cardiovascular risk [39,40]. As it has been postulated, the reduction and dysfunction of EPCs associates with inflammatory-dependent impairment of vascular function and relates to progress from MetS to T2DM. Overall, these results suggest that vascular reparative dysfunction associated with OPG and hs-CRP over production among T2DM subjects without preexisting atherosclerotic lesions of coronary arteries is superior to MetS patients.
Decreased numbers of circulating EPCs with angiopoetic immune phenotypes labeled CD14+CD309+ and CD14+CD309+Tie2+ among dysmetabolic patients without preexisting atherosclerotic lesions of coronary arteries may probably discuss as surrogate marker of endothelial integrity and endothelial dysfunction at early stages. Future clinical studies might focus on significance of interrelationship between disproportion in angiopoetic immune phenotypes of EPCs and severity of endothelial dysfunction among MetS and T2DM patients. We suggest that decreased numbers of circulating angiopoetic EPCs may have predicted value for cardiovascular events and outcomes in this patient population. Therefore, it has been postulated that serial measurements of circulating angiopoetic EPCs in MetS and T2DM patients may be useful for biomarker-guided therapy targeted on prevention of cardiovascular events in dysmetabolic subjects.
This study has some limitations. It is necessary to note that a large pool of nanoparticles might be produced after blood sampling due to destruction of platelets and blood cells. Therefore, preparation of isolates of microparticles in samples is the most sophisticated step for further examination. Venous citrated blood drawn from the fistula-free arm was performed obligatorily. We believe that these risks are systemic, and to minimize them, we refused to freeze the blood samples before measurement of microparticles. Additionally, retrospective, relative small sample size may limit the significance of the present study. The authors believe that a greater cohort of patients with more incidences detected is desirable to improve the credibility of the study.
In conclusion, we suggest that inflammatory biomarkers (hs-CRP, OPG) may consider statistically significant predictors for decreased both angiopoetic phenotypes of circulating EPCs labeled CD14+CD309+ and CD14+CD309+Tie2+ among dysmetabolic patients without preexisting known atherosclerotic lesions of coronary arteries.
We thank all patients for their participation in the investigation, staff of the Regional Zaporozhye Hospital (Ukraine), and the doctors, nurses, and administrative staff in Regional Center of Cardiovascular Diseases (Zaporozhye, Ukraine) and City Hospital # 6 (Zaporozhye, Ukraine), general practices, and site-managed organizations that assisted with the study.
Ethical principles
All the patients have given their voluntary written informed consent for participation in the study. The study was approved by the local ethics committee of State Medical University, Zaporozhye, Ukraine. The study was performed in conformity with the Declaration of Helsinki.
Conflict of interests
not declared
Alexander E Berezin initiated the hypothesis and designed the study protocol, contributed to collect, analyze and interpret the data, including results of contrast-enhanced multispiral computed tomography angiography, performed statistical analysis, wrote the manuscript and approved final version of the paper. Alexander A. Kremzer contributed to enroll the patients; interpreted data of contrast-enhanced multispiral computed tomography angiography, collected and analyzed the data reviewed the source documents. Tatyana A. Berezina contributed to enroll the patients in the study and collect the data. Martovitskaya YuV contributed in performing of cytofluometry and interpretation of the obtained results.
- Nichols GA, Schroeder EB, Karter AJ, Gregg EW, Desai J, et al. (2015) Trends in diabetes incidence among 7 million insured adults, 2006-2011: the SUPREME-DM project. Am J Epidemiol 181: 32-39.
- Szczerbinska K, Topinková E, Brzyski P, van der Roest HG, Richter T, Finne-Soveri H, et al. The Characteristics of Diabetic Residents in European Nursing Homes: Results from the SHELTER Study. J Am Med Dir Assoc. 2014. pii: S1525-8610(14)00756-7. doi: 10.1016/j.jamda.2014.11.009. [Epub ahead of print].
- López-Jaramillo P, Gómez-Arbeláez D, López-López J, López-López C, Martínez-Ortega J, Gómez-Rodríguez A, et al. The role of leptin/adiponectin ratio in metabolic syndrome and diabetes. Horm Mol Biol Clin Investig. 2014; 18(1): 37-45.
- Prieto D, Contreras C, Sánchez A1 (2014) Endothelial dysfunction, obesity and insulin resistance. Curr Vasc Pharmacol 12: 412-426.
- Kaur J1 (2014) A co2021 Copyright OAT. All rights reservome. Cardiol Res Pract 2014: 943162.
- Walther G, Obert P, Dutheil F, Chapier R, Lesourd B, Naughton G, et al. Metabolic Syndrome Individuals With and Without Type 2 Diabetes Mellitus Present Generalized Vascular Dysfunction: Cross-Sectional Study. Arterioscler Thromb Vasc Biol. 2015. pii: ATVBAHA.114.304591. [Epub ahead of print]
- Polovina MM, Potpara TS (2014) Endothelial dysfunction in metabolic and vascular disorders. Postgrad Med 126: 38-53.
- Kotlinowski J, Dulak J, Józkowicz A1 (2013) [Type 2 diabetes mellitus impairs endothelial progenitor cells functions]. Postepy Biochem 59: 257-266.
- Kuliszewski MA, Ward MR, Kowalewski JW, Smith AH, Stewart DJ, et al. (2013) A direct comparison of endothelial progenitor cell dysfunction in rat metabolic syndrome and diabetes. Atherosclerosis 226: 58-66.
- Bettencourt N, Oliveira S, Toschke AM, Rocha J, Leite D, Carvalho M, et al. Predictors of circulating endothelial progenitor cell levels in patients without known coronary artery disease referred for multidetector computed tomography coronary angiography. Rev Port Cardiol. 2011; 30(10):753-60.
- Humpert PM, Eichler H, Lammert A, Hammes HP, Nawroth PP, et al. (2005) Adult vascular progenitor cells and tissue regeneration in metabolic syndrome. Vasa 34: 73-78, 80.
- Cubbon RM, Kahn MB, Wheatcroft SB (2009) Effects of insulin resistance on endothelial progenitor cells and vascular repair. Clin Sci (Lond) 117: 173-190.
- Berezin AE, Kremzer AA. Analysis of Various Subsets of Circulating Mononuclear Cells in Asymptomatic Coronary Artery Disease. J. Clin. Med. 2013; 2: 32-44.
- Steinmetz M, Nickenig G, Werner N (2010) Endothelial-regenerating cells: an expanding universe. Hypertension 55: 593-599.
- Di Stefano R, Felice F, Feriani R, Balbarini A (2013) Endothelial progenitor cells, cardiovascular risk factors and lifestyle modifications. Intern Emerg Med 8 Suppl 1: S47-49.
- António N, Fernandes R, Soares A, Soares F, Lopes A, et al. (2014) Reduced levels of circulating endothelial progenitor cells in acute myocardial infarction patients with diabetes or pre-diabetes: accompanying the glycemic continuum. Cardiovasc Diabetol 13: 101.
- American Diabetes Association (2015) Standards of medical care in diabetes-2015 abridged for primary care providers. Clin Diabetes 33: 97-111.
- National Cholesterol Education Program (NCEP) Expert Panel on Detection, Evaluation, and Treatment of High Blood Cholesterol in Adults (Adult Treatment Panel III). Third Report of the National Cholesterol Education Program (NCEP) Expert Panel on Detection, Evaluation, and Treatment of High Blood Cholesterol in Adults (Adult Treatment Panel III) final report. Circulation. 2002; 106(25): 3143-421.
- Bluemke DA, Achenbach S, Budoff M, Gerber TC, Gersh B, Hillis LD, et al. Noninvasive coronary artery imaging: magnetic resonance angiography and multidetector computed tomography angiography: a scientific statement from the American Heart Association Committee on Cardiovascular Imaging and Intervention of the Council on Cardiovascular Radiology and Intervention, and the Councils on Clinical Cardiology and Cardiovascular Disease in the Young. Circulation. 2008; 118: 586-606
- Preiss D, Kristensen SL2 (2015) The New Pooled Cohort Equations Risk Calculator. Can J Cardiol 31: 613-619.
- Levey AS, Stevens LA, Schmid CH, Zhang YL, Castro AF 3rd, et al. (2009) A new equation to estimate glomerular filtration rate. Ann Intern Med 150: 604-612.
- Matthews DR, Hosker JP, Rudenski AS, Naylor BA, Treacher DF, et al. (1985) Homeostasis model assessment: insulin resistance and beta-cell function from fasting plasma glucose and insulin concentrations in man. Diabetologia 28: 412-419.
- Tung JW, Parks DR, Moore WA, Herzenberg LA, Herzenberg LA (2004) New approaches to fluorescence compensation and visualization of FACS data. Clin Immunol 110: 277-283.
- Browner WS, Lui LY, Cummings SR (2001) Associations of serum osteoprotegerin levels with diabetes, stroke, bone density, fractures, and mortality in elderly women. J Clin Endocrinol Metab 86: 631-637.
- Pradhan AD, Manson JE, Rifai N, Buring JE, Ridker PM (2001) C-reactive protein, interleukin 6, and risk of developing type 2 diabetes mellitus. JAMA 286: 327-334.
- Lieb W, Gona P, Larson MG, Massaro JM, Lipinska I, Keaney JF Jr et al. Biomarkers of the osteoprotegerin pathway: clinical correlates, subclinical disease, incident CVD and mortality. Arterioscler Thromb Vasc Biol. 2010; 30(9): 1849–1854.
- Malyankar UM, Scatena M, Suchland KL, Yun TJ, Clark EA, et al. (2000) Osteoprotegerin is an alpha vbeta 3-induced, NF-kappa B-dependent survival factor for endothelial cells. J Biol Chem 275: 20959-20962.
- Jono S, Ikari Y, Shioi A, Mori K, Miki T, et al. (2002) Serum osteoprotegerin levels are associated with the presence and severity of coronary artery disease. Circulation 106: 1192-1194.
- Kiechl S, Schett G, Wenning G, Redlich K, Oberhollenzer M, et al. (2004) Osteoprotegerin is a risk factor for progressive atherosclerosis and cardiovascular disease. Circulation 109: 2175-2180.
- Semb AG, Ueland T, Aukrust P, Wareham NJ, Luben R, Gullestad L, et al. Osteoprotegerin and soluble receptor activator of nuclear factor-kappaB ligand and risk for coronary events: a nested case-control approach in the prospective EPIC-Norfolk population study 1993–2003. Arterioscler Thromb Vasc Biol 2009; 29(6): 975–80.
- Ridker PM, Buring JE, Cook NR, Rifai N (2003) C-reactive protein, the metabolic syndrome, and risk of incident cardiovascular events: an 8-year follow-up of 14 719 initially healthy American women. Circulation 107: 391-397.
- Hoseini SM, Kalantari A, Afarideh M, Noshad S, Behdadnia A, Nakhjavani M, et al. Evaluation of plasma MMP-8, MMP-9 and TIMP-1 identifies candidate cardiometabolic risk marker in metabolic syndrome: results from double-blinded nested case-control study. Metabolism. 2014. pii: S0026-0495(14)00407-7.
- Dandona P, Aljada A, Bandyopadhyay A (2004) Inflammation: the link between insulin resistance, obesity and diabetes. Trends Immunol 25: 4-7.
- Walther G, Obert P, Dutheil F, Chapier R, Lesourd B, Naughton G, et al. Metabolic Syndrome Individuals With and Without Type 2 Diabetes Mellitus Present Generalized Vascular Dysfunction: Cross-Sectional Study. Arterioscler Thromb Vasc Biol. 2015. pii: ATVBAHA.114.304591. [Epub ahead of print]
- Saboor M, Moinuddin, Ajmal M, Ilyas S (2014) Functional status of vascular endothelium in diabetes mellitus. J Ayub Med Coll Abbottabad 26: 239-243.
- Kim KA, Shin YJ, Akram M, Kim ES, Choi KW, Suh H, et al. High glucose condition induces autophagy in endothelial progenitor cells contributing to angiogenic impairment. Biol Pharm Bull. 2014; 37(7): 1248-52.
- António N, Fernandes R, Soares A, Soares F, Lopes A, et al. (2014) Reduced levels of circulating endothelial progenitor cells in acute myocardial infarction patients with diabetes or pre-diabetes: accompanying the glycemic continuum. Cardiovasc Diabetol 13: 101.
- Angelidi A, Melidonis A, Protopsaltis I, Sergentanis TN2, Gritzapis A3, et al. (2014) Endothelial progenitor cells as a cardiometabolic risk factor marker in prediabetes. Hormones (Athens) 13: 244-251.
- Yiu KH, Tse HF2 (2014) Specific role of impaired glucose metabolism and diabetes mellitus in endothelial progenitor cell characteristics and function. Arterioscler Thromb Vasc Biol 34: 1136-1143.