Abstract
Three potential outbreaks of an infectious-like agent are documented within 230very small area geographies called mid and lower super output areas (MSOA, LSOA) in Wigan on the outskirts of greater Manchester in the UK, using a method which detects step-like increases in medical admissions. These events could be more correctly described as rectangular waves which show spatiotemporal spread. The events are clustered around the years 2008, 2010 and 2012, and in the small areas the effect of each event endures for a period of around 12 months before eventually abating, i.e. the rectangular wave effect. All admissions occur at the Wigan Royal Infirmary (precluding hospital admission threshold effects), and the majority of admissions are for residents of the Wigan local authority (roughly 16 x 12 km), which is covered by a single primary care organization (PCO) - precluding PCO, social care policy, funding and management effects. The small size of the Wigan area precludes effects due to the weather or environment. The timing and magnitude of the 2010 event was investigated in detail, while the date and magnitude of the largest event in each MSOA/LSOA between 2008 and 2013 was also documented. For small areas with an average of 100 medical admissions per annum, the maximum step-increase ranges from +10% to +100%, which is outside of the 85% confidence interval for Poisson-based variation. The magnitude of the increase is independent of deprivation and population density, but shows evidence of an effect due to age. These results confirm the results for other small area studies conducted elsewhere in the UK, and point to the existence of a major new type of infectious event.
Key words
medical admissions, inflammation, emerging infectious diseases, England, Wigan borough, cytomegalovirus, small area epidemiologic studies, moving rectangular wave, spatiotemporal studies
Introduction
As of 2005 there were 1,407 species of known human pathogens [1]. New viruses are being discovered at around two per year, and around 100 to 560 are estimated to be yet discovered [2]. Studies between 2001 and 2007 using 16S ribosome DNA analysis discovered 15 new bacterial genera and 215 new species [3], while a single study between 2006 and 2010 in Utah (USA) using clinical specimens discovered a further 111 novel genera and 673 novel species [4]. Humans are exposed to multiple pathogens, and a study of Mexican Americans found that that over 55% of persons had antigens against eight or more of 13 common pathogens [5], many of which create persistent infections [6].
Simultaneous exposure to multiple pathogens has been called the ‘pathogen burden’, and a number of common diseases appear to have increased incidence or severity as the pathogen burden increases [7-11]. Within this context, it should not be a surprise if novel types of disease outbreaks begin to be characterized which will exhibit complex patterns of spread. For example, a relatively difficult to transmit pathogen (with multiple strains) which evokes a respiratory phase during (re)infection, may be expected to show mixed slow/burst spatial spread [12].
The availability of computerized hospital admission data in England from the early 1990’s onward, has allowed the identification of one such novel series of infectious-like events which are specific to a particular set of medical conditions apparently linked to infection, inflammation and autoimmunity [13-16]. Analysis of increased deaths associated with these events indicates that they appear to stretch back to the 1950’s with around two events per decade, although a four-in-a-row series occurred in the 1990’s at roughly three year intervals, and another four-in-a-row series occurred between 2008 and 2014 at two year intervals [17-19]. Increased deaths, medical admissions, emergency department attendances, NHS staff sickness absence and general practitioner referrals all show spatiotemporal spread during these infectious-like events [19-27], with full spatial spread across the UK appearing to take around two years while spread between the small areas which constitute a local authority take around 18 months [17-27].
This study analyzes very small area data covering the more recent 2008, 2010 and 2012 events for medical admissions to the Wigan Royal Infirmary located near the center of the Wigan borough council on the outskirts of greater Manchester in northern England. The bulk of these admissions are covered by a single primary care organization (PCO), the Wigan Borough Clinical Commissioning Group, hence any small area differences cannot arise from differences in acute admission thresholds, differences in PCO policies or practice, or to differences in adult social services. The findings from previous studies [24] are extended into very small area geographies called Lower Super Output Areas (LSOA) which contain around 100 medical admissions per annum, and use daily rather than monthly admissions to characterize a unique step-like increase in admissions which may best be described as a moving rectangular wave, in which admissions stay high for 12 months before rapidly reverting back to the baseline trajectory.
It has only recently been discovered that one of these events occurred in 2010 [18,19], and this event in particular can be investigated in more detail, along with the issue of spatiotemporal granularity/heterogeneity and infectious bursts which are a known feature of infectious outbreaks [28-31].
Methods
The data covers daily emergency (non-elective) medical admissions between April 2008 and March 2013, and comes from a previous study which used larger mid super output areas (MSOA), and examined the 2012 event in detail [24]. Medical admissions covers the specialties General & Elderly Medicine (55%), Emergency Assessment (18%), Thoracic medicine (11%), Cardiology (10%), Gastroenterology (6%) and Rehabilitation (1%). Admissions for this study were grouped into both the larger MSOA and smaller Lower Super Output Areas (LSOA), both of which are statistical geographies used in England. At that time the importance of the 2010 event was not appreciated [18,19], and hence this study also seeks to clarify the nature of this event.
No patient identifiable data was used, and a previously prepared extract at LSOA level [4] was analyzed. Admissions for persons living outside of Wigan were aggregated at local authority level or into larger geographies. Daily admissions for each MSOA/LSOA/area were summed into running 365 day totals. As in previous studies [19-25] the size of any step-like change is calculated by comparing the magnitude of the step-up and step-down associated with each event. This was determined using differences between successive running 365 day totals. Hence the first successive difference starts with a comparison of the running 365 day total ending 31st March 2009, with the running total ending 31st March 2010 as a percentage difference between the two periods. This detects any step-change occurring at 31st March 2009, move forward one day and repeat the comparison. Points of maximum and minimum percentage difference then identify the respective step-up and step-down events.
Monthly deaths (all-cause mortality) for the residents of Wigan were obtained from the Office for National Statistics. Data on the population density (persons/hectare), Index of Multiple Deprivation (IMD), which ranges from 0 (least deprived) through to 100 (most deprived), social classification (using the output area classification methodology), and proportion of persons aged 70+, were all obtained from the Office for National Statistics.
Statistical analysis is based on Poisson statistics where, by definition, the standard deviation is equal to the square root of the average. This square root relationship with the average attenuates the effect of uncertainty in the average. This study uses two measures of the average. In the evaluation of the maximum step-change over the entire period, the average was calculated over the full time period April-08 to May-12. For the evaluation of the 2009/10 event, the average was calculated over the interval specific to this event, namely, Mar-09 to Feb-11.
The relationship between the standard deviation of a Poisson distribution and the square root of the average can also be used to convert percentage increases in medical admissions in different sized LSOA (as average number of admissions) into standard deviation (STDEV) equivalents. Hence a 10% increase observed in a LSOA with an average of 100 admissions is equivalent to a 1 STDEV equivalent increase, etc.
Results
This study uses both MSOA and LSOA small areas within Wigan. Each MSOA contains three to eight LSOA with four to five being the most common. Each LSOA contains an average of 1,500 persons (range 1,000 to 3,000 persons, or 400 to 1,200 households). Hence this study is investigating very small spatial areas.
A running 365 day or 12 month total is a useful tool for detecting step-like changes in admission rates or deaths when the admissions/deaths show high seasonality [32-34], while the use of a larger running total minimizes the contribution from Poisson randomness, and effectively de-seasonalizes the trend [35]. A step-like increase, when analyzed using a running total, results in a ramp where the foot of the ramp marks the onset of the step-change, the slope of the ramp indicates the magnitude of the step-change, and the point 365 days or 12 months after the onset also reflects the size of the step-change (assuming the event has endured for a full 365 days).
Step-changes in deaths
To set the context for this paper, Figure 1 shows a running 12 month total of deaths for the 12 month period ending Dec-06 to May-15. According to the Office for National Statistics in the 2008-based components of change, deaths in Wigan were supposed to decline along a continuous line with around 3,100 deaths in 2009 reducing to 2,900 deaths in 2015[36]. The peaks and troughs in Figure 1 (as seen in all other local authorities across the UK) are therefore entirely unexpected and have never been given an official explanation [15,18]. Figure 1 therefore shows a series of step-like increasesin deaths commencing somewhere around May-07 (+8.7%), Feb-10 (+5.4%, less prominent perhaps due to slower and more granular spread), Apr-12 (+7.7%) and May-14 (+8.8%). Each peak may be made up from spatial spread within Wigan, and the remainder of this paper will investigate the accompanying small-area effect on medical admissions. It has been estimated that for every death there are around 10 extra medical admissions, although this ratio seems to vary between the events [37,38]. Note that background scatter of up to ±50 will arise due to Poisson variation and this explains most of the smaller saw-tooth features in Figure 1. The duration of this study does not cover the 2014/15 event although timing for initiation at Local Authority level across England has been presented elsewhere [19].
It has also been observed that deaths lag behind admissions and emergency department attendances by around one to two months [25,39], i.e. initial illness and decline precede eventual death. Hence the timing of small area events using medical admissions may occur earlier than seen for deaths in Figure 1.
Step changes in admissions
It is commonly believed throughout the health services in the UK, that population demographic change is the principle driving force for the increase in medical (and other) admissions [40], and an increasingly elderly population in Wigan would imply that the minimum number of admissions should occur toward the start of the study period and the maximum toward the end. This is totally at variance for the wide range in dates for the maximum and minimum admissions demonstrated in Table S1 in the supplementary material. Indeed the point of maximum 365 day total admissions can range anywhere between 31st Mar 2009 through to 31st March 2013 (Wigan 011C versus Wigan 032A), as can the point of minimum admissions (Wigan 020A versus Wigan 012C). Typical winter infectious events are assumed to have only a small effect on the overall trend. The available data used in this study encompasses the tail end of the 2007/08 event, the full range of the 2010/11 event and the leading edge of the 2012/13 event, i.e. there are a maximum of three possible maxima and three possible minima during this period [19], as in Figure 1.
Table S1: Details for the 100 largest areas/LSOA used in this study
| Location or LSOA
|
Average admissions
|
Maximum admissions
|
Minimum admissions
|
Range as percentage of average
|
Running 365 day Maximum
|
Running 365 day Minimum
|
Max-Min (years)
|
Maximum Step-Increase
|
Maximum Step-Decrease
|
± 1 Standard Deviation (Poisson)
|
Start of largest step-increase
|
All locations |
19,420 |
20,436 |
18,313 |
11% |
29-Sep-10 |
31-Jan-12 |
-1.3 |
4% |
9% |
1% |
31-Jan-12 |
Wigan |
17,291 |
18,194 |
16,342 |
11% |
29-Sep-10 |
31-Jan-12 |
-1.3 |
4% |
9% |
1% |
13-Nov-11 |
Not Wigan |
2,129 |
2,286 |
1,937 |
16% |
29-Sep-10 |
31-Jan-12 |
-1.3 |
14% |
15% |
2% |
01-Jun-09 |
W. Lancashire |
672 |
718 |
605 |
17% |
14-Jan-13 |
07-Feb-12 |
0.9 |
18% |
14% |
4% |
15-Jan-12 |
Unknown |
654 |
737 |
462 |
42% |
07-Apr-11 |
03-Apr-09 |
2.0 |
39% |
13% |
4% |
13-Jun-09 |
Wigan 031E |
333 |
385 |
259 |
38% |
14-Jan-11 |
04-Feb-12 |
-1.1 |
41% |
31% |
5% |
04-Feb-12 |
St. Helens |
293 |
336 |
252 |
29% |
20-Jul-09 |
01-Mar-11 |
-1.6 |
20% |
23% |
6% |
22-Apr-11 |
Wigan 015D |
256 |
345 |
197 |
58% |
16-Jan-10 |
08-Jul-12 |
-2.5 |
17% |
35% |
6% |
20-Mar-12 |
Other UK |
241 |
303 |
171 |
55% |
06-Nov-09 |
24-Jul-12 |
-2.7 |
10% |
31% |
6% |
30-Mar-12 |
Wigan 009C |
224 |
277 |
189 |
39% |
09-Feb-10 |
24-Feb-12 |
-2.0 |
12% |
22% |
7% |
11-Apr-09 |
Wigan 035A |
205 |
245 |
159 |
42% |
18-May-11 |
11-Jun-10 |
0.9 |
48% |
29% |
7% |
11-Jun-10 |
Wigan 010C |
196 |
248 |
175 |
37% |
19-Jul-09 |
26-Nov-10 |
-1.4 |
15% |
25% |
7% |
26-Nov-10 |
Wigan 014B |
193 |
222 |
163 |
31% |
22-Oct-10 |
12-Sep-11 |
-0.9 |
34% |
25% |
7% |
18-Mar-12 |
Wigan 033E |
190 |
241 |
150 |
48% |
18-Apr-09 |
21-Dec-11 |
-2.7 |
40% |
23% |
7% |
21-Dec-11 |
Wigan 015B |
186 |
221 |
153 |
37% |
27-Apr-11 |
28-Jul-10 |
0.7 |
43% |
26% |
7% |
28-Feb-10 |
Wigan 016E |
174 |
200 |
137 |
36% |
23-Apr-11 |
25-Jan-13 |
-1.8 |
23% |
28% |
8% |
04-Apr-09 |
Wigan 032D |
167 |
204 |
131 |
44% |
13-Oct-10 |
22-Mar-13 |
-2.4 |
31% |
30% |
8% |
20-Jun-09 |
Wigan 015C |
166 |
192 |
142 |
30% |
30-Jun-11 |
11-Jan-10 |
1.5 |
25% |
19% |
8% |
12-Jan-10 |
Wigan 010D |
163 |
223 |
114 |
67% |
12-Nov-10 |
11-Apr-09 |
1.6 |
77% |
43% |
8% |
16-Nov-09 |
Wigan 009A |
162 |
195 |
132 |
39% |
14-Aug-10 |
21-Jun-12 |
-1.9 |
23% |
28% |
8% |
19-Jun-09 |
Wigan 012B |
159 |
176 |
134 |
26% |
06-Jun-09 |
17-Sep-12 |
-3.3 |
14% |
16% |
8% |
13-Feb-11 |
Wigan 015E |
156 |
190 |
127 |
40% |
24-Aug-09 |
05-Dec-12 |
-3.3 |
9% |
23% |
8% |
03-Apr-09 |
Wigan 012C |
156 |
182 |
132 |
32% |
09-Nov-09 |
31-Mar-13 |
-3.4 |
21% |
23% |
8% |
05-Jan-11 |
Wigan 010B |
153 |
191 |
130 |
40% |
07-Jun-10 |
02-Jun-12 |
-2.0 |
36% |
30% |
8% |
16-May-09 |
Wigan 013C |
152 |
181 |
106 |
49% |
26-Feb-10 |
16-Dec-11 |
-1.8 |
44% |
39% |
8% |
28-Dec-11 |
Wigan 036C |
152 |
175 |
128 |
31% |
24-May-12 |
14-May-10 |
2.0 |
26% |
23% |
8% |
20-Mar-10 |
Wigan 024B |
150 |
184 |
118 |
44% |
24-May-09 |
26-Sep-11 |
-2.3 |
27% |
33% |
8% |
22-Aug-11 |
Wigan 027D |
148 |
170 |
119 |
34% |
09-Dec-09 |
08-Dec-12 |
-3.0 |
24% |
27% |
8% |
20-Sep-10 |
Wigan 012D |
147 |
198 |
96 |
69% |
26-May-09 |
28-Nov-12 |
-3.5 |
5% |
36% |
8% |
29-Nov-10 |
Wigan 010A |
143 |
168 |
121 |
33% |
02-Aug-09 |
26-Jan-13 |
-3.5 |
16% |
21% |
8% |
04-Jul-10 |
Wigan (small) |
143 |
170 |
125 |
31% |
27-Nov-09 |
13-Sep-12 |
-2.8 |
17% |
24% |
8% |
08-Jun-09 |
Wigan 036A |
142 |
175 |
114 |
43% |
16-Jun-12 |
31-Oct-10 |
1.6 |
32% |
20% |
8% |
07-Nov-10 |
Wigan 016A |
141 |
161 |
111 |
35% |
13-Dec-09 |
23-Oct-12 |
-2.9 |
14% |
26% |
8% |
29-Apr-09 |
Wigan 040D |
140 |
189 |
101 |
63% |
21-Nov-12 |
31-Mar-09 |
3.6 |
55% |
23% |
8% |
27-Dec-11 |
Wigan 007B |
140 |
169 |
105 |
46% |
03-Sep-09 |
22-Apr-12 |
-2.6 |
23% |
37% |
8% |
09-Jul-10 |
Wigan 012A |
140 |
182 |
100 |
59% |
17-Sep-10 |
08-Jan-13 |
-2.3 |
33% |
36% |
8% |
14-Sep-09 |
Wigan 006B |
137 |
157 |
115 |
31% |
26-Dec-09 |
23-Mar-12 |
-2.2 |
33% |
20% |
9% |
28-Mar-12 |
Wigan 013B |
134 |
159 |
104 |
41% |
09-Jun-10 |
04-Jun-12 |
-2.0 |
46% |
23% |
9% |
26-Mar-12 |
Wigan 008C |
133 |
163 |
114 |
37% |
24-Oct-10 |
03-Apr-09 |
1.6 |
38% |
28% |
9% |
19-Sep-09 |
Bolton |
132 |
162 |
104 |
44% |
11-Feb-12 |
10-Apr-11 |
0.8 |
49% |
25% |
9% |
13-Apr-11 |
Wigan 038D |
130 |
144 |
107 |
28% |
30-Oct-10 |
12-Mar-13 |
-2.4 |
19% |
21% |
9% |
21-Oct-09 |
Wigan 009B |
129 |
144 |
108 |
28% |
18-Jan-11 |
04-Apr-12 |
-1.2 |
13% |
24% |
9% |
17-Aug-10 |
Wigan 024C |
128 |
143 |
111 |
25% |
15-Oct-10 |
07-Apr-09 |
1.5 |
22% |
18% |
9% |
13-Oct-09 |
Wigan 027A |
127 |
165 |
85 |
63% |
17-Dec-09 |
06-Nov-12 |
-2.9 |
18% |
38% |
9% |
30-Mar-12 |
Wigan 036B |
127 |
149 |
100 |
39% |
11-May-10 |
17-May-12 |
-2.0 |
29% |
28% |
9% |
26-Oct-09 |
Wigan 002A |
126 |
152 |
98 |
43% |
11-Sep-10 |
05-Nov-12 |
-2.2 |
13% |
24% |
9% |
12-Sep-09 |
Wigan 009D |
126 |
204 |
95 |
87% |
13-Dec-12 |
04-Jun-09 |
3.5 |
95% |
17% |
9% |
04-Jun-09 |
Wigan 005B |
124 |
149 |
98 |
41% |
25-Aug-10 |
06-Sep-09 |
1.0 |
52% |
22% |
9% |
06-Sep-09 |
Wigan 016B |
123 |
160 |
90 |
57% |
10-Feb-12 |
31-Mar-09 |
2.9 |
31% |
34% |
9% |
10-Feb-11 |
Wigan 010E |
123 |
161 |
106 |
45% |
09-May-09 |
13-May-12 |
-3.0 |
14% |
29% |
9% |
08-Jan-10 |
Wigan 018B |
119 |
141 |
93 |
40% |
19-Jul-11 |
16-Jul-12 |
-1.0 |
30% |
34% |
9% |
12-May-10 |
Wigan 014D |
119 |
139 |
103 |
30% |
02-Apr-09 |
11-Feb-12 |
-2.9 |
26% |
19% |
9% |
11-Feb-12 |
Wigan 002E |
118 |
143 |
98 |
38% |
01-Apr-09 |
25-Jan-12 |
-2.8 |
27% |
22% |
9% |
07-Feb-12 |
Wigan 009E |
117 |
128 |
98 |
26% |
19-Jan-10 |
20-Nov-10 |
-0.8 |
21% |
23% |
9% |
20-Nov-10 |
Wigan 013A |
116 |
133 |
89 |
38% |
02-Sep-11 |
04-Jun-10 |
1.2 |
40% |
31% |
9% |
01-Aug-10 |
Wigan 005E |
115 |
130 |
101 |
25% |
23-Aug-10 |
11-Nov-11 |
-1.2 |
18% |
22% |
9% |
11-Jul-11 |
Wigan 019C |
115 |
136 |
97 |
34% |
23-Jan-11 |
12-Apr-12 |
-1.2 |
21% |
27% |
9% |
23-Jan-10 |
Wigan 024A |
115 |
136 |
97 |
34% |
04-Jan-10 |
07-Jun-11 |
-1.4 |
26% |
24% |
9% |
07-Jun-11 |
Wigan 011E |
113 |
135 |
86 |
43% |
17-Jan-11 |
15-Feb-13 |
-2.1 |
13% |
32% |
9% |
03-Jun-10 |
Wigan 008B |
113 |
136 |
95 |
36% |
12-Sep-11 |
09-Mar-13 |
-1.5 |
33% |
27% |
9% |
22-Mar-10 |
Wigan 016C |
113 |
137 |
96 |
36% |
20-Oct-09 |
18-Jul-12 |
-2.7 |
17% |
22% |
9% |
25-Jan-11 |
Wigan 027C |
112 |
137 |
89 |
43% |
11-Apr-09 |
22-Nov-10 |
-1.6 |
31% |
27% |
9% |
03-Aug-11 |
Wigan 006E |
109 |
133 |
85 |
44% |
02-Mar-11 |
23-Dec-11 |
-0.8 |
40% |
35% |
10% |
23-May-10 |
Wigan 004D |
109 |
127 |
90 |
34% |
10-Apr-11 |
09-Apr-12 |
-1.0 |
30% |
29% |
10% |
10-Apr-10 |
Wigan 018C |
108 |
126 |
98 |
26% |
20-Jul-11 |
03-Aug-10 |
1.0 |
27% |
18% |
10% |
20-Jul-10 |
Wigan 015A |
108 |
149 |
83 |
61% |
29-Mar-10 |
22-Apr-11 |
-1.1 |
42% |
43% |
10% |
09-Apr-09 |
Wigan 006A |
107 |
136 |
77 |
55% |
18-Jan-10 |
19-Feb-13 |
-3.1 |
34% |
34% |
10% |
30-Aug-11 |
Wigan 014A |
105 |
125 |
84 |
39% |
13-Jul-10 |
13-Jul-11 |
-1.0 |
37% |
33% |
10% |
13-Jul-11 |
Wigan 003D |
104 |
151 |
66 |
82% |
14-Dec-10 |
16-Dec-11 |
-1.0 |
54% |
56% |
10% |
06-Oct-09 |
Wigan 011B |
104 |
141 |
83 |
56% |
10-Mar-13 |
03-Apr-12 |
0.9 |
63% |
26% |
10% |
16-Mar-12 |
Wigan 026E |
104 |
140 |
67 |
70% |
30-Mar-10 |
26-Feb-13 |
-2.9 |
58% |
34% |
10% |
31-Mar-09 |
Wigan 020C |
103 |
137 |
76 |
59% |
13-Sep-10 |
03-Aug-12 |
-1.9 |
57% |
32% |
10% |
16-Sep-09 |
Wigan 005A |
102 |
120 |
84 |
35% |
22-Dec-10 |
28-Dec-09 |
1.0 |
43% |
23% |
10% |
28-Dec-09 |
Wigan 001C |
101 |
118 |
86 |
32% |
19-Jan-11 |
01-Jun-10 |
0.6 |
31% |
23% |
10% |
03-Mar-10 |
Wigan 011A |
101 |
118 |
82 |
36% |
21-Jun-10 |
14-Nov-12 |
-2.4 |
23% |
29% |
10% |
04-Jul-11 |
Wigan 030B |
99 |
122 |
74 |
48% |
25-Aug-10 |
19-Oct-11 |
-1.2 |
49% |
37% |
10% |
23-Nov-11 |
Wigan 033B |
99 |
119 |
79 |
40% |
28-Jan-10 |
30-Mar-13 |
-3.2 |
21% |
22% |
10% |
02-Aug-11 |
Wigan 002C |
98 |
120 |
74 |
47% |
18-Feb-11 |
23-Jun-09 |
1.7 |
34% |
24% |
10% |
13-Feb-10 |
Wigan 011C |
98 |
133 |
78 |
56% |
31-Mar-09 |
19-Dec-11 |
-2.7 |
41% |
40% |
10% |
25-Apr-10 |
Wigan 007D |
97 |
126 |
72 |
55% |
03-Jul-10 |
20-Aug-11 |
-1.1 |
40% |
38% |
10% |
05-Oct-11 |
Wigan 018E |
97 |
114 |
84 |
31% |
18-Oct-12 |
07-Apr-09 |
3.5 |
33% |
21% |
10% |
19-Oct-11 |
Wigan 019A |
96 |
113 |
69 |
46% |
18-Sep-12 |
07-Nov-10 |
1.9 |
62% |
32% |
10% |
10-Nov-10 |
Wigan 013D |
94 |
122 |
68 |
57% |
09-Apr-09 |
09-Jul-10 |
-1.2 |
63% |
42% |
10% |
10-Jul-10 |
Wigan 038E |
93 |
114 |
69 |
48% |
28-Jan-11 |
04-Jul-09 |
1.6 |
48% |
32% |
10% |
05-Feb-10 |
Wigan 038C |
93 |
115 |
74 |
44% |
16-May-11 |
06-Jan-10 |
1.4 |
52% |
28% |
10% |
13-Feb-10 |
Wigan 032C |
92 |
112 |
68 |
48% |
28-Aug-12 |
13-May-09 |
3.3 |
31% |
19% |
10% |
13-May-09 |
Wigan 020A |
92 |
103 |
75 |
30% |
26-Feb-10 |
31-Mar-09 |
0.9 |
37% |
20% |
10% |
01-Apr-09 |
Wigan 033D |
92 |
113 |
61 |
57% |
22-Feb-13 |
03-Apr-09 |
3.9 |
56% |
30% |
10% |
25-Jun-09 |
Wigan 027B |
92 |
109 |
70 |
43% |
21-Jun-11 |
08-Apr-10 |
1.2 |
51% |
22% |
10% |
08-Apr-10 |
Wigan 012E |
92 |
110 |
76 |
37% |
07-Jun-11 |
04-Mar-13 |
-1.7 |
26% |
23% |
10% |
15-Jun-10 |
Wigan 024D |
91 |
100 |
80 |
22% |
05-May-11 |
05-May-10 |
1.0 |
25% |
16% |
11% |
30-May-10 |
Wigan 014C |
88 |
121 |
65 |
63% |
23-Dec-10 |
19-Jul-09 |
1.4 |
82% |
41% |
11% |
13-Oct-09 |
Wigan 026D |
88 |
103 |
73 |
34% |
23-Oct-09 |
21-Dec-11 |
-2.2 |
41% |
20% |
11% |
21-Dec-11 |
Wigan 032A |
88 |
108 |
73 |
40% |
31-Mar-13 |
22-Jan-11 |
2.2 |
33% |
24% |
11% |
23-Apr-11 |
Wigan 032E |
87 |
103 |
67 |
41% |
05-Jun-11 |
04-Apr-09 |
2.2 |
37% |
24% |
11% |
04-Apr-09 |
Wigan 031A |
86 |
126 |
63 |
73% |
05-Mar-11 |
06-Mar-10 |
1.0 |
100% |
39% |
11% |
06-Mar-10 |
Wigan 018A |
86 |
123 |
65 |
68% |
14-Jul-11 |
29-Nov-09 |
1.6 |
68% |
46% |
11% |
20-Jun-10 |
Wigan 014E |
85 |
107 |
67 |
47% |
28-Nov-12 |
25-Sep-10 |
2.2 |
37% |
26% |
11% |
01-Dec-11 |
Wigan 037B |
85 |
106 |
63 |
51% |
30-Nov-10 |
29-Nov-11 |
-1.0 |
50% |
40% |
11% |
03-Jan-12 |
Wigan 026C |
83 |
109 |
66 |
52% |
21-Aug-10 |
11-Sep-12 |
-2.1 |
50% |
35% |
11% |
08-Apr-09 |
|
|
|
|
|
|
|
|
|
|
|
|
Admissions for residents in nearby West Lancashire displays three peaks of roughly similar magnitude for the 365 days ending 16th July 2009, 3rd March 2011 and 14th January 2013. For the residents of Wigan the tail of the 2008 event appears to merge with the start of the 2010 event giving an initial plateau around 17,650 admissions per 365 days, then a peak of 18,194 admissions for the 365 days ending 29th September 2010, followed by a minimum of 16,342 for the 365 days ending 31st January 2012 and then a maximum of 17,029 for the 365 days ending 12th November 2012 (data not shown).
However, as can be seen in Figure 2 the small-area trends display considerable variation between LSOA in Wigan. Such disparate trends are difficult to explain from an assumed demographic perspective, since all should be showing roughly linear trends with a slight upward slope of around 1% to 2% per annum. Hence as in Figure1 there are a series of trends without any apparent explanation and which seem to defy commonly held notions regarding demographic growth as the principle driving force for change.
The initial plateau for Wigan as a whole, and Wigan 013C may illustrate the one weakness in the running 365 day approach in that an unexpected ‘spike’ event (arising from a typical temporary infectious outbreak such as influenza, SARS, or an extreme of temperature) creates a flat-topped plateau-like feature as the spike moves its way along the running 365 day total. The shape of the earlier part of the trend for Wigan 013C suggests such a spike event may be acting to obscure other trends, however, while the step-up may have been obscured, the step-down (as a ramp) is clearly visible. While it is far easier to adjust for spike events using monthly data (see [41] as an example), it is more difficult to do this in a running 365 day total, and it is exactly for this reason that this study uses both the step-up and step-down parts of the events, and for simplicity, this part of the analysis only documents the largest event in each small area. Hence using Figure 1as an example the largest step-down would have occurred at the cessation of the 2007/08 event, etc.
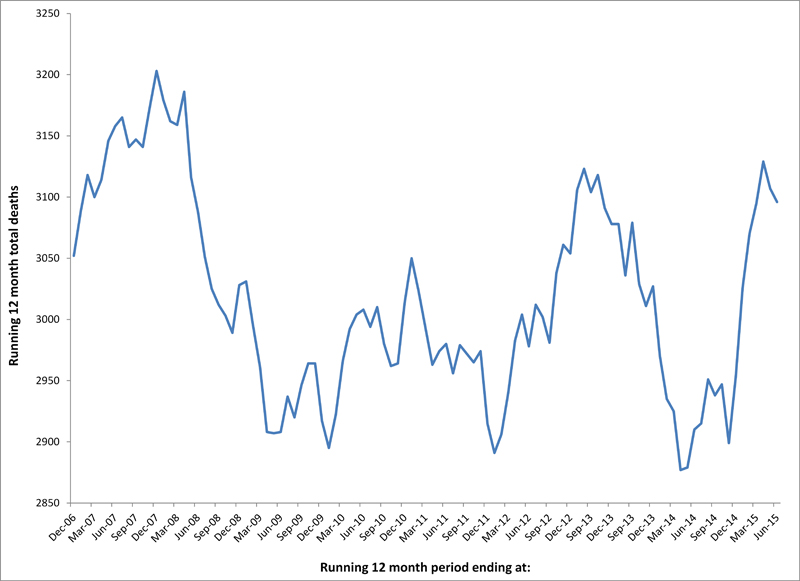
Figure 1. Running 12 month total of deaths (all-cause mortality) for residents of Wigan, near Manchester (UK) - this time-series covers four outbreaks of the suspected new agent
Step-like increases in admissions (generating an upward ramp in a running 365 day total chart) can be seen, as are step-like reductions (a ramp downward) following the cessation of an event. The upward ramps are not perfectly linear simply because spread of the agent throughout each LSOA is not instantaneous. Wigan 011C appears to show only the step-down following the 2007/08 event while Wigan 011B only appears to show a strong step-up for the 2012/13 event (the time span of the study limiting the ability to detect the ensuing step-down). As can be appreciated, the spatiotemporal trend for the whole of Wigan is a composite of all the smaller areas, and there appears to be considerable granularity/heterogeneity in the spread of the agent.
Table S1 in the Supplementary material presents summary data for the 100 largest LSOA. Note the large percentage difference between the maximum and minimum running annual total for admissions, which is far beyond anything arising from chance, and the wide variation in the dates for the maximum and minimum admissions, and the onset of the step-up and step-down features. Clearly something far more powerful than demographic-driven change is occurring and complex spatiotemporal effects are hidden in the larger geographic areas.
Magnitude of the maximum step-up or step-down
While the use of daily admissions generates more complex trends than those observed in earlier studies using monthly admissions, it is still possible to calculate the size of any step-like changes by comparing the percentage difference between successive 365 day blocks of data each side of a step-like change, for example, 365 days ending December 2012 compared to December 2011. Figure 3 shows the size of the largest step-like increase in each LSOA and MSOA (or other geography), and the size of the largest step-like decrease which will occur following the cessation of such an event. Both step-up and step-down have been calculated relative to the average number of admissions to avoid the situation where the step-down appears smaller by virtue of comparison against the larger total admissions after the start of the event. Figure 3 also shows the range between the maximum and minimum running 365 day total of admissions expressed as a percentage of the average admissions. As expected the range is slightly higher than the maximum step-up or step-down simply because it encompasses the sum of all possible effects against admissions during the time of the study. However the value of the range is not widely different to the step-up and step-down values, indicating that these step-like changes are the principle factor regulating changes in admissions.
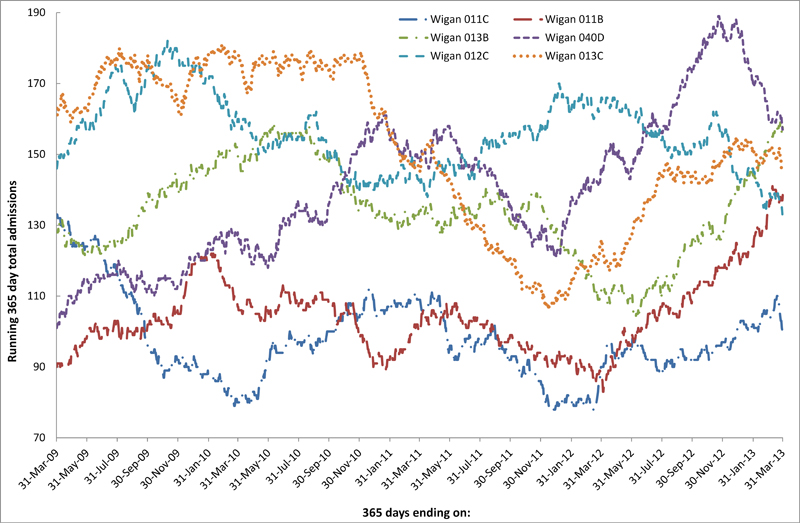
Figure 2. Range in running 365 day total medical admissions for a selection of Wigan statistical geographies called lower super output areas (LSOA)
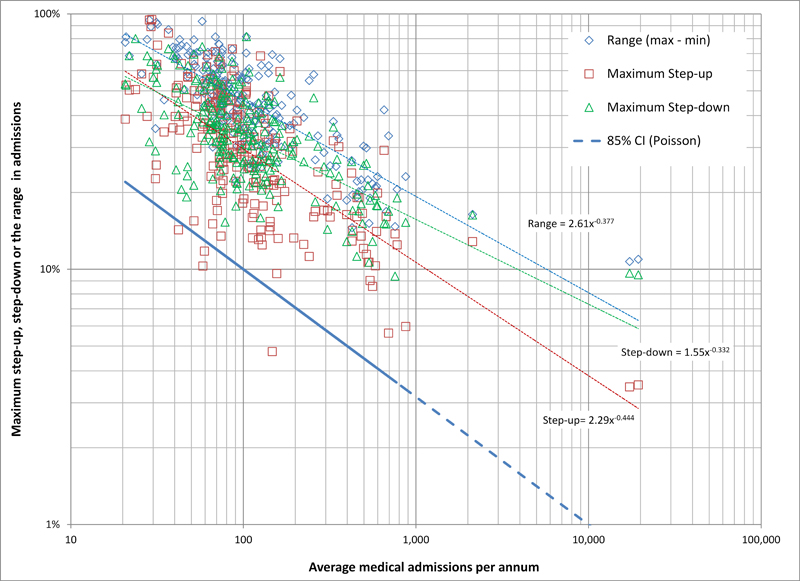
Figure 3. Value of the maximum percentage increase in admissions due to a step-like increase, the maximum step-like reduction after the cessation of the infectious-like events, and the range between maximum and minimum admissions in each LSOA or other area
As can be seen, the value for the largest step-up or step-down are roughly similar except at the extreme points measured across the entire hospital catchment area, or for the whole of Wigan. Also that the step-like changes are mostly greater than the value of a +1 standard deviation (SD) change which could arise from simple Poisson variation. As expected, potential Poisson variation increases with decreasing size since, by definition, the standard deviation of a Poisson distribution is equal to the square root of the average. In a Poisson distribution the + 1 standard deviation line encompasses 85% of all possible outcomes arising from chance, and effectively represents the 85% confidence interval, i.e. in a Poisson distribution, 85% of all data values are expected to lie below the + 1SD line – which is clearly not the case.
The value of the power function in the trend lines in Figure 3 range from -0.332 for step-down to -0.444 for step-up. It is possible that the value of the exponent has been reduced by the high data points at whole hospital and Wigan level. However these values are not too different from a value of -0.5 expected from a pure Poisson function, which indicates that Poisson chance events may form a basis for the mechanisms behind these events.
The value of ± 1 standard deviation (Poisson) can be used to determine the potential contribution from chance variation to each calculated increase. As can also be seen in Figure 3, the step-up in just four LSOA fails to exceed the 85% CI (Poisson), however, in all cases the maximum step-down is higher.
Table S2 in the supplementary material summarizes the details for the all the LSOA within the MSOAs in Wigan along with admissions from other areas. Note how the step-up or step–down is usually lower at MSOA level, and this is due to the wide variation in initiation dates for the step-up or step–down events, i.e. slow spatial spread within the geography of a single MSOA is leading to a degree of cancelling-out between the rectangular wave events which obscures the full extent of the effect seen at the smaller geographies. There are occasional exceptions to this rule and the maximum step-change in Wigan 022D is lower than that observed for Wigan 022. This is simply an expression of the high granularity/heterogeneity associated with these events.
Table S2: Details of the largest step-u and step-down, plus the 2009/10 event for MSOA and associated LSOA within each of these MSOA
| Location
|
Admissions per 365 days
|
Largest step-up or step-down
|
2009/10 Event
|
| Maximum
|
Minimum
|
Average (Apr-08 to May-12)
|
Average (Mar-09 to Feb-11)
|
Range (max - min)
|
Step-up
|
Step-down
|
85% CI (Poisson)
|
Start Up
|
Start Down
|
Differ-ence (years)
|
Ratio Max up/down
|
Start of event
|
Average Step-change
|
Adjusted to 100 deaths equivalent
|
All areas |
20,436 |
18,313 |
19,420 |
19,947 |
11% |
4% |
10% |
1% |
31-Jan-12 |
23-Oct-10 |
-1.3 |
37% |
29-Sep-09 |
6% |
89% |
Wigan |
18,194 |
16,342 |
17,291 |
17,769 |
11% |
3% |
10% |
1% |
13-Nov-11 |
23-Oct-10 |
-1.1 |
36% |
29-Sep-09 |
6% |
85% |
Not Wigan |
2,286 |
1,937 |
2,129 |
2,179 |
16% |
13% |
16% |
2% |
1-Jun-09 |
28-Mar-11 |
1.8 |
79% |
28-Mar-10 |
10% |
48% |
W. Lancashire |
718 |
605 |
672 |
686 |
17% |
16% |
15% |
4% |
15-Jan-12 |
19-Feb-11 |
-0.9 |
107% |
3-Mar-10 |
10% |
26% |
Unknown |
737 |
462 |
654 |
618 |
42% |
29% |
15% |
4% |
13-Jun-09 |
8-Apr-11 |
1.8 |
193% |
7-Apr-10 |
15% |
39% |
Bolton |
162 |
104 |
132 |
127 |
44% |
39% |
30% |
9% |
13-Apr-11 |
28-Jan-12 |
0.8 |
128% |
10-Apr-09 |
9% |
11% |
Chorley |
69 |
36 |
53 |
58 |
62% |
43% |
55% |
14% |
11-Jun-11 |
11-Feb-10 |
-1.3 |
79% |
10-May-09 |
26% |
19% |
Other |
303 |
171 |
241 |
278 |
55% |
11% |
33% |
6% |
30-Mar-12 |
20-Jun-11 |
-0.8 |
34% |
25-Jun-09 |
14% |
22% |
St. Helens |
336 |
252 |
293 |
305 |
29% |
17% |
25% |
6% |
22-Apr-11 |
1-Mar-10 |
-1.1 |
68% |
8-Apr-09 |
9% |
15% |
Warrington |
45 |
12 |
30 |
37 |
110% |
56% |
56% |
18% |
12-Apr-09 |
20-Dec-11 |
2.7 |
100% |
23-Apr-09 |
53% |
29% |
Wigan (small) |
170 |
125 |
143 |
147 |
31% |
15% |
28% |
8% |
8-Jun-09 |
28-Nov-09 |
0.5 |
55% |
13-Jul-09 |
15% |
18% |
Wigan 001A |
109 |
54 |
72 |
81 |
76% |
65% |
68% |
12% |
17-Oct-09 |
17-Oct-10 |
1.0 |
96% |
17-Oct-09 |
66% |
56% |
Wigan 001B |
74 |
34 |
56 |
66 |
71% |
50% |
52% |
13% |
3-Mar-12 |
26-Feb-11 |
-1.0 |
97% |
1-Apr-09 |
23% |
17% |
Wigan 001C |
118 |
86 |
101 |
100 |
32% |
28% |
25% |
10% |
3-Mar-10 |
1-Jun-09 |
-0.8 |
112% |
3-Mar-10 |
25% |
25% |
Wigan 001D |
57 |
29 |
41 |
36 |
68% |
51% |
51% |
16% |
19-Jul-10 |
23-Dec-11 |
1.4 |
100% |
18-May-10 |
34% |
22% |
Wigan01 |
325 |
235 |
270 |
282 |
33% |
24% |
30% |
6% |
16-Oct-09 |
23-Oct-10 |
1.0 |
79% |
23-Oct-09 |
27% |
45% |
Wigan 002A |
152 |
98 |
126 |
138 |
43% |
14% |
28% |
9% |
12-Sep-09 |
28-Nov-10 |
1.2 |
50% |
28-Nov-09 |
19% |
21% |
Wigan 002B |
76 |
48 |
62 |
64 |
45% |
35% |
45% |
13% |
1-Oct-09 |
7-Oct-10 |
1.0 |
79% |
1-Oct-09 |
39% |
31% |
Wigan 002C |
120 |
74 |
98 |
93 |
47% |
31% |
30% |
10% |
13-Feb-10 |
18-Feb-11 |
1.0 |
103% |
18-Feb-10 |
30% |
30% |
Wigan 002D |
76 |
40 |
52 |
48 |
70% |
66% |
21% |
14% |
1-Nov-11 |
3-Oct-10 |
-1.1 |
309% |
3-Oct-09 |
16% |
12% |
Wigan 002E |
143 |
98 |
118 |
124 |
38% |
22% |
24% |
9% |
7-Feb-12 |
5-Feb-11 |
-1.0 |
93% |
5-Feb-10 |
16% |
18% |
Wigan02 |
502 |
401 |
457 |
467 |
22% |
19% |
20% |
5% |
21-Feb-12 |
23-Feb-11 |
-1.0 |
97% |
25-Feb-10 |
15% |
32% |
Wigan 003A |
91 |
60 |
76 |
82 |
41% |
20% |
32% |
11% |
29-Dec-11 |
1-Mar-10 |
-1.8 |
63% |
24-May-09 |
22% |
19% |
Wigan 003B |
98 |
56 |
78 |
88 |
54% |
30% |
36% |
11% |
11-Feb-12 |
6-Sep-10 |
-1.4 |
82% |
6-Sep-09 |
20% |
18% |
Wigan 003C |
96 |
61 |
76 |
78 |
46% |
22% |
46% |
11% |
12-Oct-10 |
11-Oct-09 |
-1.0 |
49% |
11-May-10 |
8% |
7% |
Wigan 003D |
151 |
66 |
104 |
119 |
82% |
50% |
82% |
10% |
6-Oct-09 |
15-Dec-10 |
1.2 |
61% |
17-Dec-09 |
65% |
67% |
Wigan 003E |
98 |
64 |
77 |
81 |
44% |
25% |
34% |
11% |
22-Feb-11 |
10-Oct-09 |
-1.4 |
73% |
1-Apr-09 |
8% |
7% |
Wigan 003F |
68 |
33 |
47 |
39 |
75% |
47% |
19% |
15% |
22-Aug-10 |
31-Mar-09 |
-1.4 |
244% |
28-Feb-10 |
18% |
12% |
Wigan 003G |
80 |
26 |
58 |
72 |
94% |
33% |
74% |
13% |
14-Mar-12 |
15-Jun-11 |
-0.7 |
44% |
12-Nov-09 |
44% |
34% |
Wigan03 |
584 |
430 |
516 |
559 |
30% |
11% |
26% |
4% |
11-Dec-11 |
14-Dec-10 |
-1.0 |
44% |
14-Dec-09 |
14% |
31% |
Wigan 004A |
101 |
58 |
78 |
67 |
55% |
47% |
15% |
11% |
3-Nov-10 |
27-Feb-12 |
1.3 |
308% |
13-Jun-10 |
20% |
18% |
Wigan 004B |
101 |
60 |
81 |
82 |
51% |
28% |
49% |
11% |
9-Jan-12 |
1-Dec-09 |
-2.1 |
58% |
24-May-10 |
7% |
6% |
Wigan 004C |
99 |
59 |
77 |
71 |
52% |
47% |
35% |
11% |
3-Mar-11 |
30-Mar-12 |
1.1 |
133% |
31-Mar-09 |
18% |
16% |
Wigan 004D |
127 |
90 |
109 |
109 |
34% |
27% |
34% |
10% |
10-Apr-10 |
10-Apr-11 |
1.0 |
78% |
10-Apr-10 |
30% |
32% |
Wigan04 |
389 |
302 |
345 |
329 |
25% |
21% |
18% |
5% |
3-Nov-10 |
12-Jul-09 |
-1.3 |
121% |
29-Apr-10 |
6% |
11% |
Wigan 005A |
120 |
84 |
102 |
103 |
35% |
35% |
27% |
10% |
28-Dec-09 |
28-Dec-10 |
1.0 |
133% |
28-Dec-09 |
31% |
31% |
Wigan 005B |
149 |
98 |
124 |
122 |
41% |
41% |
27% |
9% |
6-Sep-09 |
4-Sep-10 |
1.0 |
155% |
4-Sep-09 |
33% |
37% |
Wigan 005C |
92 |
60 |
74 |
76 |
43% |
34% |
42% |
12% |
29-Mar-12 |
5-Jul-09 |
-2.7 |
81% |
5-Apr-10 |
17% |
15% |
Wigan 005D |
96 |
43 |
75 |
77 |
71% |
48% |
61% |
12% |
6-Sep-09 |
27-Feb-12 |
2.5 |
78% |
31-Dec-09 |
28% |
24% |
Wigan 005E |
130 |
101 |
115 |
119 |
25% |
17% |
24% |
9% |
11-Jul-11 |
27-Aug-10 |
-0.9 |
68% |
30-Aug-09 |
20% |
21% |
Wigan05 |
552 |
452 |
490 |
498 |
20% |
17% |
15% |
5% |
29-Dec-09 |
19-Sep-10 |
0.7 |
109% |
17-Sep-09 |
16% |
35% |
Wigan 006A |
136 |
77 |
107 |
122 |
55% |
25% |
38% |
10% |
30-Aug-11 |
15-Sep-10 |
-1.0 |
66% |
25-Jul-09 |
16% |
17% |
Wigan 006B |
157 |
115 |
137 |
141 |
31% |
28% |
22% |
9% |
28-Mar-12 |
29-May-10 |
-1.8 |
127% |
1-Jun-09 |
20% |
24% |
Wigan 006C |
98 |
42 |
69 |
80 |
81% |
45% |
55% |
12% |
30-Sep-09 |
20-Oct-10 |
1.1 |
82% |
5-Oct-09 |
47% |
39% |
Wigan 006D |
102 |
47 |
76 |
85 |
73% |
53% |
49% |
11% |
17-Feb-12 |
4-Jan-11 |
-1.1 |
108% |
4-Jan-10 |
26% |
23% |
Wigan 006E |
133 |
85 |
109 |
113 |
44% |
33% |
42% |
10% |
23-May-10 |
23-Dec-10 |
0.6 |
78% |
23-Dec-09 |
34% |
35% |
Wigan06 |
564 |
413 |
498 |
541 |
30% |
12% |
26% |
4% |
2-Jan-12 |
7-Jan-11 |
-1.0 |
47% |
16-Sep-09 |
14% |
32% |
Wigan 007A |
89 |
52 |
70 |
69 |
53% |
45% |
32% |
12% |
26-Aug-11 |
25-Aug-10 |
-1.0 |
141% |
18-May-09 |
24% |
20% |
Wigan 007B |
169 |
105 |
140 |
152 |
46% |
21% |
44% |
8% |
9-Jul-10 |
19-Mar-11 |
0.7 |
48% |
19-Mar-10 |
29% |
35% |
Wigan 007C |
59 |
28 |
42 |
47 |
74% |
14% |
40% |
15% |
1-Dec-11 |
30-Jan-11 |
-0.8 |
35% |
6-Mar-10 |
23% |
15% |
Wigan 007D |
126 |
72 |
97 |
109 |
55% |
30% |
48% |
10% |
5-Oct-11 |
20-Aug-10 |
-1.1 |
62% |
4-Jul-09 |
36% |
36% |
Wigan007 |
398 |
281 |
349 |
378 |
34% |
19% |
27% |
5% |
2-Dec-11 |
2-Dec-10 |
-1.0 |
72% |
4-Jan-10 |
13% |
24% |
Wigan 008A |
90 |
57 |
74 |
80 |
44% |
13% |
24% |
12% |
10-Aug-09 |
30-Nov-09 |
0.3 |
56% |
10-Aug-09 |
17% |
15% |
Wigan 008B |
136 |
95 |
113 |
112 |
36% |
28% |
32% |
9% |
22-Mar-10 |
20-Sep-11 |
1.5 |
89% |
18-Feb-10 |
24% |
26% |
Wigan 008C |
163 |
114 |
133 |
136 |
37% |
34% |
35% |
9% |
19-Sep-09 |
22-Oct-10 |
1.1 |
98% |
27-Oct-09 |
33% |
38% |
Wigan 008D |
91 |
62 |
76 |
77 |
38% |
34% |
29% |
11% |
6-Sep-11 |
18-May-10 |
-1.3 |
118% |
2-Oct-09 |
21% |
18% |
Wigan 008E |
92 |
52 |
70 |
71 |
57% |
53% |
38% |
12% |
16-Nov-09 |
3-Sep-11 |
1.8 |
137% |
11-Apr-10 |
41% |
35% |
Wigan008 |
528 |
434 |
467 |
476 |
20% |
19% |
17% |
5% |
5-Nov-09 |
22-Dec-10 |
1.1 |
113% |
2-Nov-09 |
17% |
37% |
Wigan 009A |
195 |
132 |
162 |
174 |
39% |
22% |
34% |
8% |
19-Jun-09 |
16-Aug-10 |
1.2 |
64% |
16-Aug-09 |
27% |
35% |
Wigan 009B |
144 |
108 |
129 |
132 |
28% |
12% |
26% |
9% |
17-Aug-10 |
5-Apr-11 |
0.6 |
47% |
5-Apr-10 |
19% |
21% |
Wigan 009C |
277 |
189 |
224 |
244 |
39% |
13% |
26% |
7% |
11-Apr-09 |
22-Apr-10 |
1.0 |
47% |
22-Apr-09 |
19% |
28% |
Wigan 009D |
204 |
63 |
126 |
97 |
112% |
68% |
16% |
9% |
4-Jun-09 |
17-Mar-10 |
0.8 |
430% |
25-May-09 |
31% |
35% |
Wigan 009E |
128 |
98 |
117 |
114 |
26% |
18% |
25% |
9% |
20-Nov-10 |
20-Nov-09 |
-1.0 |
72% |
21-May-10 |
6% |
6% |
Wigan009 |
810 |
699 |
756 |
761 |
15% |
14% |
9% |
4% |
19-Jan-12 |
24-Mar-10 |
-1.8 |
146% |
27-May-09 |
10% |
27% |
Wigan 010A |
168 |
121 |
143 |
148 |
33% |
15% |
24% |
8% |
4-Jul-10 |
4-Aug-09 |
-0.9 |
60% |
17-May-10 |
7% |
8% |
Wigan 010B |
191 |
130 |
153 |
169 |
40% |
33% |
38% |
8% |
16-May-09 |
11-Jun-10 |
1.1 |
86% |
7-Jun-09 |
33% |
41% |
Wigan 010C |
248 |
175 |
196 |
204 |
37% |
13% |
32% |
7% |
26-Nov-10 |
2-Aug-09 |
-1.3 |
42% |
30-Jan-10 |
8% |
12% |
Wigan 010D |
223 |
114 |
163 |
165 |
67% |
59% |
56% |
8% |
16-Nov-09 |
8-Jan-11 |
1.1 |
105% |
12-Nov-09 |
57% |
73% |
Wigan 010E |
161 |
106 |
123 |
132 |
45% |
13% |
38% |
9% |
8-Jan-10 |
16-May-09 |
-0.6 |
35% |
8-Jan-10 |
15% |
16% |
Wigan010 |
863 |
703 |
778 |
818 |
21% |
12% |
19% |
4% |
27-Dec-09 |
11-Jan-11 |
1.0 |
66% |
8-Jan-10 |
15% |
43% |
Wigan 011A |
118 |
82 |
101 |
109 |
36% |
19% |
34% |
10% |
4-Jul-11 |
28-Jun-10 |
-1.0 |
56% |
21-Jun-09 |
22% |
22% |
Wigan 011B |
141 |
83 |
104 |
104 |
56% |
52% |
31% |
10% |
16-Mar-12 |
22-Jan-10 |
-2.1 |
169% |
13-Sep-09 |
13% |
13% |
Wigan 011C |
133 |
78 |
98 |
101 |
56% |
33% |
54% |
10% |
25-Apr-10 |
31-Mar-09 |
-1.1 |
60% |
22-Mar-10 |
32% |
31% |
Wigan 011D |
78 |
58 |
66 |
68 |
30% |
15% |
23% |
12% |
3-Jul-10 |
21-Jun-09 |
-1.0 |
67% |
31-May-10 |
11% |
9% |
Wigan 011E |
135 |
86 |
113 |
122 |
43% |
13% |
37% |
9% |
3-Jun-10 |
7-Jan-11 |
0.6 |
36% |
11-Jan-10 |
23% |
25% |
Wigan011 |
527 |
419 |
482 |
504 |
22% |
13% |
18% |
5% |
16-Mar-12 |
25-Dec-10 |
-1.2 |
75% |
25-Apr-10 |
10% |
22% |
Wigan 012A |
182 |
100 |
140 |
159 |
59% |
32% |
46% |
8% |
14-Sep-09 |
6-Nov-10 |
1.1 |
70% |
8-Oct-09 |
38% |
44% |
Wigan 012B |
176 |
134 |
159 |
166 |
26% |
13% |
18% |
8% |
13-Feb-11 |
13-Feb-10 |
-1.0 |
75% |
14-Sep-09 |
10% |
13% |
Wigan 012C |
182 |
132 |
156 |
159 |
32% |
19% |
26% |
8% |
5-Jan-11 |
9-Nov-09 |
-1.2 |
71% |
13-Apr-09 |
11% |
13% |
Wigan 012D |
198 |
96 |
147 |
170 |
69% |
5% |
39% |
8% |
29-Nov-10 |
29-Nov-11 |
1.0 |
12% |
20-May-10 |
6% |
7% |
Wigan 012E |
110 |
76 |
92 |
91 |
37% |
25% |
26% |
10% |
15-Jun-10 |
10-Mar-12 |
1.7 |
96% |
7-Jun-10 |
25% |
24% |
Wigan012 |
801 |
570 |
694 |
745 |
33% |
6% |
17% |
4% |
11-Apr-09 |
9-Jan-12 |
2.7 |
33% |
1-Apr-09 |
9% |
23% |
Wigan 013A |
133 |
89 |
116 |
108 |
38% |
33% |
35% |
9% |
1-Aug-10 |
4-Jun-09 |
-1.2 |
95% |
13-May-10 |
13% |
14% |
Wigan 013B |
159 |
104 |
134 |
140 |
41% |
37% |
23% |
9% |
26-Mar-12 |
5-Jun-11 |
-0.8 |
161% |
9-Jun-09 |
23% |
27% |
Wigan 013C |
181 |
106 |
152 |
172 |
49% |
31% |
45% |
8% |
28-Dec-11 |
10-Dec-10 |
-1.0 |
68% |
3-Dec-09 |
29% |
35% |
Wigan 013D |
122 |
68 |
94 |
92 |
57% |
46% |
53% |
10% |
10-Jul-10 |
9-Jul-09 |
-1.0 |
86% |
8-Jun-10 |
30% |
29% |
Wigan 013E |
81 |
52 |
65 |
68 |
45% |
23% |
35% |
12% |
26-Jun-11 |
26-Jul-10 |
-0.9 |
65% |
26-Jul-09 |
24% |
19% |
Wigan013 |
628 |
507 |
561 |
579 |
22% |
9% |
13% |
4% |
24-Mar-12 |
9-Apr-09 |
-3.0 |
67% |
23-Apr-10 |
7% |
17% |
Wigan 014A |
125 |
84 |
105 |
111 |
39% |
30% |
39% |
10% |
13-Jul-11 |
13-Jul-10 |
-1.0 |
76% |
19-Oct-09 |
32% |
33% |
Wigan 014B |
222 |
163 |
193 |
203 |
31% |
29% |
28% |
7% |
18-Mar-12 |
12-Sep-10 |
-1.5 |
102% |
27-Dec-09 |
19% |
26% |
Wigan 014C |
121 |
65 |
88 |
90 |
63% |
60% |
52% |
11% |
13-Oct-09 |
14-Apr-11 |
1.5 |
115% |
23-Dec-09 |
49% |
46% |
Wigan 014D |
139 |
103 |
119 |
120 |
30% |
23% |
22% |
9% |
11-Feb-12 |
31-Mar-08 |
-3.9 |
104% |
13-Sep-09 |
13% |
14% |
Wigan 014E |
107 |
67 |
85 |
81 |
47% |
34% |
28% |
11% |
1-Dec-11 |
19-Oct-09 |
-2.1 |
121% |
18-May-09 |
7% |
7% |
Wigan014 |
651 |
526 |
591 |
606 |
21% |
14% |
18% |
4% |
9-Mar-12 |
22-Aug-10 |
-1.5 |
79% |
16-Oct-09 |
15% |
36% |
Wigan 015A |
149 |
83 |
108 |
123 |
61% |
41% |
59% |
10% |
9-Apr-09 |
22-Apr-10 |
1.0 |
69% |
9-Apr-09 |
50% |
52% |
Wigan 015B |
221 |
153 |
186 |
184 |
37% |
36% |
30% |
7% |
28-Feb-10 |
8-Feb-11 |
0.9 |
118% |
27-Feb-10 |
31% |
43% |
Wigan 015C |
192 |
142 |
166 |
160 |
30% |
22% |
22% |
8% |
12-Jan-10 |
30-Jun-11 |
1.5 |
97% |
12-Jun-10 |
14% |
18% |
Wigan 015D |
345 |
197 |
256 |
293 |
58% |
16% |
47% |
6% |
20-Mar-12 |
16-Jan-10 |
-2.2 |
34% |
3-Jun-09 |
26% |
41% |
Wigan 015E |
190 |
127 |
156 |
171 |
40% |
10% |
28% |
8% |
3-Apr-09 |
9-Mar-10 |
0.9 |
35% |
3-Apr-09 |
17% |
21% |
Wigan 015 |
986 |
785 |
872 |
932 |
23% |
6% |
15% |
3% |
10-May-09 |
31-Dec-09 |
0.6 |
39% |
11-May-09 |
10% |
29% |
Wigan 016A |
161 |
111 |
141 |
151 |
35% |
14% |
27% |
8% |
29-Apr-09 |
19-Oct-11 |
2.5 |
53% |
13-Feb-10 |
13% |
15% |
Wigan 016B |
160 |
90 |
123 |
110 |
57% |
31% |
45% |
9% |
10-Feb-11 |
11-Feb-12 |
1.0 |
69% |
29-Sep-09 |
6% |
7% |
Wigan 016C |
137 |
96 |
113 |
118 |
36% |
16% |
27% |
9% |
25-Jan-11 |
20-Oct-09 |
-1.3 |
60% |
2-Apr-09 |
10% |
11% |
Wigan 016D |
41 |
21 |
32 |
35 |
63% |
63% |
54% |
18% |
8-Mar-12 |
29-Apr-10 |
-1.9 |
118% |
29-Apr-09 |
30% |
17% |
Wigan 016E |
200 |
137 |
174 |
173 |
36% |
20% |
31% |
8% |
4-Apr-09 |
23-Jan-12 |
2.8 |
66% |
24-May-10 |
19% |
25% |
Wigan016 |
623 |
502 |
582 |
586 |
21% |
10% |
19% |
4% |
31-Mar-09 |
3-Feb-12 |
2.8 |
53% |
12-Jun-10 |
7% |
17% |
Wigan 017A |
58 |
35 |
45 |
48 |
51% |
40% |
51% |
15% |
18-Jan-10 |
12-Jan-11 |
1.0 |
78% |
13-Jan-10 |
44% |
30% |
Wigan 017B |
51 |
11 |
29 |
32 |
136% |
95% |
120% |
18% |
12-Oct-09 |
16-Nov-10 |
1.1 |
79% |
12-Nov-09 |
102% |
55% |
Wigan 017C |
30 |
15 |
22 |
23 |
69% |
50% |
69% |
21% |
23-Sep-09 |
23-Sep-10 |
1.0 |
73% |
23-Sep-09 |
59% |
28% |
Wigan 017E |
55 |
26 |
39 |
45 |
74% |
36% |
69% |
16% |
17-Dec-10 |
16-Dec-09 |
-1.0 |
52% |
1-Jul-09 |
31% |
19% |
Wigan 017 |
170 |
105 |
136 |
148 |
48% |
22% |
48% |
9% |
13-Nov-09 |
16-Nov-10 |
1.0 |
46% |
16-Nov-09 |
35% |
41% |
Wigan 018A |
123 |
65 |
86 |
81 |
68% |
57% |
65% |
11% |
20-Jun-10 |
14-Jul-11 |
1.1 |
88% |
28-May-10 |
47% |
43% |
Wigan 018B |
141 |
93 |
119 |
125 |
40% |
27% |
40% |
9% |
12-May-10 |
19-Jul-11 |
1.2 |
67% |
12-May-10 |
29% |
32% |
Wigan 018C |
126 |
98 |
108 |
106 |
26% |
25% |
21% |
10% |
20-Jul-10 |
11-Jul-11 |
1.0 |
117% |
27-May-10 |
18% |
19% |
Wigan 018D |
78 |
39 |
62 |
56 |
63% |
55% |
55% |
13% |
25-Apr-10 |
15-Jan-12 |
1.7 |
100% |
25-Apr-10 |
35% |
27% |
Wigan 018E |
114 |
84 |
97 |
96 |
31% |
29% |
23% |
10% |
19-Oct-11 |
19-Feb-10 |
-1.7 |
127% |
7-Apr-09 |
16% |
16% |
Wigan 018F |
90 |
49 |
67 |
74 |
61% |
42% |
58% |
12% |
9-Jul-09 |
29-Aug-10 |
1.1 |
72% |
13-Jul-09 |
48% |
40% |
Wigan 018G |
77 |
47 |
60 |
62 |
50% |
40% |
50% |
13% |
21-Apr-10 |
21-Apr-09 |
-1.0 |
80% |
21-Apr-10 |
37% |
29% |
Wigan 018 |
669 |
531 |
598 |
599 |
23% |
20% |
18% |
4% |
12-Dec-09 |
15-Jul-11 |
1.6 |
112% |
12-Dec-09 |
17% |
41% |
Wigan 019A |
113 |
69 |
96 |
91 |
46% |
45% |
36% |
10% |
10-Nov-10 |
9-Jul-09 |
-1.3 |
126% |
15-Apr-09 |
4% |
4% |
Wigan 019B |
78 |
48 |
66 |
69 |
45% |
45% |
36% |
12% |
26-Nov-11 |
24-Aug-10 |
-1.3 |
125% |
24-Aug-09 |
26% |
21% |
Wigan 019C |
136 |
97 |
115 |
119 |
34% |
21% |
32% |
9% |
23-Jan-10 |
23-Jan-11 |
1.0 |
65% |
23-Jan-10 |
27% |
28% |
Wigan 019D |
90 |
56 |
73 |
69 |
46% |
41% |
26% |
12% |
24-Aug-11 |
24-Aug-10 |
-1.0 |
158% |
24-Aug-09 |
24% |
20% |
Wigan 019E |
100 |
52 |
76 |
84 |
63% |
37% |
53% |
11% |
4-Dec-09 |
26-Oct-10 |
0.9 |
70% |
4-Dec-09 |
43% |
38% |
Wigan 019 |
454 |
392 |
426 |
432 |
15% |
13% |
14% |
5% |
18-Sep-11 |
11-Aug-10 |
-1.1 |
92% |
24-Aug-09 |
11% |
24% |
Wigan 020A |
103 |
75 |
92 |
93 |
30% |
30% |
21% |
10% |
1-Apr-09 |
22-Mar-11 |
2.0 |
147% |
1-Apr-09 |
20% |
19% |
Wigan 020B |
75 |
49 |
59 |
64 |
44% |
12% |
32% |
13% |
7-Nov-11 |
11-Jun-09 |
-2.4 |
37% |
26-Sep-09 |
11% |
8% |
Wigan 020C |
137 |
76 |
103 |
111 |
59% |
48% |
35% |
10% |
16-Sep-09 |
27-Apr-11 |
1.6 |
139% |
15-Sep-09 |
40% |
40% |
Wigan 020D |
96 |
61 |
77 |
77 |
46% |
33% |
33% |
11% |
22-Oct-11 |
10-Mar-10 |
-1.6 |
100% |
25-Apr-09 |
10% |
9% |
Wigan 020E |
92 |
45 |
66 |
58 |
71% |
49% |
32% |
12% |
13-Jun-11 |
8-Apr-09 |
-2.2 |
152% |
13-Jul-09 |
21% |
17% |
Wigan 020 |
443 |
369 |
397 |
404 |
19% |
16% |
13% |
5% |
6-Mar-12 |
15-Sep-10 |
-1.5 |
127% |
15-Sep-09 |
12% |
24% |
Wigan 021A |
83 |
46 |
65 |
67 |
57% |
43% |
52% |
12% |
20-Mar-12 |
19-Mar-11 |
-1.0 |
82% |
20-Mar-10 |
45% |
36% |
Wigan 021B |
98 |
51 |
75 |
79 |
63% |
51% |
47% |
12% |
1-Feb-12 |
3-Aug-10 |
-1.5 |
109% |
6-Aug-09 |
25% |
21% |
Wigan 021C |
65 |
30 |
50 |
45 |
71% |
58% |
34% |
14% |
24-Sep-09 |
21-Sep-11 |
2.0 |
171% |
4-Mar-10 |
37% |
26% |
Wigan 021D |
53 |
26 |
40 |
42 |
67% |
40% |
67% |
16% |
8-Jul-10 |
16-Jul-11 |
1.0 |
59% |
25-May-10 |
42% |
27% |
Wigan 021E |
79 |
53 |
65 |
66 |
40% |
35% |
38% |
12% |
7-Feb-11 |
3-Feb-12 |
1.0 |
92% |
26-May-09 |
16% |
13% |
Wigan 021F |
69 |
31 |
54 |
57 |
71% |
30% |
56% |
14% |
24-Feb-10 |
30-Nov-11 |
1.8 |
53% |
24-Feb-10 |
32% |
23% |
Wigan 021G |
100 |
69 |
81 |
85 |
38% |
27% |
32% |
11% |
22-Oct-09 |
17-Oct-10 |
1.0 |
85% |
22-Oct-09 |
30% |
27% |
Wigan 021 |
484 |
400 |
430 |
441 |
20% |
14% |
17% |
5% |
5-Sep-09 |
10-Sep-10 |
1.0 |
84% |
5-Sep-09 |
15% |
32% |
Wigan 022C |
40 |
14 |
29 |
28 |
89% |
89% |
65% |
19% |
27-Feb-11 |
11-Feb-10 |
-1.0 |
137% |
28-Apr-09 |
21% |
11% |
Wigan 022D |
36 |
25 |
31 |
31 |
36% |
23% |
29% |
18% |
14-Jun-11 |
28-Jun-10 |
-1.0 |
78% |
31-Mar-09 |
23% |
13% |
Wigan 022 |
74 |
42 |
60 |
59 |
53% |
53% |
43% |
13% |
27-Feb-11 |
26-Feb-10 |
-1.0 |
123% |
31-Mar-09 |
19% |
15% |
Wigan 023A |
47 |
18 |
31 |
37 |
93% |
26% |
61% |
18% |
31-Mar-12 |
9-Jul-11 |
-0.7 |
42% |
11-Jun-10 |
24% |
13% |
Wigan 023B |
53 |
21 |
37 |
36 |
87% |
84% |
73% |
16% |
17-Sep-09 |
29-Nov-11 |
2.2 |
115% |
1-Sep-09 |
53% |
32% |
Wigan 023C |
48 |
19 |
32 |
30 |
91% |
75% |
63% |
18% |
1-Oct-11 |
15-May-10 |
-1.4 |
120% |
24-Apr-09 |
58% |
33% |
Wigan 023D |
45 |
18 |
29 |
25 |
95% |
95% |
32% |
19% |
17-Aug-11 |
15-Jul-10 |
-1.1 |
300% |
21-Apr-09 |
16% |
8% |
Wigan 023 |
150 |
110 |
129 |
128 |
31% |
26% |
25% |
9% |
8-Jan-11 |
29-Nov-11 |
0.9 |
106% |
26-May-09 |
21% |
23% |
Wigan 024A |
136 |
97 |
115 |
119 |
34% |
22% |
26% |
9% |
7-Jun-11 |
7-Jun-10 |
-1.0 |
83% |
7-Jun-09 |
18% |
20% |
Wigan 024B |
184 |
118 |
150 |
167 |
44% |
21% |
38% |
8% |
22-Aug-11 |
26-Sep-10 |
-0.9 |
56% |
30-Sep-09 |
21% |
26% |
Wigan 024C |
143 |
111 |
128 |
126 |
25% |
20% |
20% |
9% |
13-Oct-09 |
15-Oct-10 |
1.0 |
100% |
15-Oct-09 |
20% |
23% |
Wigan 024D |
100 |
80 |
91 |
91 |
22% |
22% |
18% |
11% |
30-May-10 |
16-May-11 |
1.0 |
125% |
5-May-10 |
19% |
18% |
Wigan 024E |
72 |
43 |
59 |
61 |
49% |
37% |
44% |
13% |
8-Jul-11 |
16-Sep-10 |
-0.8 |
85% |
29-Sep-09 |
38% |
29% |
Wigan 024 |
596 |
493 |
542 |
564 |
19% |
9% |
19% |
4% |
16-Sep-11 |
30-Sep-10 |
-1.0 |
49% |
3-Sep-09 |
14% |
32% |
Wigan 025A |
39 |
14 |
24 |
29 |
105% |
51% |
80% |
21% |
21-Mar-12 |
3-Jan-10 |
-2.2 |
63% |
31-Mar-09 |
40% |
20% |
Wigan 025B |
29 |
13 |
21 |
23 |
77% |
39% |
53% |
22% |
28-Apr-10 |
28-Jun-11 |
1.2 |
73% |
28-Apr-10 |
41% |
19% |
Wigan 025C |
39 |
17 |
28 |
29 |
79% |
40% |
69% |
19% |
12-Dec-10 |
10-Nov-09 |
-1.1 |
58% |
13-Jun-10 |
36% |
19% |
Wigan 025 |
101 |
46 |
72 |
81 |
76% |
24% |
54% |
12% |
27-Mar-12 |
3-Jan-10 |
-2.2 |
44% |
2-May-10 |
19% |
16% |
Wigan 026A |
96 |
55 |
76 |
76 |
54% |
49% |
45% |
12% |
13-Nov-11 |
10-Jul-10 |
-1.3 |
109% |
12-Jul-09 |
40% |
35% |
Wigan 026B |
91 |
55 |
74 |
70 |
48% |
34% |
31% |
12% |
6-Jul-11 |
17-Feb-10 |
-1.4 |
109% |
11-May-09 |
28% |
24% |
Wigan 026C |
109 |
66 |
83 |
93 |
52% |
42% |
46% |
11% |
8-Apr-09 |
17-Jul-10 |
1.3 |
92% |
7-Sep-09 |
40% |
36% |
Wigan 026D |
103 |
73 |
88 |
89 |
34% |
34% |
23% |
11% |
21-Dec-11 |
9-Nov-09 |
-2.1 |
150% |
7-Apr-10 |
11% |
11% |
Wigan 026E |
140 |
67 |
104 |
117 |
70% |
49% |
45% |
10% |
31-Mar-09 |
14-Apr-10 |
1.0 |
109% |
10-Apr-09 |
45% |
46% |
Wigan 026 |
488 |
375 |
424 |
445 |
27% |
24% |
26% |
5% |
12-Apr-09 |
12-Jun-10 |
1.2 |
90% |
15-Apr-09 |
23% |
48% |
Wigan 027A |
165 |
85 |
127 |
143 |
63% |
13% |
41% |
9% |
30-Mar-12 |
7-Nov-11 |
-0.4 |
33% |
7-Apr-10 |
23% |
26% |
Wigan 027B |
109 |
70 |
92 |
84 |
43% |
39% |
22% |
10% |
8-Apr-10 |
11-Dec-10 |
0.7 |
180% |
11-Dec-09 |
27% |
26% |
Wigan 027C |
137 |
89 |
112 |
122 |
43% |
25% |
30% |
9% |
3-Aug-11 |
30-Jul-10 |
-1.0 |
82% |
6-Jan-10 |
16% |
17% |
Wigan 027D |
170 |
119 |
148 |
150 |
34% |
22% |
30% |
8% |
20-Sep-10 |
24-Nov-11 |
1.2 |
75% |
7-May-10 |
13% |
16% |
Wigan 027E |
64 |
31 |
48 |
51 |
69% |
57% |
63% |
14% |
20-Jan-12 |
20-Jan-11 |
-1.0 |
90% |
18-Aug-09 |
48% |
33% |
Wigan 027 |
582 |
464 |
527 |
550 |
22% |
11% |
21% |
4% |
4-Apr-10 |
31-Mar-11 |
1.0 |
50% |
5-Apr-10 |
16% |
36% |
Wigan 028A |
34 |
19 |
26 |
24 |
58% |
58% |
43% |
20% |
26-Feb-11 |
4-Nov-11 |
0.7 |
136% |
1-Sep-09 |
19% |
10% |
Wigan 029D |
30 |
13 |
21 |
17 |
81% |
53% |
53% |
22% |
24-Mar-11 |
5-Feb-12 |
0.9 |
100% |
4-Jun-10 |
12% |
5% |
Wigan 030A |
88 |
59 |
73 |
70 |
40% |
26% |
27% |
12% |
23-Oct-11 |
9-Aug-11 |
-0.2 |
95% |
30-May-10 |
12% |
10% |
Wigan 030B |
122 |
74 |
99 |
108 |
48% |
36% |
44% |
10% |
23-Nov-11 |
26-Nov-10 |
-1.0 |
82% |
11-Sep-09 |
35% |
35% |
Wigan 030C |
89 |
47 |
71 |
79 |
59% |
49% |
53% |
12% |
28-Jul-11 |
16-Jun-10 |
-1.1 |
92% |
20-Jun-09 |
32% |
27% |
Wigan 030D |
85 |
47 |
64 |
59 |
60% |
47% |
38% |
13% |
11-Sep-10 |
4-Oct-11 |
1.1 |
125% |
7-Apr-09 |
20% |
16% |
Wigan 030 |
335 |
277 |
307 |
315 |
19% |
17% |
14% |
6% |
19-Oct-11 |
4-Jul-10 |
-1.3 |
118% |
6-May-09 |
11% |
19% |
Wigan 031A |
126 |
63 |
86 |
83 |
73% |
73% |
56% |
11% |
6-Mar-10 |
5-Jan-11 |
0.8 |
131% |
6-Mar-10 |
63% |
59% |
Wigan 031B |
89 |
49 |
70 |
75 |
57% |
19% |
36% |
12% |
24-Jan-11 |
9-Jul-09 |
-1.5 |
52% |
1-Jun-10 |
13% |
11% |
Wigan 031C |
82 |
50 |
67 |
74 |
48% |
25% |
42% |
12% |
9-Oct-11 |
29-Sep-10 |
-1.0 |
61% |
23-Aug-09 |
25% |
21% |
Wigan 031D |
57 |
27 |
41 |
33 |
74% |
49% |
25% |
16% |
8-May-11 |
26-Mar-12 |
0.9 |
200% |
13-Apr-09 |
15% |
9% |
Wigan 031E |
385 |
259 |
333 |
350 |
38% |
32% |
36% |
5% |
4-Feb-12 |
6-Jan-11 |
-1.1 |
88% |
15-Jan-10 |
27% |
50% |
Wigan 032A |
108 |
73 |
88 |
86 |
40% |
27% |
27% |
11% |
12-Aug-11 |
19-Dec-09 |
-1.6 |
100% |
23-Jul-09 |
11% |
11% |
Wigan 032B |
85 |
59 |
70 |
72 |
37% |
31% |
37% |
12% |
30-Nov-09 |
11-Oct-10 |
0.9 |
85% |
12-Oct-09 |
33% |
27% |
Wigan 032C |
112 |
68 |
92 |
85 |
48% |
28% |
22% |
10% |
13-May-09 |
8-Mar-12 |
2.8 |
130% |
10-May-09 |
10% |
10% |
Wigan 032D |
204 |
131 |
167 |
178 |
44% |
28% |
37% |
8% |
20-Jun-09 |
13-Oct-10 |
1.3 |
77% |
16-Oct-09 |
31% |
41% |
Wigan 032E |
103 |
67 |
87 |
88 |
41% |
29% |
28% |
11% |
4-Apr-09 |
11-Jul-11 |
2.3 |
104% |
31-May-10 |
22% |
21% |
Wigan 033A |
98 |
60 |
76 |
82 |
50% |
26% |
30% |
11% |
14-Aug-11 |
22-Apr-09 |
-2.3 |
87% |
3-Sep-09 |
10% |
9% |
Wigan 033B |
119 |
79 |
99 |
106 |
40% |
18% |
26% |
10% |
2-Aug-11 |
14-Jan-10 |
-1.5 |
69% |
27-May-09 |
19% |
19% |
Wigan 033C |
79 |
35 |
62 |
56 |
71% |
69% |
34% |
13% |
17-Nov-09 |
11-Jun-11 |
1.6 |
205% |
10-Jan-10 |
45% |
35% |
Wigan 033D |
113 |
61 |
92 |
88 |
57% |
40% |
36% |
10% |
25-Jun-09 |
30-Sep-10 |
1.3 |
112% |
13-Sep-09 |
38% |
36% |
Wigan 033E |
241 |
150 |
190 |
204 |
48% |
32% |
28% |
7% |
21-Dec-11 |
13-Jul-09 |
-2.4 |
113% |
13-Jun-10 |
12% |
16% |
Wigan 034A |
98 |
53 |
74 |
83 |
61% |
22% |
41% |
12% |
15-Dec-10 |
15-Dec-09 |
-1.0 |
53% |
3-Apr-09 |
24% |
21% |
Wigan 034B |
68 |
42 |
54 |
54 |
48% |
46% |
39% |
14% |
17-Jun-10 |
17-Jun-11 |
1.0 |
119% |
12-Jun-10 |
37% |
27% |
Wigan 034C |
64 |
37 |
48 |
47 |
57% |
57% |
25% |
15% |
21-Oct-11 |
17-Aug-09 |
-2.2 |
225% |
23-May-10 |
17% |
12% |
Wigan 034D |
98 |
62 |
80 |
81 |
45% |
27% |
40% |
11% |
24-Sep-09 |
10-Jun-11 |
1.7 |
69% |
1-Jun-10 |
31% |
27% |
Wigan 034E |
95 |
64 |
75 |
75 |
41% |
31% |
29% |
12% |
2-Mar-12 |
19-Oct-11 |
-0.4 |
105% |
25-May-09 |
11% |
10% |
Wigan 035A |
245 |
159 |
205 |
189 |
42% |
38% |
32% |
7% |
11-Jun-10 |
27-Mar-12 |
1.8 |
118% |
20-May-10 |
26% |
37% |
Wigan 035B |
96 |
47 |
69 |
68 |
71% |
71% |
38% |
12% |
28-Sep-11 |
7-Nov-10 |
-0.9 |
188% |
18-Nov-09 |
25% |
21% |
Wigan 035C |
87 |
55 |
74 |
69 |
43% |
41% |
20% |
12% |
20-Feb-10 |
2-Apr-09 |
-0.9 |
200% |
13-Feb-10 |
24% |
21% |
Wigan 035D |
43 |
27 |
35 |
34 |
46% |
35% |
40% |
17% |
1-Nov-11 |
30-Oct-09 |
-2.0 |
86% |
28-May-10 |
13% |
8% |
Wigan 035E |
107 |
63 |
82 |
84 |
54% |
46% |
28% |
11% |
14-Sep-09 |
24-Mar-12 |
2.5 |
165% |
14-Sep-09 |
37% |
33% |
Wigan 036A |
175 |
114 |
142 |
131 |
43% |
27% |
20% |
8% |
7-Nov-10 |
19-Oct-09 |
-1.1 |
136% |
31-Mar-09 |
2% |
2% |
Wigan 036B |
149 |
100 |
127 |
131 |
39% |
25% |
31% |
9% |
26-Oct-09 |
18-May-11 |
1.6 |
82% |
26-Oct-09 |
19% |
22% |
Wigan 036C |
175 |
128 |
152 |
146 |
31% |
22% |
25% |
8% |
20-Mar-10 |
14-May-09 |
-0.8 |
89% |
18-Mar-10 |
12% |
15% |
Wigan 036D |
64 |
31 |
44 |
38 |
75% |
64% |
21% |
15% |
12-Sep-11 |
6-May-10 |
-1.4 |
311% |
28-Aug-09 |
16% |
11% |
Wigan 036E |
97 |
51 |
71 |
79 |
65% |
17% |
37% |
12% |
31-Mar-12 |
24-Dec-09 |
-2.3 |
46% |
24-Apr-10 |
20% |
17% |
Wigan 036 |
583 |
502 |
535 |
526 |
15% |
11% |
11% |
4% |
15-Aug-11 |
18-Feb-12 |
0.5 |
100% |
28-Apr-09 |
2% |
4% |
Wigan 037A |
92 |
53 |
73 |
76 |
53% |
52% |
33% |
12% |
5-Jun-09 |
8-Aug-10 |
1.2 |
158% |
28-May-09 |
40% |
34% |
Wigan 037B |
106 |
63 |
85 |
91 |
51% |
38% |
49% |
11% |
3-Jan-12 |
29-Nov-10 |
-1.1 |
76% |
3-Dec-09 |
38% |
35% |
Wigan 037C |
79 |
38 |
52 |
59 |
79% |
15% |
70% |
14% |
9-Jan-11 |
29-Aug-09 |
-1.4 |
22% |
n/a |
0% |
0% |
Wigan 037D |
85 |
44 |
61 |
61 |
67% |
62% |
62% |
13% |
29-Dec-09 |
12-Apr-11 |
1.3 |
100% |
29-Dec-09 |
57% |
45% |
Wigan 037E |
59 |
31 |
47 |
43 |
59% |
38% |
23% |
15% |
15-Apr-09 |
18-Feb-12 |
2.8 |
164% |
15-Apr-09 |
21% |
15% |
Wigan 037 |
365 |
284 |
319 |
329 |
25% |
16% |
24% |
6% |
4-Jun-09 |
28-Dec-10 |
1.6 |
67% |
30-Dec-09 |
20% |
35% |
Wigan 038A |
87 |
60 |
73 |
70 |
37% |
28% |
29% |
12% |
10-Jul-11 |
6-Mar-12 |
0.7 |
95% |
26-Aug-09 |
21% |
18% |
Wigan 038B |
80 |
48 |
66 |
66 |
49% |
36% |
43% |
12% |
1-Jul-11 |
31-Jan-10 |
-1.4 |
86% |
31-Mar-09 |
7% |
6% |
Wigan 038C |
115 |
74 |
93 |
88 |
44% |
42% |
35% |
10% |
13-Feb-10 |
18-Feb-11 |
1.0 |
122% |
18-Feb-10 |
37% |
36% |
Wigan 038D |
144 |
107 |
130 |
132 |
28% |
18% |
22% |
9% |
21-Oct-09 |
13-Mar-12 |
2.4 |
82% |
3-Nov-09 |
17% |
19% |
Wigan 038E |
114 |
69 |
93 |
88 |
48% |
40% |
39% |
10% |
5-Feb-10 |
5-Feb-11 |
1.0 |
103% |
5-Feb-10 |
39% |
38% |
Wigan 038 |
494 |
407 |
454 |
444 |
19% |
16% |
11% |
5% |
1-Sep-09 |
8-Apr-11 |
1.6 |
143% |
11-Apr-10 |
12% |
27% |
Wigan 039A |
78 |
42 |
64 |
64 |
56% |
44% |
37% |
12% |
8-Apr-09 |
1-Oct-10 |
1.5 |
117% |
1-Oct-09 |
37% |
29% |
Wigan 039B |
100 |
68 |
81 |
78 |
39% |
36% |
36% |
11% |
9-Jul-10 |
6-Apr-09 |
-1.3 |
100% |
10-Jun-10 |
25% |
22% |
Wigan 039C |
55 |
27 |
42 |
40 |
67% |
52% |
45% |
15% |
4-Oct-09 |
25-Feb-12 |
2.4 |
116% |
14-Oct-09 |
44% |
29% |
Wigan 039D |
101 |
51 |
74 |
74 |
68% |
64% |
45% |
12% |
24-Mar-12 |
4-May-11 |
-0.9 |
142% |
5-May-10 |
32% |
27% |
Wigan 039 |
290 |
220 |
261 |
256 |
27% |
17% |
18% |
6% |
7-Oct-09 |
20-Mar-11 |
1.4 |
92% |
20-Mar-10 |
16% |
27% |
Wigan 039E |
79 |
44 |
58 |
64 |
60% |
10% |
38% |
13% |
29-Mar-12 |
15-Jan-10 |
-2.2 |
27% |
5-Aug-09 |
12% |
9% |
Wigan 040A |
60 |
26 |
43 |
52 |
79% |
35% |
63% |
15% |
2-Apr-09 |
2-Jul-10 |
1.2 |
56% |
3-Jul-09 |
42% |
28% |
Wigan 040B |
73 |
41 |
58 |
65 |
55% |
36% |
41% |
13% |
28-May-09 |
3-Sep-10 |
1.3 |
88% |
28-May-09 |
34% |
26% |
Wigan 040C |
83 |
46 |
65 |
65 |
57% |
56% |
54% |
12% |
14-Dec-11 |
27-Dec-10 |
-1.0 |
103% |
27-Dec-09 |
46% |
37% |
Wigan 040D |
189 |
101 |
140 |
127 |
63% |
48% |
26% |
8% |
27-Dec-11 |
7-Jan-11 |
-1.0 |
181% |
16-Dec-09 |
28% |
33% |
Wigan 040E |
71 |
38 |
52 |
48 |
64% |
50% |
37% |
14% |
30-Aug-11 |
6-Dec-09 |
-1.7 |
137% |
23-Feb-10 |
6% |
4% |
Wigan 040 |
415 |
299 |
358 |
357 |
32% |
30% |
23% |
5% |
24-Nov-11 |
16-Dec-10 |
-0.9 |
130% |
22-Jan-10 |
19% |
37% |
Table S3: Demographic and social group characteristics for Wigan LSOA
| LSOA Code
|
LSOA Name
|
LSOA type and social classification
|
Population Details
|
Admissions
|
Step-change STDEV
|
| Urban Type
|
OAC Code
|
OAC Type
|
IMD
|
Population Density
|
Aged 70+ (%)
|
Max
|
Min
|
Step-up
|
Step-down
|
Max
|
E01006231 |
Wigan 004A |
Rural town and fringe |
1.2a |
Rural Economiesa |
19 |
2 |
13% |
101 |
58 |
5.1 |
1.1 |
5.1 |
E01006232 |
Wigan 004B |
Urban major conurbation |
1.2a |
Rural Economiesa |
8 |
2 |
11% |
101 |
60 |
3.1 |
3.6 |
3.6 |
E01006277 |
Wigan 016D |
Urban major conurbation |
3.1a |
Urban Commutera |
6 |
26 |
3% |
41 |
21 |
5.3 |
2.4 |
5.3 |
E01006395 |
Wigan 021C |
Urban major conurbation |
3.1a |
Urban Commutera |
5 |
10 |
3% |
65 |
30 |
6.8 |
1.9 |
6.8 |
E01006400 |
Wigan 021D |
Urban major conurbation |
3.1a |
Urban Commutera |
9 |
24 |
3% |
53 |
26 |
2.7 |
3.2 |
3.2 |
E01006224 |
Wigan 035D |
Urban major conurbation |
3.1a |
Urban Commutera |
8 |
40 |
2% |
43 |
27 |
2.3 |
2.0 |
2.3 |
E01006343 |
Wigan 039C |
Urban major conurbation |
3.1a |
Urban Commutera |
7 |
50 |
4% |
55 |
27 |
4.5 |
2.5 |
4.5 |
E01006321 |
Wigan 003G |
Urban city and town |
3.1b |
Urban Commuterb |
6 |
40 |
8% |
80 |
26 |
5.2 |
4.7 |
5.2 |
E01006315 |
Wigan 001A |
Urban major conurbation |
3.1b |
Urban Commuterb |
8 |
5 |
13% |
109 |
54 |
6.4 |
3.8 |
6.4 |
E01006233 |
Wigan 002C |
Urban major conurbation |
3.1b |
Urban Commuterb |
7 |
17 |
13% |
120 |
74 |
3.3 |
2.4 |
3.3 |
E01006318 |
Wigan 003E |
Urban major conurbation |
3.1b |
Urban Commuterb |
14 |
23 |
14% |
98 |
64 |
2.5 |
2.3 |
2.5 |
E01006320 |
Wigan 003F |
Urban major conurbation |
3.1b |
Urban Commuterb |
7 |
9 |
10% |
68 |
33 |
3.7 |
1.4 |
3.7 |
E01006372 |
Wigan 006B |
Urban major conurbation |
3.1b |
Urban Commuterb |
5 |
21 |
17% |
157 |
115 |
3.9 |
2.3 |
3.9 |
E01006363 |
Wigan 018B |
Urban major conurbation |
3.1b |
Urban Commuterb |
12 |
39 |
26% |
141 |
93 |
3.3 |
3.7 |
3.7 |
E01006393 |
Wigan 021A |
Urban major conurbation |
3.1b |
Urban Commuterb |
8 |
57 |
8% |
83 |
46 |
4.9 |
3.4 |
4.9 |
E01006394 |
Wigan 021B |
Urban major conurbation |
3.1b |
Urban Commuterb |
9 |
26 |
14% |
98 |
51 |
5.7 |
3.5 |
5.7 |
E01006402 |
Wigan 021F |
Urban major conurbation |
3.1b |
Urban Commuterb |
8 |
60 |
8% |
69 |
31 |
2.2 |
3.6 |
3.6 |
E01006403 |
Wigan 021G |
Urban major conurbation |
3.1b |
Urban Commuterb |
12 |
37 |
10% |
100 |
69 |
2.6 |
2.4 |
2.6 |
E01006330 |
Wigan 031C |
Urban major conurbation |
3.1b |
Urban Commuterb |
10 |
42 |
11% |
82 |
50 |
2.8 |
2.9 |
2.9 |
E01006331 |
Wigan 031D |
Urban major conurbation |
3.1b |
Urban Commuterb |
14 |
27 |
8% |
57 |
27 |
4.1 |
1.7 |
4.1 |
E01006263 |
Wigan 032B |
Urban major conurbation |
3.1b |
Urban Commuterb |
9 |
30 |
16% |
85 |
59 |
3.1 |
2.6 |
3.1 |
E01006222 |
Wigan 035C |
Urban major conurbation |
3.1b |
Urban Commuterb |
12 |
24 |
11% |
87 |
55 |
4.7 |
1.8 |
4.7 |
E01006264 |
Wigan 036D |
Urban major conurbation |
3.1b |
Urban Commuterb |
7 |
41 |
8% |
64 |
31 |
5.1 |
1.4 |
5.1 |
E01006300 |
Wigan 037D |
Urban major conurbation |
3.1b |
Urban Commuterb |
8 |
39 |
21% |
85 |
44 |
6.3 |
3.5 |
6.3 |
E01006301 |
Wigan 037E |
Urban major conurbation |
3.1b |
Urban Commuterb |
10 |
10 |
11% |
59 |
31 |
4.0 |
1.4 |
4.0 |
E01006339 |
Wigan 039A |
Urban major conurbation |
3.1b |
Urban Commuterb |
13 |
32 |
12% |
78 |
42 |
5.2 |
2.5 |
5.2 |
E01006348 |
Wigan 039E |
Urban major conurbation |
3.1b |
Urban Commuterb |
11 |
3 |
16% |
79 |
44 |
1.0 |
2.3 |
2.3 |
E01006347 |
Wigan 040E |
Urban major conurbation |
3.1b |
Urban Commuterb |
7 |
42 |
16% |
71 |
38 |
4.2 |
2.4 |
4.2 |
E01006230 |
Wigan 002B |
Urban major conurbation |
3.2b |
Affluent Urban Commuterb |
8 |
15 |
12% |
76 |
48 |
3.2 |
2.9 |
3.2 |
E01006236 |
Wigan 007A |
Rural village and dispersed |
4.1a |
Well off Mature Householdsa |
11 |
3 |
13% |
89 |
52 |
4.5 |
2.5 |
4.5 |
E01006312 |
Wigan 003B |
Urban city and town |
4.1a |
Well off Mature Householdsa |
7 |
30 |
14% |
98 |
56 |
3.6 |
2.7 |
3.6 |
E01006316 |
Wigan 001B |
Urban major conurbation |
4.1a |
Well off Mature Householdsa |
10 |
11 |
10% |
74 |
34 |
6.2 |
3.4 |
6.2 |
E01006229 |
Wigan 002A |
Urban major conurbation |
4.1a |
Well off Mature Householdsa |
11 |
6 |
18% |
152 |
98 |
1.5 |
2.7 |
2.7 |
E01006314 |
Wigan 003D |
Urban major conurbation |
4.1a |
Well off Mature Householdsa |
8 |
7 |
17% |
151 |
66 |
5.5 |
5.7 |
5.7 |
E01006255 |
Wigan 005C |
Urban major conurbation |
4.1a |
Well off Mature Householdsa |
13 |
58 |
14% |
92 |
60 |
3.4 |
2.9 |
3.4 |
E01006373 |
Wigan 006C |
Urban major conurbation |
4.1a |
Well off Mature Householdsa |
8 |
54 |
13% |
98 |
42 |
3.8 |
3.3 |
3.8 |
E01006258 |
Wigan 008B |
Urban major conurbation |
4.1a |
Well off Mature Householdsa |
17 |
53 |
14% |
136 |
95 |
3.5 |
2.9 |
3.5 |
E01006271 |
Wigan 013B |
Urban major conurbation |
4.1a |
Well off Mature Householdsa |
17 |
17 |
12% |
159 |
104 |
5.3 |
2.7 |
5.3 |
E01006362 |
Wigan 018A |
Urban major conurbation |
4.1a |
Well off Mature Householdsa |
9 |
10 |
15% |
123 |
65 |
6.3 |
4.2 |
6.3 |
E01006367 |
Wigan 018F |
Urban major conurbation |
4.1a |
Well off Mature Householdsa |
10 |
27 |
16% |
90 |
49 |
3.8 |
3.6 |
3.8 |
E01006281 |
Wigan 019D |
Urban major conurbation |
4.1a |
Well off Mature Householdsa |
10 |
27 |
9% |
90 |
56 |
4.3 |
2.1 |
4.3 |
E01006243 |
Wigan 023B |
Urban major conurbation |
4.1a |
Well off Mature Householdsa |
16 |
13 |
10% |
53 |
21 |
9.0 |
3.2 |
9.0 |
E01006252 |
Wigan 034C |
Urban major conurbation |
4.1a |
Well off Mature Householdsa |
13 |
57 |
13% |
64 |
37 |
5.0 |
1.7 |
5.0 |
E01006225 |
Wigan 036B |
Urban major conurbation |
4.1a |
Well off Mature Householdsa |
14 |
27 |
19% |
149 |
100 |
3.2 |
3.2 |
3.2 |
E01006299 |
Wigan 037C |
Urban major conurbation |
4.1a |
Well off Mature Householdsa |
14 |
10 |
9% |
79 |
38 |
1.5 |
3.4 |
3.4 |
E01006345 |
Wigan 039D |
Urban major conurbation |
4.1a |
Well off Mature Householdsa |
10 |
51 |
15% |
101 |
51 |
7.5 |
3.3 |
7.5 |
E01006302 |
Wigan 040A |
Urban major conurbation |
4.1a |
Well off Mature Householdsa |
12 |
15 |
6% |
60 |
26 |
2.2 |
3.0 |
3.0 |
E01006374 |
Wigan 006D |
Urban major conurbation |
4.1b |
Well off Mature Householdsb |
15 |
40 |
16% |
102 |
47 |
7.4 |
3.8 |
7.4 |
E01006355 |
Wigan 014C |
Urban major conurbation |
4.1b |
Well off Mature Householdsb |
21 |
68 |
11% |
121 |
65 |
7.7 |
3.9 |
7.7 |
E01006266 |
Wigan 032C |
Urban major conurbation |
4.1b |
Well off Mature Householdsb |
14 |
38 |
18% |
112 |
68 |
3.0 |
1.8 |
3.0 |
E01006226 |
Wigan 035E |
Urban major conurbation |
4.1b |
Well off Mature Householdsb |
16 |
27 |
10% |
107 |
63 |
5.0 |
2.4 |
5.0 |
E01006256 |
Wigan 005D |
Urban major conurbation |
4.2a |
Young Urban Familiesa |
23 |
36 |
10% |
96 |
43 |
5.4 |
4.4 |
5.4 |
E01006396 |
Wigan 011B |
Urban major conurbation |
4.2a |
Young Urban Familiesa |
15 |
6 |
10% |
141 |
83 |
6.4 |
2.7 |
6.4 |
E01006276 |
Wigan 013E |
Urban major conurbation |
4.2a |
Young Urban Familiesa |
16 |
23 |
6% |
81 |
52 |
2.2 |
2.5 |
2.5 |
E01006286 |
Wigan 016E |
Urban major conurbation |
4.2a |
Young Urban Familiesa |
23 |
43 |
16% |
200 |
137 |
3.0 |
3.7 |
3.7 |
E01006279 |
Wigan 019B |
Urban major conurbation |
4.2a |
Young Urban Familiesa |
12 |
41 |
7% |
78 |
48 |
5.1 |
2.6 |
5.1 |
E01006285 |
Wigan 019E |
Urban major conurbation |
4.2a |
Young Urban Familiesa |
14 |
23 |
9% |
100 |
52 |
3.4 |
3.5 |
3.5 |
E01006406 |
Wigan 020A |
Urban major conurbation |
4.2a |
Young Urban Familiesa |
29 |
37 |
11% |
103 |
75 |
3.6 |
1.9 |
3.6 |
E01006407 |
Wigan 020B |
Urban major conurbation |
4.2a |
Young Urban Familiesa |
12 |
15 |
5% |
75 |
49 |
1.0 |
2.0 |
2.0 |
E01006409 |
Wigan 020D |
Urban major conurbation |
4.2a |
Young Urban Familiesa |
14 |
69 |
16% |
96 |
61 |
3.4 |
2.5 |
3.4 |
E01006410 |
Wigan 020E |
Urban major conurbation |
4.2a |
Young Urban Familiesa |
12 |
24 |
8% |
92 |
45 |
5.3 |
2.4 |
5.3 |
E01006401 |
Wigan 021E |
Urban major conurbation |
4.2a |
Young Urban Familiesa |
11 |
6 |
10% |
79 |
53 |
3.3 |
2.6 |
3.3 |
E01006292 |
Wigan 022C |
Urban major conurbation |
4.2a |
Young Urban Familiesa |
17 |
33 |
13% |
40 |
14 |
10.0 |
3.1 |
10.0 |
E01006219 |
Wigan 024E |
Urban major conurbation |
4.2a |
Young Urban Familiesa |
22 |
57 |
6% |
72 |
43 |
3.9 |
2.9 |
3.9 |
E01006212 |
Wigan 026A |
Urban major conurbation |
4.2a |
Young Urban Familiesa |
19 |
14 |
10% |
96 |
55 |
5.5 |
3.3 |
5.5 |
E01006216 |
Wigan 026C |
Urban major conurbation |
4.2a |
Young Urban Familiesa |
21 |
18 |
5% |
109 |
66 |
4.5 |
3.2 |
4.5 |
E01006282 |
Wigan 027A |
Urban major conurbation |
4.2a |
Young Urban Familiesa |
35 |
21 |
10% |
165 |
85 |
2.0 |
4.3 |
4.3 |
E01006268 |
Wigan 032E |
Urban major conurbation |
4.2a |
Young Urban Familiesa |
21 |
28 |
9% |
103 |
67 |
3.5 |
2.2 |
3.5 |
E01006325 |
Wigan 033C |
Urban major conurbation |
4.2a |
Young Urban Familiesa |
25 |
38 |
7% |
79 |
35 |
9.5 |
2.1 |
9.5 |
E01006247 |
Wigan 034B |
Urban major conurbation |
4.2a |
Young Urban Familiesa |
15 |
29 |
14% |
68 |
42 |
4.3 |
2.4 |
4.3 |
E01006221 |
Wigan 035B |
Urban major conurbation |
4.2a |
Young Urban Familiesa |
16 |
38 |
12% |
96 |
47 |
8.7 |
2.8 |
8.7 |
E01006227 |
Wigan 038A |
Urban major conurbation |
4.2a |
Young Urban Familiesa |
13 |
45 |
9% |
87 |
60 |
2.6 |
2.2 |
2.6 |
E01006303 |
Wigan 040B |
Urban major conurbation |
4.2a |
Young Urban Familiesa |
12 |
6 |
11% |
73 |
41 |
3.5 |
2.7 |
3.5 |
E01006319 |
Wigan 001D |
Urban major conurbation |
4.2b |
Young Urban Familiesb |
7 |
36 |
6% |
57 |
29 |
4.0 |
2.4 |
4.0 |
E01006237 |
Wigan 002D |
Urban major conurbation |
4.2b |
Young Urban Familiesb |
4 |
11 |
8% |
76 |
40 |
6.1 |
1.5 |
6.1 |
E01006259 |
Wigan 003A |
Urban major conurbation |
4.2b |
Young Urban Familiesb |
17 |
14 |
12% |
91 |
60 |
2.2 |
2.3 |
2.3 |
E01006389 |
Wigan 007C |
Urban major conurbation |
4.2b |
Young Urban Familiesb |
16 |
53 |
4% |
59 |
28 |
1.2 |
2.3 |
2.3 |
E01006365 |
Wigan 018D |
Urban major conurbation |
4.2b |
Young Urban Familiesb |
6 |
29 |
6% |
78 |
39 |
6.8 |
3.4 |
6.8 |
E01006234 |
Wigan 004C |
Rural town and fringe |
4.3a |
Mature Urban Householdsa |
15 |
20 |
15% |
99 |
59 |
5.3 |
2.5 |
5.3 |
E01006317 |
Wigan 001C |
Urban major conurbation |
4.3a |
Mature Urban Householdsa |
19 |
26 |
13% |
118 |
86 |
3.1 |
2.3 |
3.1 |
E01006390 |
Wigan 006E |
Urban major conurbation |
4.3a |
Mature Urban Householdsa |
24 |
38 |
18% |
133 |
85 |
4.2 |
3.7 |
4.2 |
E01006391 |
Wigan 007D |
Urban major conurbation |
4.3a |
Mature Urban Householdsa |
19 |
28 |
13% |
126 |
72 |
4.0 |
3.7 |
4.0 |
E01006399 |
Wigan 011E |
Urban major conurbation |
4.3a |
Mature Urban Householdsa |
29 |
29 |
13% |
135 |
86 |
1.4 |
3.4 |
3.4 |
E01006353 |
Wigan 014A |
Urban major conurbation |
4.3a |
Mature Urban Householdsa |
31 |
49 |
13% |
125 |
84 |
3.8 |
3.4 |
3.8 |
E01006366 |
Wigan 018E |
Urban major conurbation |
4.3a |
Mature Urban Householdsa |
18 |
13 |
17% |
114 |
84 |
3.2 |
2.0 |
3.2 |
E01006278 |
Wigan 019A |
Urban major conurbation |
4.3a |
Mature Urban Householdsa |
24 |
30 |
14% |
113 |
69 |
6.1 |
3.2 |
6.1 |
E01006280 |
Wigan 019C |
Urban major conurbation |
4.3a |
Mature Urban Householdsa |
27 |
38 |
16% |
136 |
97 |
2.3 |
2.9 |
2.9 |
E01006337 |
Wigan 027E |
Urban major conurbation |
4.3a |
Mature Urban Householdsa |
20 |
35 |
10% |
64 |
31 |
6.0 |
3.4 |
6.0 |
E01006261 |
Wigan 036C |
Urban major conurbation |
4.3a |
Mature Urban Householdsa |
25 |
56 |
17% |
175 |
128 |
3.2 |
2.8 |
3.2 |
E01006340 |
Wigan 039B |
Urban major conurbation |
4.3a |
Mature Urban Householdsa |
29 |
4 |
10% |
100 |
68 |
3.8 |
2.6 |
3.8 |
E01006304 |
Wigan 040C |
Urban major conurbation |
4.3a |
Mature Urban Householdsa |
19 |
8 |
14% |
83 |
46 |
6.3 |
3.5 |
6.3 |
E01006341 |
Wigan 040D |
Urban major conurbation |
4.3a |
Mature Urban Householdsa |
28 |
30 |
12% |
189 |
101 |
6.6 |
2.8 |
6.6 |
E01006368 |
Wigan 018G |
Urban city and town |
4.3c |
Mature Urban Householdsc |
19 |
3 |
15% |
77 |
47 |
3.9 |
3.0 |
3.9 |
E01006387 |
Wigan 009D |
Urban major conurbation |
4.3c |
Mature Urban Householdsc |
26 |
71 |
15% |
204 |
63 |
10.7 |
1.9 |
10.7 |
E01006273 |
Wigan 013D |
Urban major conurbation |
4.3c |
Mature Urban Householdsc |
31 |
20 |
10% |
122 |
68 |
6.1 |
4.1 |
6.1 |
E01006245 |
Wigan 023D |
Urban major conurbation |
4.3c |
Mature Urban Householdsc |
23 |
8 |
6% |
45 |
18 |
8.0 |
1.8 |
8.0 |
E01006265 |
Wigan 036E |
Urban major conurbation |
4.3c |
Mature Urban Householdsc |
22 |
41 |
11% |
97 |
51 |
1.9 |
2.7 |
2.7 |
E01006228 |
Wigan 038B |
Urban major conurbation |
4.3c |
Mature Urban Householdsc |
25 |
18 |
7% |
80 |
48 |
3.7 |
3.0 |
3.7 |
E01006346 |
Wigan 038E |
Urban major conurbation |
4.3c |
Mature Urban Householdsc |
20 |
19 |
11% |
114 |
69 |
4.6 |
3.0 |
4.6 |
E01006248 |
Wigan 031A |
Rural town and fringe |
6.1a |
Struggling Urban Familiesa |
67 |
14 |
11% |
126 |
63 |
9.3 |
3.6 |
9.3 |
E01006306 |
Wigan 009A |
Urban major conurbation |
6.1a |
Struggling Urban Familiesa |
50 |
64 |
14% |
195 |
132 |
2.9 |
3.6 |
3.6 |
E01006386 |
Wigan 009C |
Urban major conurbation |
6.1a |
Struggling Urban Familiesa |
66 |
61 |
18% |
277 |
189 |
1.8 |
3.3 |
3.3 |
E01006411 |
Wigan 015E |
Urban major conurbation |
6.1a |
Struggling Urban Familiesa |
64 |
32 |
9% |
190 |
127 |
1.1 |
2.9 |
2.9 |
E01006239 |
Wigan 017A |
Urban major conurbation |
6.1a |
Struggling Urban Familiesa |
60 |
40 |
11% |
58 |
35 |
3.0 |
2.7 |
3.0 |
E01006289 |
Wigan 017E |
Urban major conurbation |
6.1a |
Struggling Urban Familiesa |
58 |
52 |
10% |
55 |
26 |
3.4 |
3.2 |
3.4 |
E01006267 |
Wigan 032D |
Urban major conurbation |
6.1a |
Struggling Urban Familiesa |
46 |
60 |
16% |
204 |
131 |
4.0 |
3.9 |
4.0 |
E01006298 |
Wigan 037B |
Urban major conurbation |
6.1a |
Struggling Urban Familiesa |
41 |
63 |
12% |
106 |
63 |
4.6 |
3.7 |
4.6 |
E01006392 |
Wigan 009E |
Urban major conurbation |
6.1b |
Struggling Urban Familiesb |
58 |
54 |
7% |
128 |
98 |
2.3 |
2.5 |
2.5 |
E01006351 |
Wigan 010B |
Urban major conurbation |
6.1b |
Struggling Urban Familiesb |
73 |
53 |
7% |
191 |
130 |
4.5 |
3.8 |
4.5 |
E01006240 |
Wigan 017B |
Urban major conurbation |
6.1b |
Struggling Urban Familiesb |
64 |
54 |
6% |
51 |
11 |
10.9 |
3.8 |
10.9 |
E01006336 |
Wigan 027D |
Urban major conurbation |
6.1b |
Struggling Urban Familiesb |
55 |
28 |
11% |
170 |
119 |
2.9 |
3.3 |
3.3 |
E01006249 |
Wigan 031B |
Rural town and fringe |
6.2a |
Blue Collar Urban Familiesa |
45 |
13 |
7% |
89 |
49 |
1.8 |
2.8 |
2.8 |
E01006357 |
Wigan 010C |
Urban major conurbation |
6.2a |
Blue Collar Urban Familiesa |
66 |
24 |
10% |
248 |
175 |
2.1 |
3.5 |
3.5 |
E01006356 |
Wigan 011A |
Urban major conurbation |
6.2a |
Blue Collar Urban Familiesa |
42 |
56 |
8% |
118 |
82 |
2.3 |
2.9 |
2.9 |
E01006311 |
Wigan 012E |
Urban major conurbation |
6.2a |
Blue Collar Urban Familiesa |
38 |
18 |
7% |
110 |
76 |
2.5 |
2.2 |
2.5 |
E01006359 |
Wigan 014E |
Urban major conurbation |
6.2a |
Blue Collar Urban Familiesa |
34 |
42 |
8% |
107 |
67 |
3.4 |
2.4 |
3.4 |
E01006262 |
Wigan 032A |
Urban major conurbation |
6.2a |
Blue Collar Urban Familiesa |
32 |
6 |
8% |
108 |
73 |
3.1 |
2.3 |
3.1 |
E01006344 |
Wigan 038D |
Urban major conurbation |
6.2a |
Blue Collar Urban Familiesa |
40 |
57 |
14% |
144 |
107 |
2.2 |
2.4 |
2.4 |
E01006235 |
Wigan 004D |
Rural town and fringe |
6.2b |
Blue Collar Urban Familiesb |
34 |
24 |
16% |
127 |
90 |
3.1 |
3.0 |
3.1 |
E01006215 |
Wigan 024B |
Rural town and fringe |
6.2b |
Blue Collar Urban Familiesb |
53 |
4 |
14% |
184 |
118 |
3.3 |
4.0 |
4.0 |
E01006238 |
Wigan 002E |
Urban major conurbation |
6.2b |
Blue Collar Urban Familiesb |
31 |
59 |
15% |
143 |
98 |
2.9 |
2.4 |
2.9 |
E01006313 |
Wigan 003C |
Urban major conurbation |
6.2b |
Blue Collar Urban Familiesb |
32 |
12 |
12% |
96 |
61 |
2.4 |
3.2 |
3.2 |
E01006253 |
Wigan 005A |
Urban major conurbation |
6.2b |
Blue Collar Urban Familiesb |
37 |
46 |
16% |
120 |
84 |
4.3 |
2.3 |
4.3 |
E01006254 |
Wigan 005B |
Urban major conurbation |
6.2b |
Blue Collar Urban Familiesb |
49 |
15 |
9% |
149 |
98 |
5.8 |
2.5 |
5.8 |
E01006260 |
Wigan 005E |
Urban major conurbation |
6.2b |
Blue Collar Urban Familiesb |
30 |
32 |
12% |
130 |
101 |
2.0 |
2.3 |
2.3 |
E01006388 |
Wigan 007B |
Urban major conurbation |
6.2b |
Blue Collar Urban Familiesb |
24 |
34 |
12% |
169 |
105 |
2.8 |
4.3 |
4.3 |
E01006307 |
Wigan 009B |
Urban major conurbation |
6.2b |
Blue Collar Urban Familiesb |
39 |
34 |
10% |
144 |
108 |
1.5 |
2.7 |
2.7 |
E01006350 |
Wigan 010A |
Urban major conurbation |
6.2b |
Blue Collar Urban Familiesb |
66 |
22 |
7% |
168 |
121 |
1.9 |
2.5 |
2.5 |
E01006360 |
Wigan 010D |
Urban major conurbation |
6.2b |
Blue Collar Urban Familiesb |
64 |
33 |
8% |
223 |
114 |
9.8 |
5.4 |
9.8 |
E01006361 |
Wigan 010E |
Urban major conurbation |
6.2b |
Blue Collar Urban Familiesb |
58 |
13 |
6% |
161 |
106 |
1.5 |
3.2 |
3.2 |
E01006397 |
Wigan 011C |
Urban major conurbation |
6.2b |
Blue Collar Urban Familiesb |
37 |
79 |
16% |
133 |
78 |
4.0 |
3.9 |
4.0 |
E01006398 |
Wigan 011D |
Urban major conurbation |
6.2b |
Blue Collar Urban Familiesb |
32 |
48 |
10% |
78 |
58 |
1.4 |
1.6 |
1.6 |
E01006305 |
Wigan 012A |
Urban major conurbation |
6.2b |
Blue Collar Urban Familiesb |
55 |
47 |
8% |
182 |
100 |
3.9 |
4.3 |
4.3 |
E01006308 |
Wigan 012B |
Urban major conurbation |
6.2b |
Blue Collar Urban Familiesb |
42 |
14 |
11% |
176 |
134 |
1.8 |
2.0 |
2.0 |
E01006309 |
Wigan 012C |
Urban major conurbation |
6.2b |
Blue Collar Urban Familiesb |
41 |
25 |
8% |
182 |
132 |
2.6 |
2.8 |
2.8 |
E01006310 |
Wigan 012D |
Urban major conurbation |
6.2b |
Blue Collar Urban Familiesb |
45 |
6 |
10% |
198 |
96 |
0.6 |
4.4 |
4.4 |
E01006354 |
Wigan 014B |
Urban major conurbation |
6.2b |
Blue Collar Urban Familiesb |
36 |
69 |
17% |
222 |
163 |
4.8 |
3.5 |
4.8 |
E01006358 |
Wigan 014D |
Urban major conurbation |
6.2b |
Blue Collar Urban Familiesb |
36 |
28 |
15% |
139 |
103 |
2.9 |
2.1 |
2.9 |
E01006404 |
Wigan 015C |
Urban major conurbation |
6.2b |
Blue Collar Urban Familiesb |
37 |
28 |
12% |
192 |
142 |
3.3 |
2.5 |
3.3 |
E01006405 |
Wigan 015D |
Urban major conurbation |
6.2b |
Blue Collar Urban Familiesb |
41 |
36 |
13% |
345 |
197 |
2.7 |
5.6 |
5.6 |
E01006270 |
Wigan 016A |
Urban major conurbation |
6.2b |
Blue Collar Urban Familiesb |
45 |
55 |
14% |
161 |
111 |
1.7 |
3.0 |
3.0 |
E01006274 |
Wigan 016B |
Urban major conurbation |
6.2b |
Blue Collar Urban Familiesb |
35 |
73 |
12% |
160 |
90 |
3.4 |
3.8 |
3.8 |
E01006275 |
Wigan 016C |
Urban major conurbation |
6.2b |
Blue Collar Urban Familiesb |
49 |
54 |
12% |
137 |
96 |
1.8 |
2.3 |
2.3 |
E01006241 |
Wigan 017C |
Urban major conurbation |
6.2b |
Blue Collar Urban Familiesb |
49 |
14 |
7% |
30 |
15 |
2.8 |
2.3 |
2.8 |
E01006408 |
Wigan 020C |
Urban major conurbation |
6.2b |
Blue Collar Urban Familiesb |
34 |
44 |
10% |
137 |
76 |
5.8 |
3.2 |
5.8 |
E01006213 |
Wigan 024A |
Urban major conurbation |
6.2b |
Blue Collar Urban Familiesb |
54 |
8 |
7% |
136 |
97 |
2.8 |
2.5 |
2.8 |
E01006217 |
Wigan 024C |
Urban major conurbation |
6.2b |
Blue Collar Urban Familiesb |
33 |
25 |
7% |
143 |
111 |
2.5 |
2.1 |
2.5 |
E01006218 |
Wigan 024D |
Urban major conurbation |
6.2b |
Blue Collar Urban Familiesb |
39 |
35 |
5% |
100 |
80 |
2.4 |
1.5 |
2.4 |
E01006288 |
Wigan 025A |
Urban major conurbation |
6.2b |
Blue Collar Urban Familiesb |
49 |
12 |
8% |
39 |
14 |
4.2 |
2.4 |
4.2 |
E01006322 |
Wigan 026D |
Urban major conurbation |
6.2b |
Blue Collar Urban Familiesb |
44 |
5 |
7% |
103 |
73 |
3.8 |
1.9 |
3.8 |
E01006283 |
Wigan 027B |
Urban major conurbation |
6.2b |
Blue Collar Urban Familiesb |
43 |
20 |
8% |
109 |
70 |
4.9 |
2.1 |
4.9 |
E01006284 |
Wigan 027C |
Urban major conurbation |
6.2b |
Blue Collar Urban Familiesb |
40 |
49 |
7% |
137 |
89 |
3.3 |
2.9 |
3.3 |
E01006376 |
Wigan 028A |
Urban major conurbation |
6.2b |
Blue Collar Urban Familiesb |
35 |
25 |
10% |
34 |
19 |
4.0 |
1.7 |
4.0 |
E01006380 |
Wigan 029D |
Urban major conurbation |
6.2b |
Blue Collar Urban Familiesb |
34 |
15 |
14% |
30 |
13 |
2.6 |
1.7 |
2.6 |
E01006324 |
Wigan 033B |
Urban major conurbation |
6.2b |
Blue Collar Urban Familiesb |
38 |
57 |
11% |
119 |
79 |
2.1 |
2.2 |
2.2 |
E01006327 |
Wigan 033E |
Urban major conurbation |
6.2b |
Blue Collar Urban Familiesb |
65 |
5 |
12% |
241 |
150 |
5.5 |
3.2 |
5.5 |
E01006297 |
Wigan 034D |
Urban major conurbation |
6.2b |
Blue Collar Urban Familiesb |
44 |
12 |
11% |
98 |
62 |
2.7 |
2.9 |
2.9 |
E01006220 |
Wigan 035A |
Urban major conurbation |
6.2b |
Blue Collar Urban Familiesb |
33 |
5 |
14% |
245 |
159 |
6.9 |
4.1 |
6.9 |
E01006296 |
Wigan 037A |
Urban major conurbation |
6.2b |
Blue Collar Urban Familiesb |
49 |
28 |
8% |
92 |
53 |
6.1 |
2.3 |
6.1 |
E01006342 |
Wigan 038C |
Urban major conurbation |
6.2b |
Blue Collar Urban Familiesb |
39 |
32 |
14% |
115 |
74 |
5.0 |
2.7 |
5.0 |
E01006370 |
Wigan 006A |
Urban major conurbation |
7.2a |
Resorts and Retirementa |
23 |
29 |
10% |
136 |
77 |
3.5 |
3.5 |
3.5 |
E01006375 |
Wigan 008E |
Urban major conurbation |
7.2a |
Resorts and Retirementa |
12 |
45 |
10% |
92 |
52 |
5.6 |
2.8 |
5.6 |
E01006369 |
Wigan 008C |
Urban major conurbation |
7.3a |
Urban Terracinga |
44 |
22 |
10% |
163 |
114 |
4.4 |
3.3 |
4.4 |
E01006328 |
Wigan 030A |
Urban major conurbation |
7.3a |
Urban Terracinga |
40 |
50 |
9% |
88 |
59 |
2.4 |
2.2 |
2.4 |
E01006272 |
Wigan 013C |
Urban major conurbation |
7.3b |
Urban Terracingb |
29 |
9 |
13% |
181 |
106 |
5.4 |
4.8 |
5.4 |
E01006349 |
Wigan 015A |
Urban major conurbation |
7.3b |
Urban Terracingb |
31 |
10 |
10% |
149 |
83 |
4.4 |
4.5 |
4.5 |
E01006352 |
Wigan 015B |
Urban major conurbation |
7.3b |
Urban Terracingb |
42 |
26 |
12% |
221 |
153 |
5.9 |
3.6 |
5.9 |
E01006242 |
Wigan 023A |
Urban major conurbation |
7.3b |
Urban Terracingb |
25 |
20 |
14% |
47 |
18 |
2.2 |
2.9 |
2.9 |
E01006294 |
Wigan 025B |
Urban major conurbation |
7.3b |
Urban Terracingb |
24 |
52 |
6% |
29 |
13 |
2.0 |
2.0 |
2.0 |
E01006295 |
Wigan 025C |
Urban major conurbation |
7.3b |
Urban Terracingb |
32 |
47 |
9% |
39 |
17 |
2.9 |
2.6 |
2.9 |
E01006214 |
Wigan 026B |
Urban major conurbation |
7.3b |
Urban Terracingb |
37 |
8 |
8% |
91 |
55 |
3.6 |
2.4 |
3.6 |
E01006333 |
Wigan 030B |
Urban major conurbation |
7.3b |
Urban Terracingb |
38 |
39 |
8% |
122 |
74 |
4.8 |
3.7 |
4.8 |
E01006338 |
Wigan 030D |
Urban major conurbation |
7.3b |
Urban Terracingb |
29 |
71 |
10% |
85 |
47 |
4.5 |
2.3 |
4.5 |
E01006323 |
Wigan 033A |
Urban major conurbation |
7.3b |
Urban Terracingb |
45 |
21 |
8% |
98 |
60 |
2.9 |
2.3 |
2.9 |
E01006326 |
Wigan 033D |
Urban major conurbation |
7.3b |
Urban Terracingb |
35 |
87 |
9% |
113 |
61 |
5.3 |
2.9 |
5.3 |
E01006335 |
Wigan 034E |
Urban major conurbation |
7.3b |
Urban Terracingb |
25 |
89 |
7% |
95 |
64 |
3.1 |
2.2 |
3.1 |
E01006223 |
Wigan 036A |
Urban major conurbation |
7.3b |
Urban Terracingb |
22 |
43 |
12% |
175 |
114 |
3.8 |
2.3 |
3.8 |
E01006257 |
Wigan 008A |
Urban major conurbation |
7.3c |
Urban Terracingc |
16 |
87 |
12% |
90 |
57 |
1.2 |
1.7 |
1.7 |
E01006371 |
Wigan 008D |
Urban major conurbation |
7.3c |
Urban Terracingc |
16 |
58 |
10% |
91 |
62 |
3.5 |
2.3 |
3.5 |
E01006334 |
Wigan 030C |
Urban major conurbation |
7.3c |
Urban Terracingc |
37 |
54 |
6% |
89 |
47 |
6.3 |
3.7 |
6.3 |
E01006269 |
Wigan 013A |
Urban major conurbation |
7.4a |
Small Town Communitiesa |
29 |
24 |
12% |
133 |
89 |
4.3 |
3.3 |
4.3 |
E01006364 |
Wigan 018C |
Urban major conurbation |
7.4a |
Small Town Communitiesa |
25 |
14 |
13% |
126 |
98 |
2.8 |
1.9 |
2.8 |
E01006244 |
Wigan 023C |
Urban major conurbation |
7.4a |
Small Town Communitiesa |
28 |
16 |
18% |
48 |
19 |
7.1 |
2.9 |
7.1 |
E01006329 |
Wigan 026E |
Urban major conurbation |
7.4a |
Small Town Communitiesa |
39 |
7 |
9% |
140 |
67 |
5.9 |
3.4 |
5.9 |
E01006332 |
Wigan 031E |
Urban major conurbation |
7.4a |
Small Town Communitiesa |
22 |
36 |
15% |
385 |
259 |
7.5 |
5.7 |
7.5 |
E01006293 |
Wigan 022D |
Urban major conurbation |
7.4b |
Small Town Communitiesb |
30 |
16 |
14% |
36 |
25 |
1.6 |
1.5 |
1.6 |
E01006246 |
Wigan 034A |
Urban major conurbation |
7.4b |
Small Town Communitiesb |
31 |
20 |
13% |
98 |
53 |
2.2 |
2.8 |
2.8 |
Timing of the maximum step-change
The initiation dates for both the maximum step-up and step-down (12 months after initiation), can be used to demonstrate if the step-like events are clustered in time. From Figure 1 there may be the possibility of several step-down events after the 2007/08 event, the 2010/11 event has full coverage, while the 2012/13 event will be revealed by step-up features. Figure 4 summarizes the timing for the events captured at MSOA/LSOA level. As can be seen only six step-down events (with a maximum magnitude) were captured in the period Mar-08 to Aug-08, i.e. the bulk of the spatial spread associated with the 2007/08 event occurred too early for capture in this study.
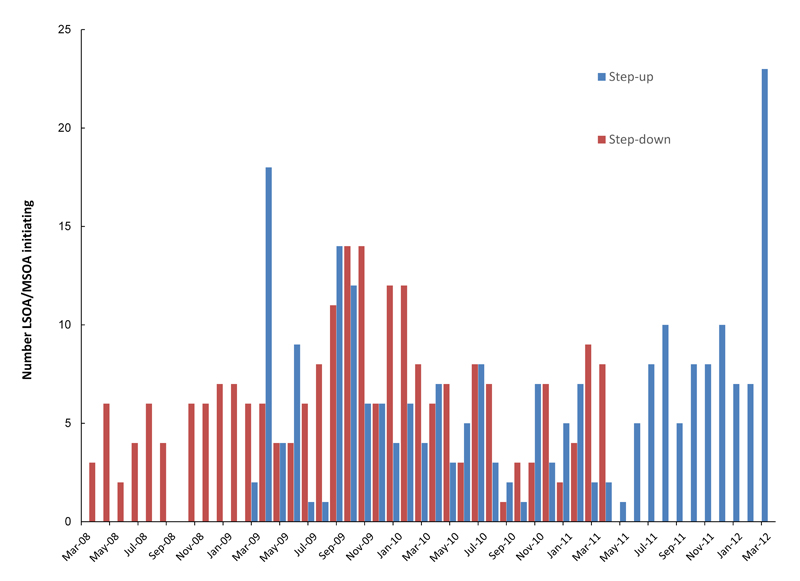
Figure 4. Month of initiation of the events as deduced from maximum step-up and maximum step-down for these events in LSOA and MSOA in Wigan. Initiation derived from the step-down was assumed to occur 365 days earlier
However the 2010/11 event is well represented and appears to occur between
Oct-08 through to Oct-10 or Mar-11 with greatest initiation occurring Aug-09 to Oct-09. The leading edge of the 2012/13 event probably overlaps the tailing edge of the 2010/11 event during the period Sep-10 to Mar-11, while the bulk of initiation commences after Jun-11 with a peak around Mar-12. Once again the duration of the study prevents full characterization beyond Mar-12.
The two year period of small area spread for the 2009/10 event revealed in this study, explains why the peak in deaths for this event in Figure 1 is not as sharp as the peaks seen for the other events in Figure 1. This concurs with other studies which suggest that the spread of deaths across the UK and Europe can occur more rapidly in some events than others [15,17,41]. It is clear that the mechanisms of spread, and any environmental factors leading to faster or slower spread, need to be understood.
Table S1 (supplementary material) shows the corresponding points in the running 365 day total at which the maximum or minimum total occurs (100 largest LSOA or other areas). As can be seen, the maximum or minimum can occur at any point in the four year period. Contrary to expectation the minimum occurs more frequently toward the end of the period than the start, i.e. population demography cannot be the major driving force for change. The most prominent minimum also occurs after the 2010 event but before the 2012 event.
Effect of socio-demographic variables on the maximum step-change
It is possible that socio-demographic variables may affect the magnitude of the observed step-change and roles for deprivation - as Index of Multiple Deprivation (IMD), population density, social grouping and age (as proportion of persons aged 70+) were all investigated. Figure 3 illustrates the importance of adjusting any step-change for the effects of size, and this was achieved by converting the magnitude of the step-change into standard deviation (STDEV) equivalents, i.e. magnitude of the step change divided by the square root of the average number of admissions.
Neither the IMD (range 4 to 73 in Wigan), or population density (range 2 to 90 persons per hectare in Wigan) showed any correlation with the magnitude of the step-change (see Table S3 in the supplementary material for a list of IMD, population density and social classification relating to each LSOA). However, as illustrated in Figure 5, social grouping appeared to show an effect with social groups containing older persons showing the greatest average step-change (as STDEV equivalents). Roughly similar differences in magnitude were observed between social groups in North East Essex following the 2008/09 event [21].
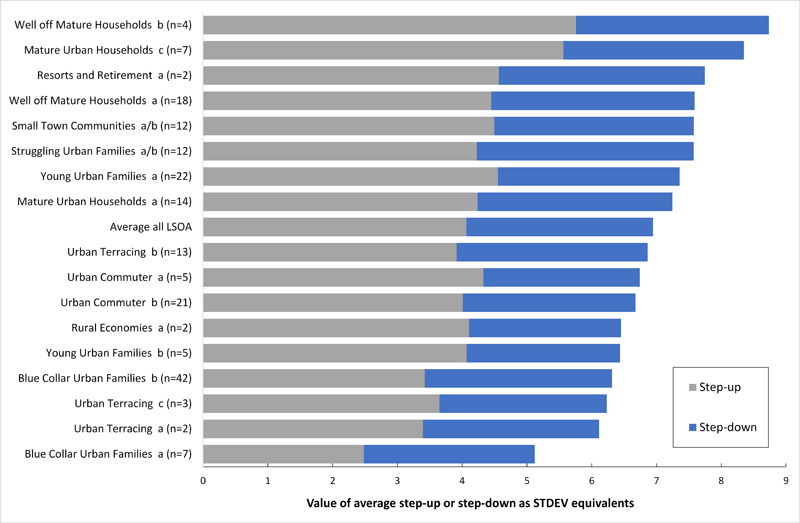
Figure 5. Effect of social group classification on the average maximum step-change converted into standard deviation equivalents
A potential role for age was further investigated by investigating the role of proportion of persons aged 70+ on the average maximum step-change, and is presented in Figure 6 where a running average of 10 size-ranked LSOA is used to minimize the scatter. The line of best fit is a simple second order polynomial via the’ add trend line’ function in Excel. As can be seen there is a modest effect of proportion aged 70+ at less than 12% after which the effect reaches an asymptote. A theoretical population containing no people aged 70+ would have a 1.25 standard deviation equivalent lower step-change than populations containing >12% of persons aged 70+. Hence age appears to be the only factor having an effect on the magnitude of the step-change and this is consistent with that observed elsewhere [22-24]. Indeed it has been suggested that the actual value of the step-increase is single-year-of-age specific [22,42], and this has been interpreted to imply that different strains of the same agent lead to these infectious-like events.
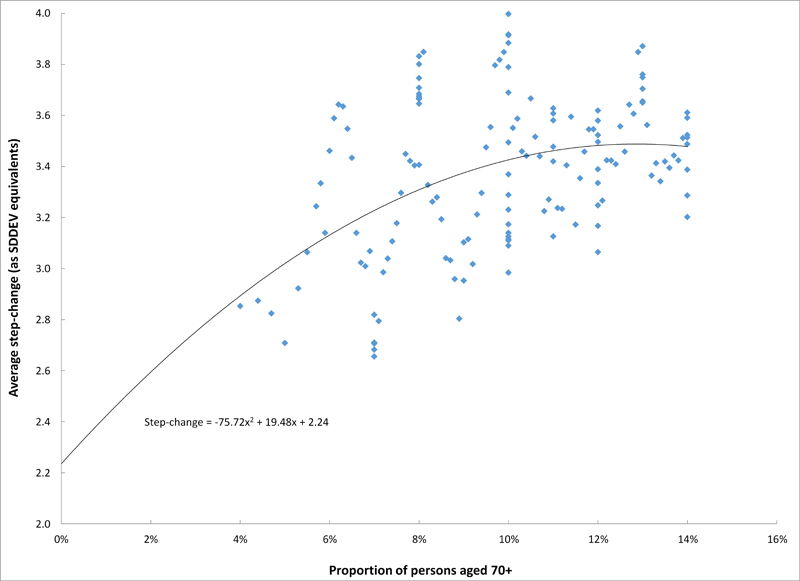
Figure 6. Effect of proportion of persons aged 70+ on the average step-change (STDEV equivalents) as running average of 10 proportion aged 70+-ranked LSOA
The 2009/10 outbreak
In terms of the effect upon deaths across the UK, the 2010 event made only a small effect and would otherwise be assumed not to exist. It was only when this author was examining trends at Local Authority level that the possibility of an additional event began to emerge [18]. Given that the time span of this study allows complete characterization of the 2010 event, both the timing and magnitude of the step-increase was characterized in all MSOA/LSOA in Wigan. Since both step-up and step-down are available, a method was employed which looked for the point in time when the magnitude of the step-up and step-down reached a maximum. This method effectively determines the point at which the area under the inverted V arising from the running total method is maximized. The average value of the step-up and step-down associated with this point was calculated along with the associated date.
Given the dependence on size noted in Figure 2, all percentage step-changes were adjusted to the theoretical value at an average of 100 admissions per annum, as follows: Observed step-change (%) x square root of (average admissions/100). The resulting size-adjusted step-changes ranged from +0% (Wigan 037C) to +198% (Wigan 017B). The average and median increases were 50% and 43% respectively while the interquartile range was 27% to 67%. Some 11% of LSOA experience greater than a 68% increase (2 x median) in medical admissions. Asimilar magnitude of increase in deaths has been characterized in equivalent sized locations in Australia [41].
As can be seen in Figure 7 the cumulative distribution is skewed. This skewing is evident in that at the left-hand tail 10% of locations experience a size- adjusted increase of between 0% and 18% (range 18%), while in the right-hand tail10% of locations experience size-adjusted increases of between 86% and 198% (range 112%). In addition, the standard deviation is ± 29% which encompasses 9.1% of values in the left-hand tail, but only 0.4% of values in the right-hand tail. Hence this infectious-like event is clearly highly granular/heterogeneous with respect to its effect on increased medical admissions, and this behavior is consistent with the known behavior of infectious events [18].
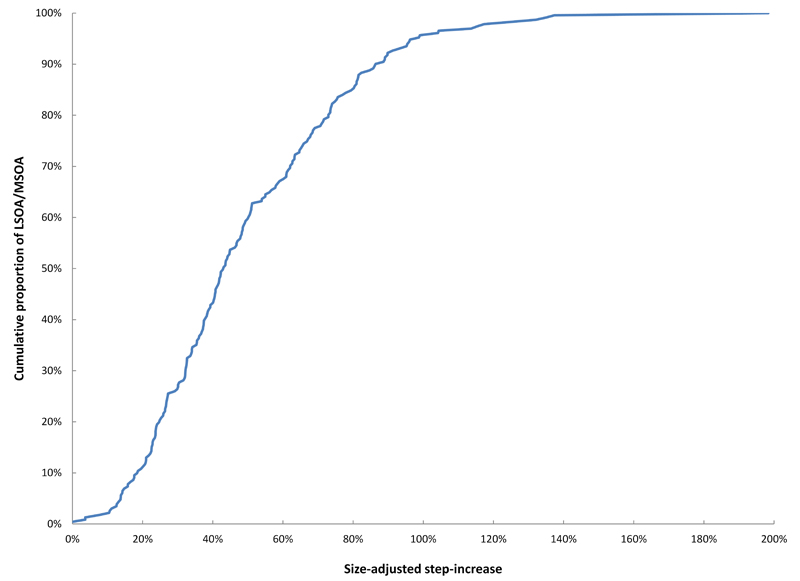
Figure 7. Cumulative proportion of areas, and percentage magnitude of the 2009/10 (size-adjusted) step-increase
As can be seen in Figure 8 there are three clusters of higher frequency of initiation around April/May 2009 (18% of locations), September/October 2009 (17%) and April/May 2010 (17%), while the frequency of initiation for other two month pairs only ranges from 8% to 12%. At the moment, the significance of the repeat April/May pairs toward the start and end of the outbreak will require further studies to see if this represents a significant period for these outbreaks in general. The median value of the (size-adjusted) step-increase in admissions also appears to peak at around the chronological mid-point of the outbreak, i.e. October and December 2009. A simple second order polynomial, using the ‘add trend line’ function in Excel, has been added to Figure 8 to show the trend in magnitude over time. This appears to be independent of summer/winter effects in that the median increase remains high from around July through to March. Given the known role of vitamin D in winter illness [43-48], it is worthy to note that vitamin D levels are at their highest at the end of summer [49], and due to the time lags in synthesis vitamin D only drops to a minimum toward the end of winter. Hence the effect seen in Figure 8 probably reflects the higher outbreak potential which would be expected in the mid-point of any outbreak.
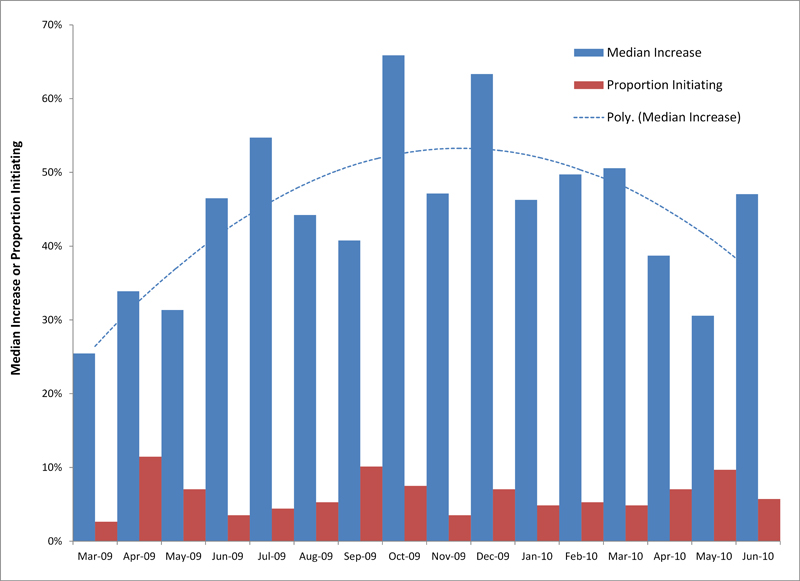
Figure 8. Median value of the 2009/10 step-increase (size-adjusted), proportion initiating, and month of initiation
Discussion
This study builds upon three previous small area studies where the geographic areas are all within the larger area covered by a single acute site, by a single PCO and by a single social services [21-24,26-27]. The observed behavior therefore cannot be attributed to differences in acute thresholds to admission, PCO policies or practices, or to the funding of social services. Likewise differences in weather can be excluded - the geographies are simply far too close to each other to experience significant differences in weather-related variables.
The potential contribution of poor hospital care to the related increase in deaths which appears to accompany these events, can be categorically excluded on the basis that Hospital Standardized Mortality Rates (HSMR) at the Wigan Royal Infirmary were below average during the period of this study. As expected, there was a slight wobble in the HSMR during the one to two month period where deaths initially lag behind rising admissions.
A similar range in the dates for the maximum and minimum values of medical admissions seen in Table S1, has also been observed in Berkshire (south of England) for the same date range used in this study [22,26,27].The key difference between these two locations appears to lie in the fact that the 2010 event seems to have had a far greater effect in Wigan than in Berkshire, while the reverse seems true for the 2012 event.
Most of the LSOA in Wigan are not subject to large population changes, and hence underlying growth is not large. The value of the calculated step-like changes shown in Figure 3 should therefore not require any growth adjustment.
A single clear step-increase would generate a ramp with little variation in slope over the ensuing 365 day period. From Figure 2 it is clear that the resulting ramp-like trends are more complex. From the perspective of disease transmission along social networks [29-31,50,51], an LSOA containing around 1,500 people is still a relatively large area, and given the implied relatively slow spread of the agent (i.e. relatively difficult to transmit) such complex time-trends are to be expected.
It must be recalled that a series of outbreaks at roughly two year intervals is an unprecedented situation since only two events per decade are most common [18]. Given that each event takes roughly two years to spread across the entire UK [18], it is therefore unsurprising that in some LSOA, late occurrences of the 2008 event can merge with the 2010 event and likewise with the 2010 and 2012 events. It has already been observed that spread occurs across the entire UK, and the member states of the European Union during an approximate two year window [15]. Similar dates and rate of spread have been observed in Australia [41] and New Zealand (in preparation). This wider spread precludes common health policy and funding since the four countries of the UK all operate different health policies and practices, as do the member countries of the European Union, while Australia and New Zealand are in the southern hemisphere.
The relationship between size and the apparent increase due to the step-like changes seen in Figure 3 has also been documented in Berkshire, and appears to arise from relatively slow spread of the agent within geographic areas containing different sized populations [22]. This is partly an expression of the Modifiable Areal Unit Problem (MAUP), and arises due to the slow spread within the different sized areas such that in larger areas there is greater opportunity for periods of maximum and minimum admissions within the constituent smaller areas to cancel each other out thereby reducing the value of the apparent step-increase [22]. This effect is illustrated in Table S2 (Supplementary material) where the step-increase is always greater for the LSOA within each MSOA than that for the MSOA.
A range of medical conditions are most affected, with a common linkage appearing to be related to immune function, i.e. infection, inflammation and autoimmunity [13,14,16,17]. In terms of increased death, the group of persons most dramatically affected by these events appears to be those suffering from existing neurological disorders, especially Alzheimer’s, dementia and Parkinson’s [52,53]. The very high prevalence of chronic fatigue, induced by peripheral inflammation and immune activation in this group, further emphasizes the potential pivotal role of immune dysfunction in susceptibility to these events [54].
Based on the range of conditions showing the greatest increase in admissions and deaths during these events, the ubiquitous immune-modifying persistent herpes virus, cytomegalovirus, has been implicated as either the causative agent or as secondary involvement by opportunistic reactivation in the presence of another agent [12-41,39,55-57]. Further work is required to validate this observation.
Factors influencing the increase in admissions
While population density has been shown to influence factors such as ambulance workload [58], the absence of a role for this factor in this study is not unexpected. This is because population density in Wigan is not high, and the maximum population density of 90 persons per hectare is only 14% of the maximum LSOA population density observed in London. At such low densities it is the social networks which will determine the degree of transmission [50,51]. Likewise deprivation using the IMD has been shown to influence health inequalities [59], however on this occasion it does not appear to be a major factor in transmission. From the evidence available, age appears to have the strongest factor influencing the percentage increase in admissions. Numerous studies have suggested that transmission of influenza-like illness depends mainly on contact with children who are the principal carriers [60,61], and it is contact with their elderly relatives which provides the opportunity for increased hospital admission among this age group. This risk of admission is then modified by the previous antibody history of the person to different strains of the agent [62].
Uncertainty in the initiation date
As has been discussed, two different methods were used to estimate the start of the 2009/10 event in each location. Hence either step-up or step-down or the method which assumes that step-down occurs 365 days after step-up and averages the value of the two events. In selecting the date for the maximum step-change it was noted that the maximum percentage change (to one decimal place accuracy) often occurred over a two to ten day range. For consistency the earliest date in this range was recorded as the start date. All methods detect the point of maximum 365 day change and therefore probably detect the point at which mass action has occurred, with actual arrival of the agent probably occurring days or weeks earlier. The resulting estimate of the (mass action) initiation date are listed in Table S2. Hence Wigan 001A has 17th October 2009 from all three estimates while Wigan 003A ranges from 1st Mar (from step-down) to 24th May (combined step-up/step-down). The assumption is that the event lasts for exactly 365 days, which may not always be the case. Table S2 also lists the time difference between step-up and step-down, and there is the possibility that a shorter duration than 365 days may be possible in some circumstances. This apparent duration could well be a function of the speed of transmission along the smaller social networks within each small area. Further work and mathematical modelling is required to clarify this issue.
The particular shape of the 2009/10 event for deaths
Given the detail now available from this study regarding the timing of the 2009/10 spatial spread throughout Wigan, the peculiar shape of the running 12 month total deaths in Figure 1 relating to the 2009/10 event can be explained. As has been explained a running 12 month total reveals the onset of a step-like increase in deaths or admissions observed as a ramp-up, and if this step endures for 12 months before abating, the running total then generates another ramp-down. This leads to an inverted ‘V’ shape in the running total. The base of the inverted ‘V’ should be 24 months wide. For the whole of Wigan the shape of the inverted ‘V’ can become corrupted if the underlying spatial spread of the agent is slow or patchy. The corrupted inverted ‘V’ in Figure 1 does however have a base which is 24 months wide from Jan-10 to Jan-12. In this study, the widest possible small area spread of the agent throughout Wigan has been shown to occur between Oct-08 to Apr-11 (Figure 4 – which used both step-up and step-down), while Figure 8 (which employed a method identifying greatest area under the inverted ‘V’ within a moving 24 month window) identified three periods of slightly higher spread over a more limited time period. Hence for whatever reason the 2009/10 event showed a high level of overlapping rectangular wave movement at small area level, the height of these wave being very different from one small area to another (Figure 7), all of which led to a corrupted inverted ‘V’ shape in Figure 1. It can only be assumed that similar slow and patchy spread across the whole of the UK lead to the 2009/10 event barely registering a 2% step-change, while the 2012 event shows a 5% step and the 2014 event shows a 9% step. The cluster of initiating events seen in Figure 4 around Mar-12 for the 2012 event suggests that particular events may spread faster than others, and this would lead to the range of inverted ‘V’ shaped running totals seen in Figure 1.
Why have the events been overlooked?
While it is not common to study medical admissions using very small area geographies, the considerable variation noted in this study would have resulted in great confusion to anyone attempting such analysis. Lacking knowledge of a potential infectious etiology, it is assumed that any researchers who attempted such analysis abandoned further study on the assumption that the apparently confusing results were simply due to statistical randomness or to errors in coding or data capture. The reliance on accurate patient information to trigger payment from the PCO to the hospital, excludes poor coding or data capture as an explanation for the trends seen in this study. Indeed neither coding nor data capture could account for the spatial spread between small areas.
Effect on NHS Operational Efficiency and Finances
These outbreaks pose considerable challenges in the area of health care finances and capacity planning at smaller local levels where there is considerable variation (see Figure 2 and Tables S1 and S2) [13,15,19]. However at the macro level observed by the national policy makers, the effect at larger geographies is considerably dampened, and this partly explains why these events have been overlooked for such a long time. This dampening effect is even greater using national rather than regional data, and hence wider spread across Europe also remained undetected [15], since surveillance methodologies tend to search for larger events concentrated over a shorter period of time such as an influenza epidemic or extremes of heat or cold.
If these events are as significant as they appear to be from this study their effect should be felt across the entire NHS. In this respect spatial spread of increased hospital bed occupancy has been demonstrated for the 2002/03 and 2007/08 events [63], while a more recent study on bed occupancy for the whole of England demonstrated step-like increases in average occupancy for the 2009/10, 2012/13 and 2014/15 events [64]. At £300 per bed day it was estimated that the sudden increase in occupancy for the 2014/15 event led to a cost shock of around $121 million [64].
Indeed cycles in surplus and deficit have been documented in both the US health insurance industry and the NHS, where the start of the deficit part of the cycle appears to commence with the onset of these events [15,18,65-68]. A study using NHS emergency activity grouped into Healthcare Resource Groups (HRGs), the financial currency used in the NHS, showed a clear cycle in costs of around £600 million from trough to peak which was initiated by the 2002/03 and 2007/08 outbreaks [69]. The 2007/08 outbreak lead to a 6% to 36% increase in GP referrals to particular specialties observed at Health Board and PCO level across Scotland, Wales and England [20], which was age specific.
While there is now abundant evidence for the existence and impact of these events, sadly policy makers in the UK appear to wish to continue to blame the NHS for ‘inefficiency’ rather than acknowledge that a unique infectious event may be the real cause of the higher than expected long-term increase in medical admissions [15,70].Indeed the large movements in admission implied by these events appear to be the fundamental source of year-to-year financial instability in the NHS [71-80].
Future Research
While this study has documented the small-area spatiotemporal behavior of medical admissions in some detail it raises a host of questions, such as:
- What percentage of the increased admissions are related to persons in the last year of life?
- Do the events increase the number of persons admitted and/or the number of readmissions per person?
- What mechanisms underly the one year duration of the increased admissions?
- To what extent is diagnostic ambiguity increased during these events?
- Are there a set of biochemical or immune parameters which characterize those who are infected with the agent?
Hopefully further prospective and retrospective studies can answer some of these questions.
Conclusion
A series of events involving relatively slow spatial spread are clearly evident at small area level in Wigan and elsewhere in the UK. A powerful infectious-like agent is implicated which leads to large increases in medical admissions (and deaths) which endure for a period of around 12 months before abating. The size of the increase in medical admissions is more readily apparent in smaller population groups presumably because a large proportion of the population are infected at roughly the same time. Urgent research is required to identify the causative agent, and to model these outbreaks. Indeed any agent capable of a sudden and sustained (size-adjusted) 50% increase in medical admissions needs to be given the utmost priority.
Acknowledgements
The permission of the Wrightington, Wigan and Leigh NHS Foundation Trust to publish this work is acknowledged. Opinions expressed in this study are exclusively those of the author.
Funding
There are no sources of funding.
Competing Interests
The author is not aware of any competing interests.
References
- Woolhouse ME, Gowtage-Sequeria S (2005) Host range and emerging and reemerging pathogens. Emerg Infect Dis 11: 1842-1847. [Crossref]
- Woolhouse ME, Howey R, Gaunt E, Reilly L, Chase-Topping M, et al. (2008) Temporal trends in the discovery of human viruses. Proc Biol Sci 275: 2111-2115. [Crossref]
- Woo PC, Lau SK, Teng JL, Tse H, Yuen KY (2008) Then and now: use of 16S rDNA gene sequencing for bacterial identification and discovery of novel bacteria in clinical microbiology laboratories. Clin Microbiol Infect 14: 908-934. [Crossref]
- Schlaberg R, Simmon KE, Fisher MA (2012) A systematic approach for discovering novel, clinically relevant bacteria. Emerg Infect Dis 18: 422-430. [Crossref]
- Rubicz R, Leach CT, Kraig E, Dhurandhar NV, Grubbs B, et al. (2011) Seroprevalence of 13 common pathogens in a rapidly growing U.S. minority population: Mexican Americans from San Antonio, TX. BMC Res Notes 4: 433. [Crossref]
- Wills MR, Carmichael AJ, Sissons JG (2002) Vaccines against persistent DNA virus infections. Br Med Bull 62: 125-138. [Crossref]
- Romo N, Fitó M, Gumá M, Sala J, García C, et al. (2011) Association of atherosclerosis with expression of the LILRB1 receptor by human NK and T-cells supports the infectious burden hypothesis. Arterioscler Thromb Vasc Biol 31: 2314-2321. [Crossref]
- Mundkur LA, Rao VS,2021 Copyright OAT. All rights reservH, et al. (2012) Pathogen burden, cytomegalovirus infection and inflammatory markers in the risk of premature coronary artery disease in individuals of Indian origin. Exp Clin Cardiol 17: 63-68. [Crossref]
- Elkind MS, Ramakrishnan P, Moon YP, Boden-Albala B, Liu KM, et al. (2010) Infectious burden and risk of stroke: the northern Manhattan study. Arch Neurol 67: 33-38. [Crossref]
- Shapira Y, Agmon-Levin N, Renaudineau Y, Porat-Katz BS, Barzilai O, et al. (2012) Serum markers of infections in patients with primary biliary cirrhosis: evidence of infection burden. Exp Mol Pathol 93: 386-390. [Crossref]
- Katan M, Moon YP, Paik MC, Sacco RL, Wright CB, et al. (2013) Infectious burden and cognitive function: the Northern Manhattan Study. Neurology 80: 1209-1215. [Crossref]
- Jones R (2014) A Study of an Unexplained and Large Increase in Respiratory Deaths in England and Wales: Is the Pattern of Diagnoses Consistent with the Potential Involvement of Cytomegalovirus? Brit J Med Medical Res 4: 5179-5192.
- Jones R (2013) Could cytomegalovirus be causing widespread outbreaks of chronic poor health? In Hypotheses in Clinical Medicine, M. Shoja, et al. (Eds.), pp 37-79, New York: Nova Science Publishers Inc.
- Jones R (2015) Roles for cytomegalovirus in infection, inflammation and autoimmunity. In Infection and Autoimmunity, (2ndedn), Y Shoenfeld, et al. (Eds.), Elsevier: Amsterdam. Chapter 18: 319-357.
- Jones R (2015) Recurring outbreaks of an Infection apparently targeting immune function, and consequent unprecedented growth in medical admission and costs in the United Kingdom: A review. Brit J Med Medical Res 6: 735-770.
- Jones R (2015) A new type of infectious outbreak? SMU Medical Journal 2: 19-25.
- Jones R (2012) Diagnoses, deaths and infectious outbreaks. Brit J Healthc Manage 18: 539-548.
- Jones R (2015) A previously uncharacterized infectious-like event leading to spatial spread of deaths across England and Wales: Characteristics of the most recent event and a time series for past events. Brit J Med Medical Res 5: 1361-1380.
- Jones R (2015) Are emergency admissions contagious? Brit J of Healthc Manage 21:227-235.
- Jones R (2012) Increasing GP referrals: collective jump or infectious push? Brit J Healthc Manage 18: 487-495.
- Jones R (2014) Infectious-like spread of an agent leading to increased medical hospital admission in the North East Essex area of the East of England. Biomedicine International 5: in press.
- Jones R, Beauchant S (2015) Spread of a new type of infectious condition across Berkshire in England between June 2011 and March 2013: Effect on medical emergency admissions. Brit J Med Medical Res 6: 126-148.
- Jones R (2015) Unexpected and Disruptive Changes in Admissions Associated with an Infectious-like Event Experienced at a Hospital in Berkshire, England around May of 2012. Brit J Med Medical Res 6: 56-76.
- Jones R (2014) Infectious-like spread of an agent leading to increased medical admissions and deaths in Wigan (England), during 2011 and 2012. Brit J Med Medical Res 4: 4723-4741.
- Jones R (2013) A recurring series of infectious-like events leading to excess deaths, emergency department attendances and medical admissions in Scotland. Biomedicine International 4: 72-86
- Jones R (2015) Estimating acute costs. British Journal of Healthcare Management 21: 152-153.
- Jones R (2015) Forecasting medical emergency admissions. Brit J Healthc Manage 21: 98-99.
- Leventhal GE, Hill AL, Nowak MA, Bonhoeffer S (2015) Evolution and emergence of infectious diseases in theoretical and real-world networks. Nat Commun 6: 6101. [Crossref]
- Bagrow J, Brockmann D (2013) Natural emergence of clusters and bursts in network evolution. Physical Review X 3: 021016.
- Brockmann D, Helbing D (2013) The hidden geometry of complex, network-driven contagion phenomena. Science 342: 1337-1342. [Crossref]
- Caudron Q, Mahmud AS, Metcalf CJ, Gottfreðsson M, Viboud C, et al. (2015) Predictability in a highly stochastic system: final size of measles epidemics in small populations. J R Soc Interface 12: 20141125. [Crossref]
- Trudeau R (1997) Monthly and daily patterns of death. Health Reports 9: 43-50.
- Fowler T, Southgate RJ, Waite T, Harrell R, Kovats S, et al. (2015) Excess winter deaths in Europe: a multi-country descriptive analysis. Eur J Public Health 25: 339-345. [Crossref]
- Fleming DM, Norbury CA, Crombie DL (1991) Annual and seasonal variation in the incidence of common diseases. Occas Pap R Coll Gen Pract 1-24. [Crossref]
- Foukal P, Lean J (1990) An empirical model of total solar irradiance variation between 1874 and 1988. Science 247: 556-558. [Crossref]
- Office for National Statistics (2010) Subnational population projections, 2008-based projections. Released May 2010.
- 37. Jones R (2015) Unexplained infectious events leading to deaths and medical admissions in Belfast. Brit J Healthc Manage 21: 46-47.
- Jones R (2015) Is length of stay a reliable efficiency measure? Brit J Healthc Manage 21:344-345.
- Jones R (2015) Is cytomegalovirus involved in recurring periods of higher than expected death and medical admissions, occurring as clustered outbreaks in the northern and southern hemispheres? Brit J Med Medical Res 10: in press.
- Jones RP (2010) Myths of ideal hospital size. Med J Aust 193: 298-300. [Crossref]
- Jones R (2015) A time series of infectious-like events in Australia between 2000 and 2013 leading to extended periods of increased deaths (all-cause mortality) with possible links to increased hospital medical admissions. International J Epidemiologic Res 2: In press.
- Jones R (2014) Unexpected single-year-of-age changes in the elderly mortality rate in 2012 in England and Wales. Brit J Med Medical Res 4: 3196-3207.
- Pilz S, Dobnig H, Tomaschitz A, Kienreich K, Meinitzer A, et al. (2012) Low 25-hydroxyvitamin D is associated with increased mortality in female nursing home residents. J Clin Endocrinol Metab 97: E653-657. [Crossref]
- Leow L, Simpson T, Cursons R, Karalus N, Hancox RJ (2011) Vitamin D, innate immunity and outcomes in community acquired pneumonia. Respirology16: 611-616. [Crossref]
- Lange N, Litonjua AA, Gibbons FK, Giovannucci E, Christopher KB (2013) Pre-hospital vitamin D concentration, mortality, and bloodstream infection in a hospitalized patient population. Am J Med 126: 640. [Crossref]
- Quraishi SA, Bittner EA, Christopher KB, Camargo CA Jr (2013) Vitamin D status and community-acquired pneumonia: results from the third National Health and Nutrition Examination Survey. PLoS One 8: e81120. [Crossref]
- Ramagopalan SV, Goldacre R, Disanto G, Giovannoni G, Goldacre MJ (2013) Hospital admissions for vitamin D related conditions and subsequent immune-mediated disease: record-linkage studies. BMC Med 11: 171. [Crossref]
- Sakem B, Nock C, Stanga Z, Medina P, Nydegger UE, et al. (2013) Serum concentrations of 25-hydroxyvitamin D and immunoglobulins in an older Swiss cohort: results of the Senior Labor Study. BMC Med 11: 176. [Crossref]
- Purdon G, Comrie F, Rutherford L, Marcinkiewicz A (2013) Vitamin D status of Scottish adults: Results from the 2010 & 2011 Scottish Health Surveys.
- Cauchemez S, Bhattarai A, Marchbanks TL, Fagan RP, Ostroff S, et al. (2011) Role of social networks in shaping disease transmission during a community outbreak of 2009 H1N1 pandemic influenza. Proc Natl Acad Sci U S A 108: 2825-2830. [Crossref]
- Eubank S, Guclu H, Kumar VS, Marathe MV, Srinivasan A, et al. (2004) Modelling disease outbreaks in realistic urban social networks. Nature 429: 180-184. [Crossref]
- Jones RP, Goldeck D (2014) Unexpected and unexplained increase in death due to neurological disorders in 2012 in England and Wales: is cytomegalovirus implicated? Med Hypotheses 83: 25-31. [Crossref]
- Jones R (2015) Unexpected Increase in Deaths from Alzheimer’s, Dementia and Other Neurological Disorders in England and Wales during 2012 and 2013. J Neuroinfectious Diseases 6: 2
- Morris G, Berk M, Walder K, Maes M (2015) Central pathways causing fatigue in neuro-inflammatory and autoimmune illnesses. BMC Med 13: 28. [Crossref]
- Jones R (2013) Recurring outbreaks of a subtle condition leading to hospitalization and death. Epidemiology: Open access 4: 137.
- Jones R (2015) An unexpected increase in adult appendicitis in England (2000/01 to 2012/13): Could cytomegalovirus (CMV) be a risk factor? Brit J Med Medical Res 5: 579-603.
- Jones R (2013) Trends in elderly diagnoses: links with multi-morbidity. Brit J Healthc Manage 19: 553-558.
- Peacock PJ, Peacock JL (2006) Emergency call work-load, deprivation and population density: an investigation into ambulance services across England. J Public Health (Oxf) 28: 111-115. [Crossref]
- Adams J, White M (2006) Removing the health domain from the Index of Multiple Deprivation 2004-effect on measured inequalities in census measure of health. J Public Health (Oxf) 28: 379-383. [Crossref]
- Adler AJ, Eames KT, Funk S, Edmunds WJ (2014) Incidence and risk factors for influenza-like-illness in the UK: online surveillance using Flusurvey. BMC Infect Dis 14: 232. [Crossref]
- Worby CJ, Chaves SS, Wallinga J, LipsitchM, Finelli L, et al. (2015) On the relative role of different age groups in influenza epidemics. Epidemics 13: 10-16. [Crossref]
- Klenerman P, Zinkernagel RM (1998) Original antigenic sin impairs cytotoxic T lymphocyte responses to viruses bearing variant epitopes. Nature 394: 482-485. [Crossref]
- Jones R (2012) Volatile inpatient costs and implications to CCG financial stability. Brit J Healthc Manage 18: 251-258.
- Jones R (2015) Bed occupancy, efficiency and infectious outbreaks. Brit J Healthc Manage 21: 396-397.
- Jones R (2010) Cyclic factors behind NHS deficits and surpluses. Brit J Healthc Manage 16: 48-50.
- Jones R (2010) Do NHS cost pressures follow long-term patterns? Brit J Healthc Manage 16: 192-194.
- Jones R (2010) Nature of health care costs and financial risk in commissioning. Brit J Healthc Manage 16: 424-430.
- Jones R (2010) Trends in programme budget expenditure. Brit J Healthc Manage 16: 518-526.
- Jones R (2012) Time to re-evaluate financial risk in GP commissioning. Brit J Healthc Manage 18: 39-48.
- Jones R (2013) What every GP needs to know about financial risk in commissioning. General Practice Online.
- Jones R (2012) Why is the ‘real world’ financial risk in commissioning so high? Brit J Healthc Manage 18: 216-217.
- Jones R (2012) Cancer care and volatility in commissioning. Brit J Healthc Manage 18: 315-324.
- Jones R (2012) Gender and financial risk in commissioning. Brit J Healthc Manage 18: 336-337.
- Jones R (2012) End of life care and volatility in costs. Brit J Healthc Manage 18: 374-381.
- Jones R (2012) Age and financial risk in healthcare costs. Brit J Healthc Manage 18: 388-389.
- Jones R (2012) High risk categories and risk pooling in healthcare costs. Brit J Healthc Manage 18: 430-435.
- Jones R (2012) Year-to-year volatility in medical admissions. Brit J Healthc Manage 18: 448-449.
- Jones R (2012) Financial risk in GP commissioning: lessons from Medicare. Brit J Healthc Manage 18: 656-657.
- Jones R (2013) Financial risk and volatile elderly diagnoses. Brit J Healthc Manage 19: 94-96.
- Jones R (2013) Financial risk and volatile childhood diagnoses. Brit J Healthc Manage 19: 148-149.