Purpose: The current cardiac magnetic resonance (CMR) based approach to assessment of right ventricular (RV) volumes is time-consuming and not optimized for routine clinical use. This study tested a new CMR based 3-Dimensional (3D) method of RV volume estimation that employed automated tracking to reduce analysis time.
Methods: Twenty RV-shaped latex models of different sizes (25-225 ml) were studied. Each RV model was driven by a pulsatile pump at 3-5 different stroke volumes (SV, 20-80 ml), and scanned for gradient cine stacks of multiple adjacent short axes, along with sagittal and coronal planes on a 3T MR scanner (Siemens). Individual scans were combined in an offline RV analysis program (RVMR) embedded in Research Arena VA® (TomTec) to compose a dynamic 3D polyhedron RV image loop. Each cine loop was analyzed using automated border tracking to compute RV volume. Reference volumes were obtained by immersing these models in water filled graduated cylinders and measuring displaced volume.
Results: The 3D RVMR derived volumes showed strong correlation with displacement derived reference volumes (Spearman coefficient = 0.992 for ESV, 0.999 for EDV; all p < 0.0001). Good inter- and intra-observer variability was observed. The intra-class correlation coefficients for ESV were 0.993 and 0.998 respectively, and for EDV 0.989 and 0.995 respectively. Bland-Altman analysis showed >95% of data points within limits of agreement.
Conclusions: Technical feasibility and accuracy of the 3D RVMR program was validated in this study. The speed of analysis is a distinct advantage. Studying normal and diseased human RVs would be the next step.
cardiac magnetic resonance imaging, congenital heart disease, right ventricular function, right ventricle
List of Abbreviations: RV: right ventricle, CMR: cardiac magnetic resonance, CHD: congenital heart disease, 2D: two-dimensional, 3D: three-dimensional, EF: ejection fraction, ESV: end-systolic volume, EDV: end-diastolic volume, SV: stroke volume, TOF: tetralogy of fallot, RVOT: right ventricular outflow tract, SSFP: steady state free precession, True FISP: true fast imaging with steady state precession, DICOM: digital imaging and communications in medicine
The right ventricle (RV) plays an important role in cardiac hemodynamics and RV dysfunction is associated with morbidity and mortality in patients with cardiopulmonary diseases. Accurate and reproducible assessment of RV volumes and function is important in clinical decision making for invasive treatment options, including cardiac transplantation. RV assessment assumes special relevance in patients with congenital heart disease (CHD) who are prone to RV dilatation and failure [1-6].
Traditionally, two-dimensional (2D) echocardiography is used to compute RV volumes from maximal area-length measurements derived from short and long axis views. The complexity of RV shape and its enormous variability, especially among CHD patients, has precluded the accurate estimation of RV volumes using fixed geometric assumptions. It is difficult to obtain the required views for maximal area/length measurements and significant variability is introduced with the examiner’s ability to locate image planes for accurate volume estimation. Issues with 2D echocardiography are magnified in CHD and conditions associated with RV remodeling [7,8]. Conventional 2D echocardiographic methods, therefore, do not enable accurate RV volume measurements and provide only estimates of ejection fraction (EF).
Methods that allow the chamber to be portrayed in three dimensions are likely to become the preferred techniques for clinical use [9]. 3D echocardiography (3DE) has made it possible to compute RV volumes from full volume datasets without geometric assumptions. The current resolution of 3DE makes endocardial border detection and tracing difficult, especially in dilated and remodeled RVs [10-13]. Previous clinical studies report that 3DE underestimates RV volumes and EF compared with MRI [14]. The primary factor contributing to the underestimation of RV volume and EF is considered to be blurring of the endocardial borders, especially in the RVOT region where the borders are farthest from the probe. Despite the development of relatively smaller size matrix-array transducers, positioning in the intercostal or subcostal window for optimal visualization of the complete RV is quite challenging [15]. These factors result in a higher degree of inconsistency of endocardial delineation between successive volumes of a 3D image loop and result in tracking errors.
Recent developments in magnetic resonance (MR) technology have allowed acquisition of dynamic cardiac volumes with unparalleled resolution; thus dramatically expanding the clinical applications of this imaging modality. Reduced total imaging time permits shorter breath holding times and makes True Fast Imaging with Steady State Precession (True FISP) a well suited technique for dynamic MR imaging in cardiac studies [16-19]. Cardiovascular magnetic resonance (CMR) is now considered an integral part of cardiac imaging and is becoming increasingly available in cardiac care facilities around the globe [20]. CMR derived measurements of RV volumes and EF are considered the current reference standard [21-24] and have assumed a pivotal role in the anatomical and functional assessment of RV. A summation of short-axis discs is considered the current standard for CMR based RV volume estimation [25,26]. The amount of time required to manually trace multiple short axis slices in multiple phases of the cardiac cycle; however, makes this method unsuitable for routine clinical use.
Recently a new semi-automated digital method has been introduced, which computes RV volumes using border detection on 3D image loops reconstructed from high resolution MR scans in longitudinal and short axes. This new method is intended for routine clinical use by reducing user input and analysis time. We sought to test the accuracy of this new method to determine RV volume under a variety of conditions in a controlled phantom study.
RV model
We studied twenty RV models of sizes ranging from 25 to 250 ml. We obtained ten freshly excised pig hearts of different sizes from a local USDA certified facility under an institutional research agreement and harvested from pigs undergoing terminal studies in the Department of Comparative Medicine at Oregon Health & Science University under an IACUC approved protocol. To create the pulsatile RV models, the pulmonary artery of each heart was sewn shut above the pulmonary valve, and the RV cavity was filled with liquid plaster. After the plaster had set, the newly formed cast was removed by excising the myocardial tissue, carefully preserving the trabeculations on the surface of the cast. Each RV cast was coated with thin layers of liquid latex to create an elastic RV shaped balloon model. The plaster cast was removed from the latex model through a small incision without distorting the shape of the model. The slit was sewn shut with 6/0 monofilament suture and sealed with additional latex coating. A plastic tube was attached to the model at the right ventricular outflow tract (RVOT).
An enlarged, abnormal, and often aneurysmal outflow tract is common in CHD, such as repaired tetralogy of Fallot (TOF), and is especially difficult to visualize in these patients which can contribute to underestimation of RV volumes. When severely enlarged, the RVOT can lead to foreshortening of the RV apex and underestimation of RV volumes. Since volumetric contribution from the RVOT is a critical component in determining RV volumes, we applied a paste of semisolid plaster to the RVOT area of each existing RV cast to change the shape of the RVOT. Upon setting of the plaster, another series of RV shaped balloons were made from the RV casts with remodeled RVOTs. All models were attached to a pulsatile pump and tested for potential leaks under high pressure.
CMR imaging
Each RV model was placed in the MR scanner (3T TIM Trio, Siemens) after filling it with a dilute (1mM) aqueous solution of manganese chloride to enhance the signal to noise ratio in the imaging sequences used.
To simulate a physiologic heartbeat, a Harvard Apparatus pulsatile pump was placed outside the magnet room and connected to the RVOT by a closed system of vinyl tubing (14-16 ft.). The Harvard Series 1400 pulsatile pump was modified to produce a square wave timed such that the rising edge occurred at the peak upstroke that corresponded to end of diastole (maximal volume) in the model. A low-amplitude voltage pulse was generated on every rising edge that was detected as an R-wave and triggered the image acquisition. R-wave triggered True FISP cine MR sequences were acquired: [(Field of View (FOV): 200mm; Matrix: 96x256; Slice thickness: 5.0mm; Voxel Size: 0.78x 0.78 mm; TR: (variable based on the R-R interval); TE: 1.73; Flip Angle: 46 degrees; Bandwidth (BW): 930 Hz/pixel; 18 phases of the cardiac cycle; and Parallel Imaging Technique (Grappa): 2.0)].
Modeled anatomical landmarks of the tricuspid, pulmonary and RV apical regions of the phantom were defined from the initial scout images and used to acquire short axis scans. At each stroke volume (SV) studied, a stack of short axis scans were acquired from apex to base of the model at a fixed distance of 5mm. Anatomical landmarks defined from these short axis images were used to acquire single cut scans in coronal and long axis planes.
After acquiring image data, the RV pulsatile model was immersed in a plastic graduated cylinder to determine reference end-systolic and end-diastolic volumes (ESV, EDV) by displacement. Reference RV volumes were computed by subtracting the known volume of the empty latex model from these displacement derived values at each pumped SV. Each model was scanned at three to five different SVs (20-80 ml) depending upon the size of model. SV was changed at the pump level outside the magnet by increments of 10 ml after adding or removing a similar fluid volume in the closed pump circuit. MR image data was saved in Digital Imaging and Communication in Medicine (DICOM) format and exported for offline analysis.
Analysis
CMR datasets were transferred to an offline image processing software platform (Research Arena VA; TomTec Imaging Systems, Inc., Unterschleissheim, Germany). Individual 2D scans from each plane were combined to generate a dynamic polyhedron model of the RV. These reconstructed 3D datasets from each study were analyzed using 3D RVMR software embedded in Research Arena, which has a step-by step workflow (Figure 1).
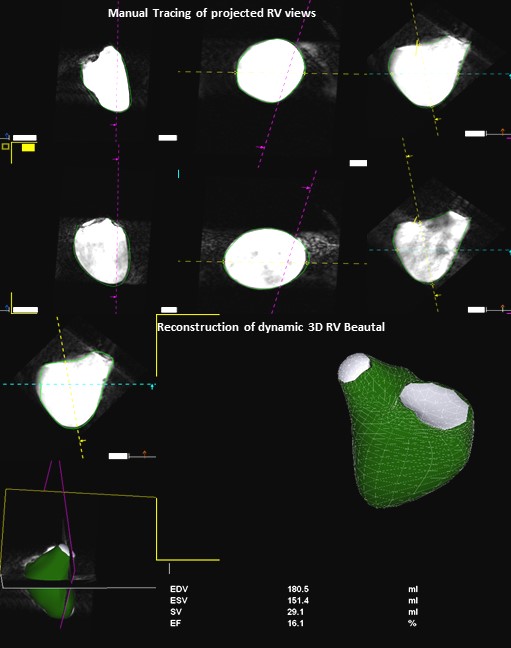
Figure 1. Workflow of RV-MR Analysis Program. The program defines a dynamic polyhedron model of the right ventricle on the basis of the initial contours, which are automatically adapted to the endocardial surface of the ventricle over all frames of the cardiac cycle.
The 3D RVMR program projects the RV into the traditional coronal, long and short axis planes. Diastolic and systolic frames were selected using these projected planes and the endocardium was traced including the trabeculations within the RV cavity. A semi-automated border detection algorithm was employed to extend the manually delineated borders into all planes and image frames. Manual correction of the automated borders was possible in any frame. Geometric coordinates embedded in the 3D dataset directed 3D volume reconstruction. The application defined a dynamic polyhedron model of the RV which was automatically adapted to the endocardial surface of the ventricle over all frames of the cardiac cycle. RV volumes at ESV and EDV were automatically calculated and displayed alongside a dynamic model. Visual assessment of tracking in this dynamic display offered an opportunity to manually edit tracings which increased the processing time, but was rarely necessary in these high-resolution phantom images.
All datasets were also analyzed by tracing adjacent short axis planes in a conventional MR program [QMassMR7.2 (Medis)]. Image data was exported to this program, which projected all phases in the short axis plane from apex to base, and allowed the user to trace them individually (Figure 2). This analytic method required a minimum of 35 minutes for each dataset. Values of RV volumes derived by both MR methods for each model at each pumped SV were recorded.
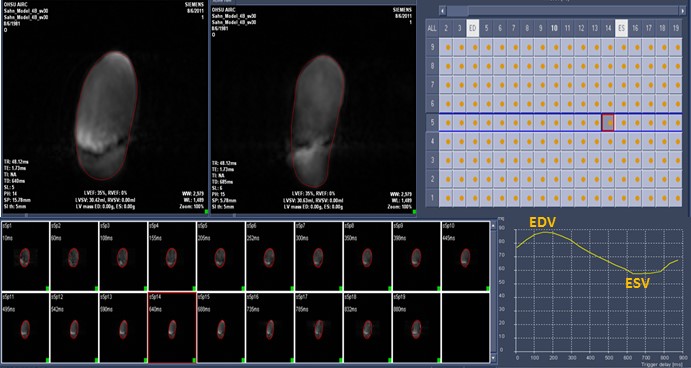
Figure 2. QMassMR7.2 (Medis) Program. User interface allows manual or semiautomated tracing of each projected short axis scan individually to yield a time volume curve with maximum (End Diastolic) and minimum (End Systolic) RV volumes.
Statistics
Spearman correlation was applied to assess the correlation between the displacement derived reference and 3D RVMR derived values of RV volumes and ejection fractions (EF). Bland-Altman plots were constructed to explore the bias, systematic error and the level of agreement between methods by looking at the mean of the measurements by percent change. The concordance correlation coefficient (CCC) was performed to compare the 3D RVMR derived RV volumes and EF with the corresponding values from QmassMR7.2 and displacement methods. Intra-class correlation (ICC) was used to assess inter- and intra-observer variability of the 3D RVMR method. The testing was considered significant at the alpha level of 0.05. 95% CIs were reported when appropriate. P values less than 0.05 were considered significant.
The semi-automated tracking of the RVMR method used 3-9 minutes to compute RV volumes including initial manual tracing of projected views (Mean 4.9, Median 3.45, Maximum 9.2 and Minimum 3.25 minutes). With an increase in SV at the pump, both the RVMR derived and reference EDVs increased accordingly. The Spearman correlations between RVMR derived and reference values of RV volumes and EF were very strong: r = 0.992, p < 0.0001 for ESV and r = 0.999, p < 0.0001 for EDV. Bland-Altman plots didn’t show any systematic error trends with more than 95% of data points within the ± 2SD limits of agreement. The CCCs between 3D RVMR and the reference method were CCC 0.969, 95% CI 0.957 – 0.978 for ESV; CCC 0.999, 95% CI 0.998 – 0.999 for EDV. These results indicated strong concordance with the reference values (Figure 3).
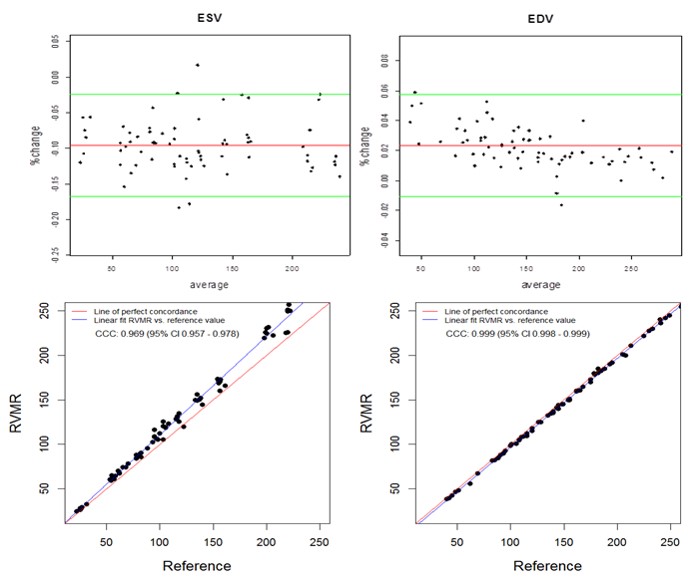
Figure 3. Bland-Altman and Concordance Correlation Plots between RVMR derived and Reference RV volumes. Bland-Altman plots (Top Panel) show mean bias in percent change (red line) of -0.0955 for ESV ( End Systolic Volume) and 0.0233 for EDV ( End Diastolic Volume) measurements, with more than 95% of data points within the ± 2SD limits of agreement (green lines). Concordance correlation plot (Bottom Panel) shows linear regression of RVMR derived values of RV volumes along blue line with reference values along the red line where x=y.
Manual tracing of short axis slices in QMassMR7.2 used 35-49 minutes (Mean 40.85, Median 44.20, Maximum 49.35 and Minimum 35.15 minutes) to generate a time volume curve yielding ESV and EDV values from each dataset. Visual selection of end systolic and end diastolic phases, and tracing them to compute ESV and EDV used relatively less time (Mean 12.5, Median 11.45, Maximum 17.35 and Minimum 9.15 minutes); however, the results with this method showed high variability (> 15% inter-observer variability) and were not used in this study. QMassMR7.2 derived measurements showed slightly higher mean bias in percent change from reference values (-0.144 for ESV, -0.102 for EDV) compared to 3D RVMR derived measurements (-0.096 for ESV, 0.023 for EDV) (Figure 4). When compared with QMassMR7.2, the 3D RVMR method under-estimated both ESV and EDV (Mean bias in percent change were -0.053 for ESV, -0.122 for EDV). A statistical measure (D) was used to define underestimation [D = (1/n) sum (observed value – reference value) where n is the sample size. Overestimation is D > 0; and Underestimation is D <0]. The Spearman correlations between both methods were strong: r = 0.990, p < 0.0001 for ESV; r = 0.990, p < 0.0001 for EDV; r=0.922, p<0.0001 for EF. There were no systematic errors detected in the Bland-Altman plots and more than 95% of data points were within the ± 2SD limits of agreement. The CCCs between 3D RVMR and QMassMR7.2 methods were: CCC = 0.991, 95% CI: 0.986 – 0.994 for ESV; CCC = 0.94, 95% CI: 0.916 – 0.958 for EDV (Figure 5).
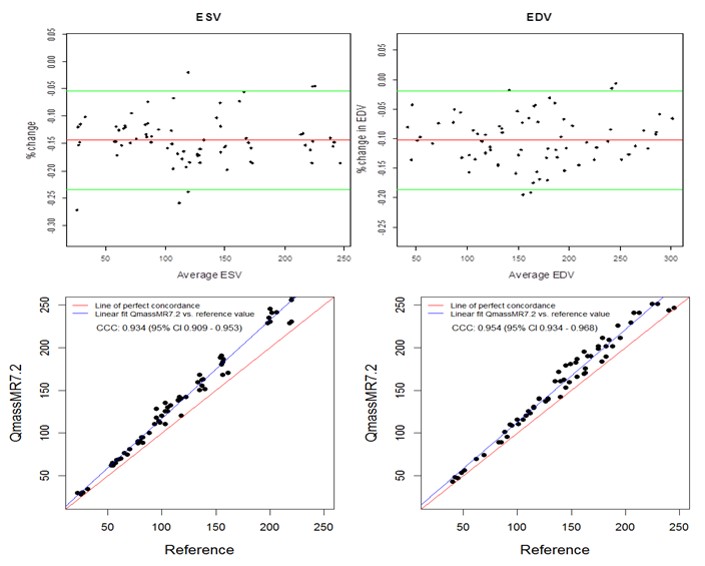
Figure 4. Bland-Altman and Concordance Correlation Plots between QMassMR7.2 derived and Reference RV volumes. Bland-Altman plots (Top Panel) show mean bias in percent change (red line) of -0.1437 for ESV and -0.1023 for EDV measurements, with more than 95% of data points within the ± 2SD limits of agreement (green lines). Concordance correlation plot (Bottom Panel) shows linear regression of QMassMR7.2 derived values of RV volumes along blue line with reference values along the red line where x=y.
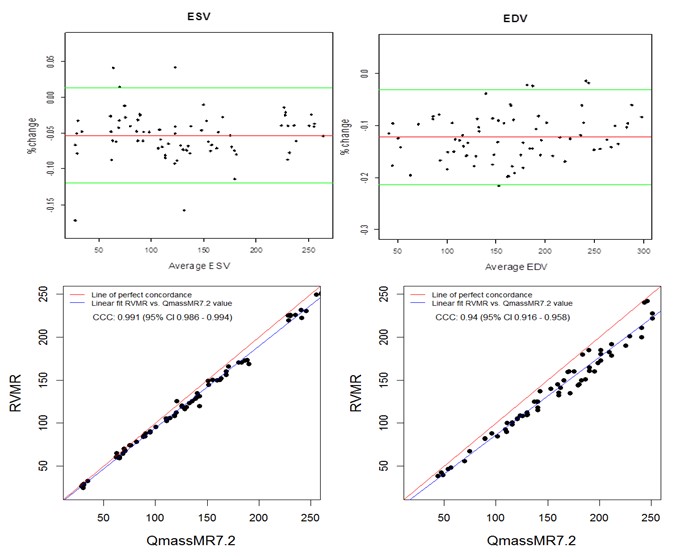
Figure 5. Bland-Altman and Concordance Correlation Plots between RVMR and QMassMR7.2 derived RV Volumes. Bland-Altman plots (Top Panel) show mean bias in % change (red line) of -0.0532 for ESV and -0.1224 for EDV measurements, with more than 95% of data points within the ± 2SD limits of agreement (green lines). Concordance correlation plot (Bottom Panel) shows linear regression of RVMR derived values of RV volumes along blue line with reference to QMassMR7.2 derived values along the red line where x=y.
Ejection fraction (EF) is a frequently used index of dynamic heart function and is computed from the EDV and ESV values. When compared with reference values, both 3D RVMR and QMassMR7.2 derived EF values showed good correlation (Spearman correlation r = 0.95 for 3D RVMR and 0.94 for QMassMR7.2, both p < 0.0001). 3D RVMR derived measurements underestimated EF (Mean bias -5.76) as compared to QMassMR7.2 derived values, but showed good correlation (r = 0.92). Bland-Altman plots and concordance correlation coefficients (Figure 6) showed good agreement between EF values derived from the two methods.
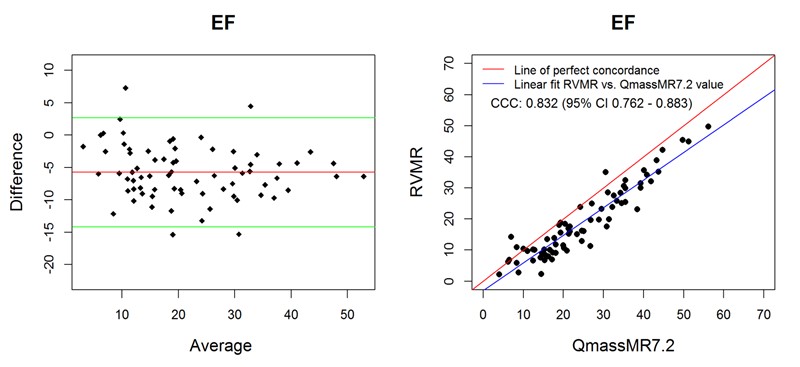
Figure 6. Bland-Altman and Concordance Correlation Plots between RVMR and QMassMR7.2 derived EF values. Bland-Altman plots (Top Panel) show mean bias (red line) of -5.7561, with more than 95% of data points within the ± 2SD limits of agreement (green lines). Concordance correlation plot (Bottom Panel) shows linear regression of RVMR derived values of EF (Ejection Fraction) along blue line with reference to QMassMR7.2 derived EF values along the red line where x=y.
Reproducibility
Inter-observer variability was determined via a blinded analysis of RV volumes for ten image loops by a second observer. Intra-observer variability was determined by repeat analysis of RV volumes in randomized image loops stripped of all information. For intra-observer variability, ICC = 0.998, 95% CI: 0.996 - 0.999 for ESV and ICC = 0.995, 95% CI: 0.986 - 0.998 for EDV. For inter-observer variability, ICC = 0.993, 95% CI: 0.984 - 0.998 for ESV and ICC = 0.989, 95% CI: 0.974 - 0.997 for EDV. Further examination of reproducibility on inter-observer data through CCC exploration produced the following results: CCC = 0.993, 95% CI: 0.998- 0.998 for ESV and CCC = 0.991, 95% CI: 0.971 – 0.997 for EDV. Concordance correlation plots (Figure 7) revealed an excellent linear fit of observed vs. computed values for both ESV and EDV. The results were consistent with those obtained from ICC, indicating high reproducibility.

Figure 7. Reproducibility Analysis. This shows linear fit of interobserver and intraobserver computed values, which are very close to the perfect concordance line for both ESV and EDV.
2021 Copyright OAT. All rights reserv
The ability to acquire dynamic images of the complete RV with well-defined endocardial borders has made CMR a well-suited imaging modality for assessment of RV volumes and function. RV functional analysis is typically performed on the stack of adjacent cine images acquired in the short axis or axial orientation from apex to base. For each slice, the endocardial contour of the RV (region of interest) is manually traced in the end-diastolic and end-systolic frames, and checked for accuracy. The area defined by the endocardial tracing in each slice is multiplied by the slice thickness. The process is either repeated for each phase of the cardiac cycle over all slices to obtain a continuous time-volume loop, or performed only on ED and ES frames to calculate EDV and ESV. The amount of time required to trace multiple short axis slices in multiple phases of cardiac cycle makes this method cumbersome for routine clinical use. Also, through-plane motion during the cardiac cycle often obfuscates slices at the level of the tricuspid valve, which can influence volume change by as much as 15%. Therefore, 3D imaging methods which incorporate information from longitudinal views with the multiple slice technique are potentially more accurate. Furthermore, reliance on geometric modeling is eliminated and superior visualization of the tricuspid annulus is available to aid in defining the basal limit of the RV [27].
The results of this controlled phantom study demonstrated the accuracy of the 3D RVMR analysis method. A wide range of RV volumes with different sizes and variable outflow tracts were studied at multiple pumped SVs to test the feasibility of this new method under varying clinical conditions. As shown in Bland-Altman plots, small biases were detected between 3D RVMR derived and reference measurements. These biases may be attributed to insufficient temporal resolution of CMR imaging (compromised in part due to data acquisition time) and are expected to be corrected by increasing frame rate with technological advances.
Median analysis time was less than four minutes, which included the initial tracing of contours on projected views. The dynamic display of 3D RVMR derived volumes superimposed on RV image loops allowed quick assessment of tracking quality. Three-dimensional reconstruction and visualization of the RV cavity allowed correction of automated tracings and extrapolation of contours where borders were not clearly defined in some scans. Manual correction of contours was rarely needed in the high resolution images of this study. Short analysis times and minimal user effort makes this method feasible for routine clinical use in a busy CMR lab.
The ESV and EDV values determined by 3D RVMR were computed from software or user-defined end-systolic and end-diastolic phases, and not derived from the time-volume curve. A well-defined consistent R-wave like signal and a comprehensive projection of image data in multiple planes simultaneously allowed enhanced definition of ES and ED phases, which might contribute to the lower variability of results for the 3D RVMR method relative to QMassMR7.2. Both methods evaluated in this study showed comparable accuracy; however, through-plane motion was not present in this phantom model which lacked atria and a true tricuspid valve plane.
The present study utilized very high-resolution images acquired from a latex phantom for analysis. As a consequence of short T2 relaxation times, cross-linked materials such as latex rubber are generally not visible on CMR scans of this RV model. Also, unlike the myocardium, there was no uptake of contrast agent, which yielded excellent contrast between fluid and latex. These features of the model may have facilitated improved border delineation in this study; therefore, further in vivo testing is needed to confirm our results.
The 3D RVMR method described here is dependent on a good quality R-wave for acquisition and analysis. R-wave is not only used to trigger acquisition, but also to stitch multiple scans and reconstruct the dynamic 3D polyhedron. A simulated R-wave like signal that was timed to peak upstroke of the pump was used in this study. In a clinical setting, this may pose limitations in patients with rhythm disorders. Further studies in vivo using vector electrocardiogram triggering would be needed to better understand this. CMR image quality issues may result for multiple reasons, including insufficient breath holding, temporal resolution limitations, and elevated heart rates. Implications of these factors were not tested. The present study was performed on a 3T CMR scanner. An occasional flow artifact was noticed with this scanner that interfered with analysis of the RVOT area in a few of the phantoms at higher SVs. It is unknown if this would become an issue for in vivo imaging on 3T or 1.5T scanners.
This new semi-automated 3D RVMR method is feasible and accurate for computation of RV volumes from high resolution CMR image loops, as shown by results of this controlled phantom study.
Thomas Balbach is an employee of TomTec Imaging Systems in Unterschleissheim, Germany. David Sahn is an occasional consultant for the company. None of the other authors of this paper have any real or apparent conflicts of interest.
MA chiefly designed the study and wrote the major drafts of the paper, which is why he is designated corresponding author. DJS supervised the design of the study and edited the paper. TN and JYL are statisticians; they reviewed the data and advised on the paper. SK helped write the paper. TB works for TomTec and provided the analysis program, advising on its use for the study and suggesting improvements for the paper. MS and WW assisted in imaging studies at OHSU. RN, MM and ER assisted in the initial studies the Mayo Clinic.
- Zornoff LAM, Skali H, Pfeffer MA, St John Sutton M, Rouleau JL, et al. (2002) Right ventricular dysfunction and risk of heart failure and mortality after myocardial infarction. J Am Coll Cardiol 39: 1450-1455. [Crossref]
- Spinarová L, Meluzín J, Toman J, Hude P, Krejcí J, et al. (2005) Right ventricular dysfunction in chronic heart failure patients. Eur J Heart Fail 7: 485-489. [crossref]
- Davlouros PA, Niwa K, Webb G, Gatzoulis MA (2006) The right ventricle in congenital heart disease. Heart 92 Suppl 1: i27-38. [Crossref]
- Voekel NF, Quaife RA, Leinwand LA, Barst RJ, McGoon MD, et al. (2006) Right ventricular function and failure: Report of a National Heart, Lung, and Blood Institute Working Group on cellular and molecular mechanisms of right heart failure. Circulation 114: 1883-1891. [Crossref]
- Ghio S, Gavazzi A, Campana C, Inserra C, Klersy C, et al. (2001) Independent and additive prognostic value of right ventricular systolic function and pulmonary artery pressure in patients with chronic heart failure. J Am Coll Cardiol 37: 183-188. [Crossref]
- De Groote P, Millaire A, Foucher-Hossein C, Nugue O, Marchandise X, et al. (1998) Right ventricular ejection fraction is an independent predictor of survival in patients with moderate heart failure. J Am Coll Cardiol 32: 948-954. [Crossref]
- Dorosz JL, Bolson EL, Waiss MS, Sheehan FH (2003) Three-dimensional visual guidance improves the accuracy of calculating right ventricular volume with two-dimensional echocardiography. J Am Soc Echocardiogr 16: 675-681. [Crossref]
- Bleeker GB, Steendijk P, Holman ER, Yu CM, Breithardt OA, et al. (2006) Assessing right ventricular function: the role of echocardiography and complementary technologies. Heart 92 Suppl 1: i19-26. [Crossref]
- Marwick TH, Schwaiger M (2008) The future of cardiovascular imaging in the diagnosis and management of heart failure, part 1: tasks and tools. Circ Cardiovasc Imaging 1: 58-69. [Crossref]
- Hubka M, Bolson EL, McDonald JA, Martin RW, Munt B, Sheehan FH (2002) Three-dimensional echocardiographic measurement of left and right ventricular mass and volume: in vitro validation. Int J Cardiovasc Imag 18: 111-118. [Crossref]
- Schindera ST, Mehwald PS, Sahn DJ, Kececioglu D (2002) Accuracy of real-time three-dimensional echocardiography for quantifying right ventricular volume: Static and pulsatile flow studies in an anatomic in vitro model. J Ultrasound Med 21: 1069-1075. [Crossref]
- Chen G, Sun K, Huang G (2006) In vitro validation of RV volume and mass measurement by real-time 3D echocardiography. Echocardiography 23: 395-399.
- Prakasa KR, Dalal D, Wang J, Bomma C, Tandri H, Dong J, et al. (2006) Feasibility and variability of three dimensional echocardiography in arrhythmogenic right ventricular dysplasia/cardiomyopathy. Am J Cardiol 97: 703-709. [Crossref]
- Shimada YJ, Shiota M, Siegel RJ, Shiota T (2010) Accuracy of right ventricular volumes and function determined by three-dimensional echocardiography in comparison with Magnetic Resonance Imaging: A meta-analysis study. J Am Soc Echocardiogr 23: 943-953. [Crossref]
- Soriano BD, Hoch M, Ithuralde A, Geva T, Powell AJ, et al. (2008) Matrix-array 3-dimensional echocardiographic assessment of volumes, mass, and ejection fraction in young pediatric patients with a functional single ventricle: a comparison study with cardiac magnetic resonance. Circulation 117: 1842-1848. [Crossref]
- Fuchs F, Laub G, Othomo K (2003) TrueFISP--technical considerations and cardiovascular applications. Eur J Radiol 46: 28-32. [Crossref]
- Scheffler K, Lehnhardt S (2003) Principles and applications of balanced SSFP techniques. Eur Radiol 13: 2409-2418. [Crossref]
- Plein S, Bloomer TN, Ridgway JP, Jones TR, Bainbridge GJ, Sivananthan MU (2001) Steady-State free precession magnetic resonance imaging of the heart: Comparison with segmented K-space gradient-echo imaging. J Magn Reson Imaging 14: 230-236. [Crossref]
- Jung BA, Hennig J, Scheffler K (2002) Single-breathhold 3D-trueFISP cine cardiac imaging. Magn Reson Med 48: 921-925. [Crossref]
- Lima JA, Desai MY (2004) Cardiovascular magnetic resonance imaging: current and emerging applications. J Am Coll Cardiol 44: 1164-1171. [Crossref]
- Beygui F, Furber A, Delépine S, Helft G, Metzger JP, et al. (2004) Routine breath-hold gradient echo MRI-derived right ventricular mass, volumes and function: accuracy, reproducibility and coherence study. Int J Cardiovasc Imag 20: 509-516. [Crossref]
- Baur LH (2008) Magnetic resonance imaging: the preferred imaging method for evaluation of the right ventricle. Int J Cardiovasc Imaging 24: 699-700. [Crossref]
- Jauhiainen T, Järvinen VM, Hekali PE (2002) Evaluation of methods for MR imaging of human right ventricular heart volumes and mass. Acta Radiol 43: 587-592. [Crossref]
- Grothues F, Moon JC, Bellenger NG, Smith GS, Klein HU, Pennell DJ (2004) Interstudy reproducibility of right ventricular volumes, function, and mass with cardiovascular magnetic resonance. Am Heart J 147: 218-223. [Crossref]
- Strugnell WE, Slaughter lR, Riley RA, Trotter AJ, Bartlett H (2005) Modified RV short axis series--a new method for cardiac MRI measurement of right ventricular volumes. J Cardiovasc Magn Reson 7: 769-774. [crossref]
- Alfakih K, Plein S, Bloomer T, Jones T, Ridgway J, Sivananthan M (2003) Comparison of right ventricular volume measurements between axial and short axis orientation using steady-state free precession magnetic resonance imaging. J Magn Reson Imaging 18: 25-32. [Crossref]
- Kirschbaum SW, Baks T, Gronenschild EH, Aben JP, Weustink AC, et al. (2008) Addition of the long axis information to short axis contours reduces interstudy variability of left-ventricular analysis in cardiac magnetic resonance studies. Invest Radiol 43: 1-6. [Crossref]