Abstract
Understanding mechanisms of reversibility in of hippocampal atrophy has taken on increased importance as the relationship between cortisol dysregulation and atrophy has become increasingly clear. Cushing’s disease provides a compelling model for understanding these mechanisms, particularly as atrophy is reversible following treatment to reduce the hypercortisolemia. The present study focused on comparing changes in the hippocampal formation (HPF) of Cushing’s disease patients before and after treatment. Each participant’s HPF volume was measured from MRIs collected prior to surgery and again one year after surgery. A least squares realignment model (LSRM) was used to register each patient’s HPF across hemispheres, time and patients. This procedure was successful in reducing inter- and intra-subject variability in HPF volume measurements. There was a significant interaction between HPF image number (anterior to posterior) from time 1 to time 2 (months 12 to 36) and remission status. Those with full remission (remitters) had increases in HPF volume, while those with partial or delayed remission (non-remitters) showed decreases in HPF volume. This interaction was found in the more anterior images of the HPF. Middle images showed improvement in the remitters and no change in the non-remitters. There was no change in HPF volume for the posterior images for either group. This study indicates that only a few additional months of cortisol dysregulation resulting from unsuccessful surgical treatment results in continued HPF atrophy, and that the hypercortisolemia-induced HPF atrophy may take up to one year to reverse after successful treatment. The result of the study also suggests that there may be regional differences in the susceptibility of the HPF to cortisol dysregulation.
Introduction
Interest has increased in recent decades about the effects of hypercortisolemia and/or cortisol dysregulation upon hippocampal integrity. Indeed, research from a number of disorders and with animal models suggests that cortisol dysregulation, of which hypercortisolemia is an example, can result in extensive hippocampal atrophy [1-12]. Some have argued that long-term exposure to excessive levels of cortisol has damaging effects on the hippocampus because cortisol inhibits glucose uptake primarily in the hippocampus, which is directly associated with stress management [13-16]. Others suggest that cortisol, as a marker of stress within the organism, provides a window into other, as yet undetermined, metabolic processes that contribute to the decline in hippocampal volume [17]. It is possible that cortisol dysregulation limits dendritic arborization and that cortisol dysregulation leaves neurons weakened and vulnerable, such that any additional stressor beyond chronic cortisol dysregulation may result in cell death [18-20]. A more limited number of studies suggest that for some disorders, reversibility of atrophy is possible [3,10]. Experimental animal models and human medical conditions that demonstrate significant variability in cortisol regulation could allow for a better understanding of how cortisol dysregulation is linked to hippocampal atrophy and, more importantly, how this atrophy might be reversed.
Cushing's disease (CD) is one such rare human condition that can be used to simulate both endogenous cortisol dysregulation and subsequent normalization with medical treatment. Studies with this population have formed one of the most provocative links in the chain towards understanding reversibility of both hippocampal atrophy and cognitive decrements in human studies [3,21-26]. In many ways, the study of CD forms an ideal “naturalistic” study of the effects of hypercortisolemia and its correction following successful treatment. Prior research has shown that normalization of cortisol levels in Cushing’s Syndrome (CS can increase the hippocampal volume up to 10% [3]. In another study, Starkman et al.[26] reported that all of the participants with CD had increased hippocampal volume after the normalization of cortisol levels which was not consistently evident in other comparison structures. Researchers also found a positive correlation between hippocampal volume and performance on the Selective Reminding Test (SRT), a learning/memory test [26]. Similarly, studies with major depressive disorder [15,27-31], animal models [17,18,32-34], healthy aging [6,14,35-38], treatment of medical conditions with glucocorticoids [10], Alzheimer’s disease [39-41], and post-traumatic stress disorder [42-44] support the relationship between stress, cortisol dysregulation, and hippocampal atrophy, although each type of study has particular challenges that limit inferences on the effects of cortisol dysregulation.
The current study focused on comparing changes in the hippocampal formation (HPF) of newly diagnosed Cushing's participants both pre- and post- treatment (treatment is most often transphenoidal microadenectomy). As hypercortisolemia is suspected as the cause for HPF volume decline, it was hypothesized that unsuccessful treatment for CD, or treatment that is delayed in effectiveness, will result in a continued decrease in bilateral HPF volume. On the contrary, it was expected that HPF volume would rapidly increase following successful resolution of hypercortisolemia in CD. In this study, all patients experienced cortisol dysregulation from the same source prior to treatment, which will allow for inferences to be drawn about the direction of hippocampal change that might be expected with even a few months more of dysregulated cortisol when compared to rapid and effective diminution of the problem with successful surgery. It is further hypothesized that those who are diagnosed with CD at a later age will show less dramatic reversal of HPF volumes, putatively because of a decline in cortical reserve. A significant relationship between degree of dysregulation (plasma cortisol levels) and HPF volume was also expected.
Method
Participants
Twenty-two participants (16 women and 6 men) were selected from a larger study of CS patients at the University of Michigan. All subjects were seen by a study investigator (DS) for a clinical evaluation to confirm a diagnosis of CD, to prescribe a treatment (typically transphenoidal microadenectomy), and for post-treatment follow-up. Twenty-one of the twenty-two participants suffered from CD, the most prevalent form of CS. Participants’ ages ranged from 8 to 73 years-old (M=42.7, SD=16.4). The participants’ level of education ranged from 3 to 18 years of formal education. Diagnosis of CD or CS was confirmed by DES using a standard protocol described previously [25,45]. Fifteen were determined to be responders, as evidenced by post-treatment eucortisolemia at 3 months, as opposed to non-responders, who exhibited continued or attenuated hypercortisolemia after surgery and up to three months post-treatment.
Design & procedure
The Hamilton Rating Scale for Depression [46] was used at time 1 to measure mood, with vegetative items removed (14-item) due to the high number of vegetative symptoms associated with CS. Plasma cortisol was measured every 2 hours for a 24-hour period beginning at 8 a.m. and these values were averaged together to create cortisol levels at time one and time two, respectively.
Participants received a magnetic resonance imaging (MRI) scan prior to the transphenoidal microadenomectomy treatment (time 1) and again 1 to 3 years post-surgery (time 2). Endocrine measurements were obtained within two weeks of these measurements as part of regular laboratory evaluations within the diagnostic workup. Non-remitter status was defined by the presence of hypercortisolemia 3-months post-surgery/treatment. Typically, medication (e.g. Ketaconazole) was used to control cortisol levels when surgical treatment was only partially ineffective. The informed consent process, approved by the University of Michigan Medical School IRB, was conducted with all patients and a document was signed to verify this consent.
All MRIs were performed using a General Electric Signa 1.5-Tesla MRI unit, either the echo speed version 5.5, or version 5.4. Spoiled gradient-echo sequences were employed using a quadrature head coil. This provides higher resolution imaging, and a more precise volumetric analysis of these tissues than a conventional spin-echo T1-weighted acquisition. This acquisition has no interslice gap and all images are acquired as a single volume of data. MRI measurements of the HPF were obtained in sections orthogonal to the long axis of the HPF in a canted coronal view. In almost all cases, the interslice width was 1.5 mm. A few older scans had interslice widths of 3 mm (N=3 of 44), in which case the interleaved image volumes were interpolated. Intracranial brain volume was assessed in a canted coronal section through the anterior commissure and perpendicular to the long axis of the HPF. Hippocampal images were manually traced (by DGH) in the regions of interest on each slice using GE software on a peripheral workstation according to established practices [47-50].
Least square realignment model
A least squares realignment model (LSRM) was used to align images from each participant’s HPF to the opposite hemisphere and over time. The participant used as a model HPF (MHPF), to which other hippocampi were matched, was a 32 year-old female with type 1 CD. A CD patient was used as the MHPF to eliminate potential challenges to the model in aligning a CD hippocampus with a healthy control hippocampus. To do so, the volume for each coronal segment of the HPF was numbered sequentially in relation to the image that passed through the most anterior visible portion of the anterior commissure (e.g., AC = image 0, 1 image posterior (-1) of the AC = image 1, See Figure 1 for the example). For the participant used as a model, images range from image 2 through image 23.
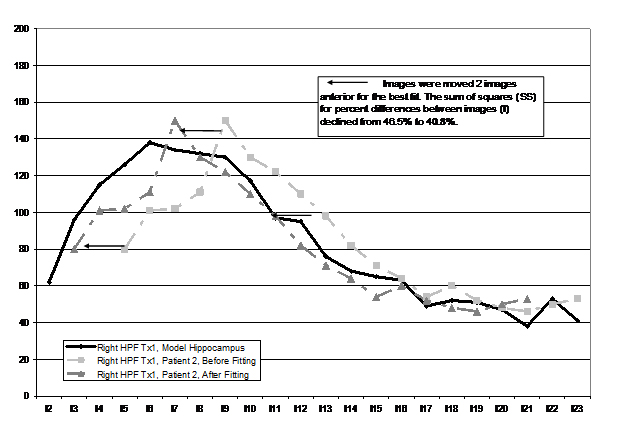
Figure 1.Example of the least squares alignment model
From this point, the right HPF of each patient was aligned with the MHPF by moving all images anterior or posterior up to six images. The move (or lack thereof) that resulted in the lowest least squares difference between the right participant’s HPF and the right MHPF was used as the final placement (e.g., plus 2, would be the conversion of an image that was originally image 3 to image 1; minus 2 would be conversion from image 3 to image 5). The LSRM procedure corrected for differences in placement within the scanner between time one and time two and across participants (i.e., rotation, yaw, and pitch). Conversions were completed manually and viewed visually in a manner identical to that seen in Figure 1). Once this was accomplished, the left HPF of the participant was aligned to the right HPF of the participant. Images from time two (re-measurement of the HPF one-two years after treatment) were first aligned (right time one to right time two) and then the left HPF was aligned to the right HPF (both time two). By implementing this LSRM procedure, we were able to control for participant’s placement within the scanner as it changed from time one to time two and to reduce the inter-subject variability in HP volume measurements. A check of the manipulation using paired t-tests revealed a significant improvement in all re-alignment procedures as measured by a significant reduction in sums of squares between images (Table 1).
|
|
Sum of Squares Before Realigning
|
Sum of Squares After Realigning
|
|
|
Time 1 Realignment
|
M SD
|
M SD
|
t p
|
|
Right HPF to Model HPF*
|
.51 .08
|
.47 .06
|
2.46 0.023
|
|
Right HPF to Left HPF
|
.32 .06
|
.28 .04
|
2.82 0.010
|
|
Time 1 to Time 2 Realignment
|
|
|
|
|
Right HPF to Right HPF
|
.47 .13
|
.40 .08
|
3.49 0.002
|
|
Left HPF to Left HPF
|
.48 .10
|
.40 .08
|
3.35 0.003
|
Table 1.Results of the implementation of the Least Squares Realignment Model.*Only this realignment is across subject. All other alignments are within subject
Figure 1 illustrates the similarity in structure shape attained by use of this procedure (only right HP images are included for each participant to reduce the complexity of the figure). In some older scans (as noted previously), image thickness was twice as large (3 mm vs. 1.5 mm) and the missing values were interpolated. Using a least squares method to align images for each participant enabled us to objectively quantify sections of the HPF by volume (head, body, and tail) as there was greater inter and intra-subject uniformity in measurement. There were twelve images present in every participant after the LSRM method was employed.
As a check on the integrity of the LSRM procedure, correlations were computed between total HPF volume (as traced manually by DGH) and LSRM hippocampal volume. These correlations were all highly significant (right, r = .93, p =.0001; left r = .91, p =.0001).
Results
Demographic comparisons between remitters and non-remitters
There were no significant differences between remitted (N=15) participants and non-remitted (N=7) participants in any of the demographic, treatment, HPF, or mood variables at time 1 or 2. There was a trend towards a larger right HPF tail in the non-remitter group compared to the remitter group (Z(22) = -1.94, p =.06). The non-remitter group had marginally higher average daytime plasma cortisol at time 2 compared to the remitter group (Z(22) = -1.94, p =.06), but the two groups did not differ in baseline cortisol levels prior to treatment (Z(22) = -0.74, p =.49). These results are reported in Table 2.
|
Domain/Test
|
Remitter, N=15
|
Non-Remitter, N=7
|
|
|
M
|
SD
|
M
|
SD
|
Z, X
|
p
|
|
Demographics
|
|
|
|
|
|
|
|
Age at Treatment
|
39
|
15.7
|
48.7
|
18.5
|
-1.09
|
0.3
|
|
Education at Treatment
|
13.5
|
3.8
|
13.9
|
1.9
|
-0.04
|
1
|
|
Gender
|
11 F, 4 M
|
|
5 F, 2M
|
|
0.01
|
0.93
|
|
HRSD Score at Treatment
|
9.4
|
5.4
|
11.7
|
4.7
|
-1.24
|
0.21
|
|
Plasma Cortisol at Treatment
|
22.9
|
11
|
18.9
|
3.2
|
-0.74
|
0.49
|
|
Plasma Cortisol at Time 2 †
|
5.9
|
3
|
8.8
|
3.1
|
-1.94
|
0.06
|
|
Days between first and second MRI
|
556.3
|
210.4
|
473.7
|
143.2
|
-0.53
|
0.64
|
|
Brain Volumes
|
|
|
|
|
|
|
|
Intracranial Brain Volume ^
|
9337.2
|
870.4
|
9381.1
|
799.5
|
0
|
1
|
|
Right
|
|
|
|
|
|
|
|
HPF Head Volume *
|
545.8
|
54.6
|
543.8
|
87.9
|
-0.32
|
0.78
|
|
HPF Body Volume *
|
389.1
|
50.3
|
402.9
|
41.9
|
-0.92
|
0.37
|
|
HPF Tail Volume *
|
248.1
|
36.2
|
282.1
|
38.3
|
-1.94
|
0.06
|
|
HPF Total Volume *
|
1183
|
110.9
|
1228.8
|
143.1
|
-0.96
|
0.34
|
|
Left
|
|
|
|
|
|
|
|
HPF Head Volume *
|
473.6
|
75.5
|
507.1
|
111.2
|
-0.92
|
0.37
|
|
HPF Body Volume *
|
349.4
|
45.7
|
370
|
49.7
|
-0.74
|
0.49
|
|
HPF Tail Volume *
|
239.2
|
28.1
|
257.5
|
43.2
|
-1.1
|
0.3
|
|
HPF Total Volume *
|
1062.2
|
118.5
|
1134.6
|
177.2
|
-1.02
|
0.33
|
Table 2.Remitter and non-remitter groups demographic, brain, and cognitive variables.
Effect of treatment on hippocampal volume
A 2*2*2 repeated measures ANOVA was computed with remission status, side, and time as the independent variables and volume in each image (numbered lowest to highest proceeding anterior [IM0 is through the anterior AC] to posterior with increasing numbers) at each of the two time points as the dependent variables. When the interaction between image, time, and remission status is examined, this interaction was significant (F (11,462) = 2.91, p = .01). Notably, the impact of time and remission status was most obvious in the anterior HP images (See Figure 2), with increased volume in remitted patients and decreased volume in non-remitted patients. The interaction between time of measurement (1 or 2) and treatment status was not significant (F(11,462) =1.70, p = .20). There was no impact of side in any of the interaction effects, while the main effect for side was significant with right HPF greater than left HPF in volume at time 1 and time 2 (F(1,42)=5.52, p = .02), which is consistent with the known volume differences between right and left HPF volume.
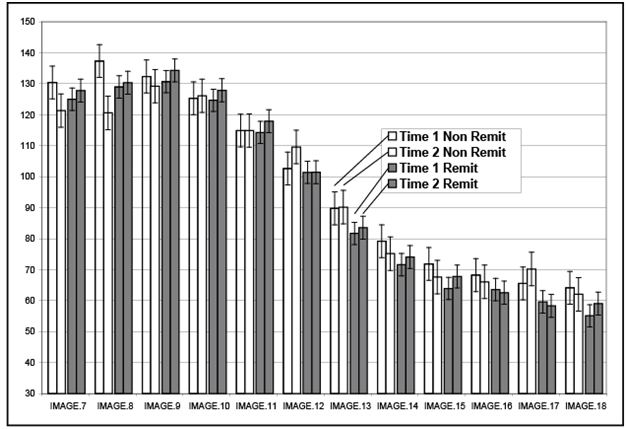
Figure 2.Hippocampal changes in images, from anterior to posterior,by remission status
Table 3 illustrates the positive and negative effects of remission status (e.g., hypercortisolemia), which are most evident in the anterior and middle portions of the HPF, but not the tail. Although not significant (F (2,80) = 1.24, p = .30), there was a marked laterality difference in percent improvement for the four most anterior images of the HPF in the remitted group, with greater change in the left (4.7%) as compared to the right (1.5%) HPF. A similar effect was noted in the four middle images, with 5.6% change in the left and 1.1% change in the right. This laterality effect was not evident in the four most posterior images (4.1% left and 4.2% right).
| |
Time 1
|
Time 2
|
|
|
Remitter
|
Non-Remitter
|
Remitter
|
Non-Remitter
|
|
Head
|
509.3
|
525.4
|
520.3
|
497.3
|
|
Body
|
369
|
386.5
|
377
|
389.8
|
|
Tail
|
242.2
|
269.8
|
247.8
|
265.9
|
Table 3. Region by remission status changes in remitter vs. non-remitter groups.
Age and cortisol effects of hippocampal recovery following treatment of CD
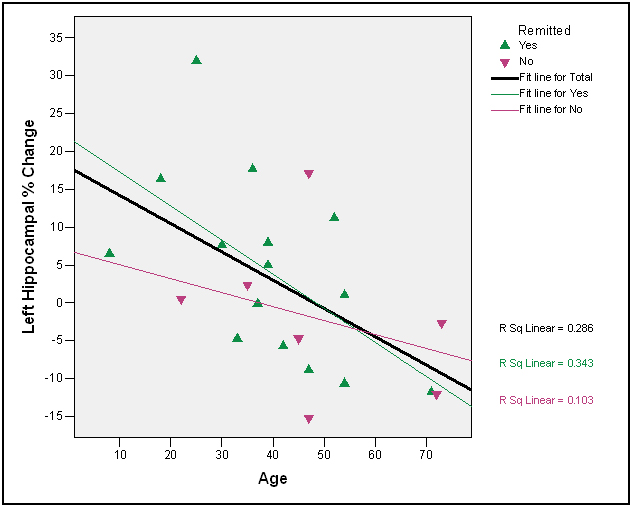
There was only one significant correlation between age and degree of post-treatment HP volume recovery in the right HPF (right HPF tail, r=-.49, p =.02), although the other correlations for the anterior and posterior HPF sections were in the expected direction (r = -.33, p =.13, r = -.24, p =.29, respectively). There were two significant correlations between age and degree of post-treatment HP volume recovery in the left HPF (left HPF head, r=-.43, p =.04; left HPF body, r=-.49, p =.02, Figure 3); the correlations for the left HPF tail were in the expected direction and at the trend level (r = -.37, p =.10). The correlations between initial level of hypercortisolemia and degree of post-treatment HPF volume recovery were not significant, even when non-remitters were excluded (absolute r’s < .40, p’s>.28).
2021 Copyright OAT. All rights reserv
Figure 3. Left hippocampal change as a function of age and remission status
Discussion
Results of the present study indicate that there is marked change in HPF volume before and after surgery in those who did and did not respond to treatment at first intervention. At post-surgery, those who remit rapidly from CS show a marked increase in hippocampus volume within the ensuing 12 to 36 months, consistent with our prior results and obtained in a new sample [3,26]. One novel finding in the present study was for those patients who do not remit within the first three months. The hippocampal volumes of these patients continue to decline, particularly in the anterior portion of the hippocampus.
The relationships between age and degree of hippocampal recovery were in the expected direction; three of the six correlations were significant, and two of the remaining three were at the trend level. A number of successful remitters over the age of 50 had either no difference at all in hippocampal volume following treatment or the percent of change was negative as indicated in Figure 3. These findings are consistent with a cognitive reserve hypothesis in the elderly [51-53]. The ability of the older brain to respond following correction of hypercortisolemia appears diminished. An alternative hypothesis not addressed by the present study is that recovery of HPF volume in older patients is delayed.
As noted, there was a significant decline in anterior hippocampal volume for non-remitters. It is not clear why the anterior hippocampus might be more susceptible to hypercortisolemia, and, more plastic in response to hypercortisolemia reversal. In animals, reductions in glucocorticoid receptors (GRs) and mineralocorticoid receptors (MRs) mRNA in the anterior hippocampus of tree shrews exposed to social confrontation. After the exposure period, the posterior hippocampus showed decreased GR and increased MR mRNA. One hypothesis to these results is that there are regional differences in how cortisol is processed within the hippocampus, which may relate functionally to potential regional distributions of cognitive functions in the hippocampus [54-58]. Such increase in hippocampal MR mRNA in response to stress may have cognitive implications. Alternatively it may be related to the degree of emotional discomfort that is associated with cortisol dysregulation.
There is no significant relationship between degrees of cortisol dysregulation, or hypercortisolemia and hippocampal change following treatment, either for the entire group, or for responders alone. After experiencing stress level hypercortisolemia throughout the entire day for a minimum of several months up to several years, the impact of additional cortisol increases may not be linearly related. In our prior work we found significant relationships between cortisol concentrations, mood and cognitive function prior to treatment in a larger sample [59]. Significant relationships between cortisol levels and degree of cognitive difficulty have been reported in other studies of subjects that have greater variability in levels of cortisol, which might suggest some restriction of range in the present sample [28,36,37,60,61].
The small sample size inherent in studies of less frequent conditions like Cushing’s disease can be considered a weakness of this study. Despite the small sample size, significant increases in hippocampal volume with successful treatment were found with a novel finding of continued volumetric decline if treatment is ineffective in rapidly reducing hypercortisolemia. Volume changes, both increases with successful treatment and decreases with unsuccessful treatment, were present primarily in the anterior most images of the hippocampus. This suggests that 1) this area of the hippocampus is more vulnerable to cortisol elevations, and 2) that the anterior hippocampus possesses the greater plasticity towards responding following successful treatment. Lack of a pre-morbid hippocampal measurement leaves interpretations of change, or the lack thereof, in the hippocampus somewhat difficult to interpret. For example, a 5% decline in volume followed by a 5% increase post-treatment would be an optimal outcome. Even with an increase, there might not be a complete reversal of volume loss, say a 15% decline followed by a 5% increase. Nonetheless, the present study showed elevated cortisol elicited a process characterized by continuing hippocampal decline in volume with continued exposure over time, improvement in hippocampal volume with successful treatment, and that both of these effects are more pronounced in the anterior portion of the hippocampus.
Acknowledgements
This work was supported by a General Clinical Research Center grant (# MO1 RR00042) and NIH grant (#R01DK/MH51337) to MS. The assistance of a number of assistants was essential in the completion of this work; Justin B Miller, BA; Benjamin Long, BA, BS; Emily Anderson, BA; Luis Casenas, BA; Emilie Johnson, BA; Matt Brown, BA; and Ricardo Benitez.
References
- Czéh B, Michaelis T, Watanabe T, Frahm J, de Biurrun G, et al. (2001) Stress-induced changes in cerebral metabolites, hippocampal volume, and cell proliferation are prevented by antidepressant treatment with tianeptine. Proc Natl AcadSci U S A 98: 12796-12801. [Crossref]
- Liberzon I, Phan KL (2003) Brain-imaging studies of posttraumatic stress disorder. CNS Spectr 8: 641-650. [Crossref]
- Starkman MN, Giordani B, Gebarski SS, Berent S, Schork MA, et al. (1999) Decrease in cortisol reverses human hippocampal atrophy following treatment of Cushing's disease. Biol Psychiatry 46: 1595-1602. [Crossref]
- O'Brien JT, Lloyd A, McKeith I, Gholkar A, Ferrier N (2004) A longitudinal study of hippocampal volume, cortisol levels, and cognition in older depressed subjects. Am J Psychiatry 161: 2081-2090. [Crossref]
- de Leon MJ, McRae T, Tsai JR, George AE, Marcus DL, et al. (1988) Abnormal cortisol response in Alzheimer's disease linked to hippocampal atrophy. Lancet 2: 391-392. [Crossref]
- Wolf OT, Convit A, de Leon MJ, Caraos C, Qadri SF (2002) Basal hypothalamo-pituitary-adrenal axis activity and corticotropin feedback in young and older men: relationships to magnetic resonance imaging-derived hippocampus and cingulate gyrus volumes. Neuroendocrinology 75: 241-249. [Crossref]
- Ohl F, Michaelis T, Vollmann-Honsdorf GK, Kirschbaum C, Fuchs E (2000) Effect of chronic psychosocial stress and long-term cortisol treatment on hippocampus-mediated memory and hippocampal volume: a pilot-study in tree shrews. Psychoneuroendocrinology 25: 357-363. [Crossref]
- Greendale GA, Kritz-Silverstein D, Seeman T, Barrett-Connor E (2000) Higher basal cortisol predicts verbal memory loss in postmenopausal women: Rancho Bernardo Study. J Am Geriatr Soc 48: 1655-1658. [Crossref]
- Sapolsky RM, Uno H, Rebert CS, Finch CE (1990) Hippocampal damage associated with prolonged glucocorticoid exposure in primates. J Neurosci 10: 2897-2902. [Crossref]
- Brown ES, J Woolston D, Frol A, Bobadilla L, Khan DA, et al. (2004) Hippocampal volume, spectroscopy, cognition, and mood in patients receiving corticosteroid therapy. Biol Psychiatry 55: 538-545. [Crossref]
- van der Beek EM, Wiegant VM, Schouten WG, van Eerdenburg FJ, Loijens LW, et al. (2004) Neuronal number, volume, and apoptosis of the left dentate gyrus of chronically stressed pigs correlate negatively with basal saliva cortisol levels. Hippocampus 14: 688-700. [Crossref]
- MacLullich AM, Deary IJ, Starr JM, Ferguson KJ, Wardlaw JM, et al. (2005) Plasma cortisol levels, brain volumes and cognition in healthy elderly men. Psychoneuroendocrinology 30: 505-515. [Crossref]
- Convit A, Wolf OT, Tarshish C, de Leon MJ (2003) Reduced glucose tolerance is associated with poor memory performance and hippocampal atrophy among normal elderly. Proc Natl Acad Sci U S A 100: 2019-2022. [Crossref]
- de Leon MJ, McRae T, Rusinek H, Convit A, De Santi S, et al. (1997) Cortisol reduces hippocampal glucose metabolism in normal elderly, but not in Alzheimer's disease. J Clin Endocrinol Metab 82: 3251-3259. [Crossref]
- Drevets WC, Price JL, Bardgett ME, Reich T, Todd RD, et al. (2002) Glucose metabolism in the amygdala in depression: relationship to diagnostic subtype and plasma cortisol levels. Pharmacol Biochem Behav71: 431-447. [Crossref]
- Rotllant D, Ons S, Carrasco J, Armario A (2002) Evidence that metyrapone can act as a stressor: effect on pituitary-adrenal hormones, plasma glucose and brain c-fos induction. Eur J Neurosci 16: 693-700. [Crossref]
- Lee AL, Ogle WO, Sapolsky RM (2002) Stress and depression: possible links to neuron death in the hippocampus. Bipolar Disord 4: 117-128. [Crossref]
- Kole MH, Czéh B, Fuchs E (2004) Homeostatic maintenance in excitability of tree shrew hippocampal CA3 pyramidal neurons after chronic stress. Hippocampus 14: 742-751. [Crossref]
- Lee AL, Ogle WO, Sapolsky RM (2002) Stress and depression: possible links to neuron death in the hippocampus. Bipolar Disord 4: 117-128. [Crossref]
- Leitch MM, Ingram CD, Young AH, McQuade R, Gartside SE (2003) Flattening the corticosterone rhythm attenuates 5-HT1A autoreceptor function in the rat: relevance for depression. Neuropsychopharmacology 28: 119-125. [Crossref]
- 1961 Cushing's Syndrome; The Human Adrenal Gland. In: Soffer, L. (Ed.), pp. 441-491.
- Cohen SI (1980) Cushing's syndrome: a psychiatric study of 29 patients. Br J Psychiatry 136: 120-124. [Crossref]
- Dorn LD, Burgess ES, Friedman TC, Dubbert B, Gold PW, et al. (1997) The longitudinal course of psychopathology in Cushing's syndrome after correction of hypercortisolism. J ClinEndocrinolMetab 82: 912-919. [Crossref]
- Schteingart DE (1989) Cushing's syndrome. Endocrinol Metab Clin North Am 18: 311-338. [Crossref]
- Starkman MN, Gebarski SS, Berent S, Schteingart DE (1992) Hippocampal formation volume, memory dysfunction, and cortisol levels in patients with Cushing's syndrome. Biol Psychiatry 32: 756-765. [Crossref]
- Starkman MN, Giordani B, Gebarski SS, Schteingart DE (2003) Improvement in learning associated with increase in hippocampal formation volume. Biol Psychiatry 53: 233-238. [Crossref]
- Brown ES, Varghese FP, McEwen BS (2004) Association of depression with medical illness: does cortisol play a role? Biol Psychiatry 55: 1-9. [Crossref]
- O'Brien JT, Lloyd A, McKeith I, Gholkar A, Ferrier N (2004) A longitudinal study of hippocampal volume, cortisol levels, and cognition in older depressed subjects. Am J Psychiatry 161: 2081-2090. [Crossref]
- Sheline YI, Gado MH, Kraemer HC (2003) Untreated depression and hippocampal volume loss. Am J Psychiatry 160: 1516-1518. [Crossref]
- Sheline YI, Wang PW, Gado MH, Csernansky JG, Vannier MW (1996) Hippocampal atrophy in recurrent major depression. Proc Natl AcadSci U S A 93: 3908-3913. [Crossref]
- Bremner JD, Narayan M, Anderson ER, Staib LH, Miller HL, et al. (2000) Hippocampal volume reduction in major depression. Am J Psychiatry 157: 115-118. [Crossref]
- Magariños AM, McEwen BS, Flügge G, Fuchs E (1996) Chronic psychosocial stress causes apical dendritic atrophy of hippocampal CA3 pyramidal neurons in subordinate tree shrews. J Neurosci 16: 3534-3540. [Crossref]
- McEwen B, Brinton R, Harrelson A, Rostene W(1987) Modulatory interactions between steroid hormones, neurotransmitters and neuropeptides in hippocampus. In: Nerozzi, D., Goodwin, FK., Costa, E. (Eds.), Hypothalamic Dysfunction in Neuropsychiatric Disorders. Raven Press, New York.
- Mcewen BS (1982) Glucocorticoids and hippocampus: Receptors in search of a function. In: D., G., D., P. (Eds.), Adrenal actions on brain. Springer-Verlag, New York.
- Lupien S, Lecours AR, Lussier I, Schwartz G, Nair NP, et al. (1994) Basal cortisol levels and cognitive deficits in human aging. J Neurosci 14: 2893-2903. [Crossref]
- Lupien SJ, de Leon M, de Santi S, Convit A, Tarshish C, et al. (1998) Cortisol levels during human aging predict hippocampal atrophy and memory deficits. Nat Neurosci 1: 69-73. [Crossref]
- Lupien SJ, de Leon M, de Santi S, Convit A, Tarshish C, et al. (1998) Cortisol levels during human aging predict hippocampal atrophy and memory deficits. Nat Neurosci 1: 69-73. [Crossref]
- Seeman TE, McEwen BS, Singer BH, Albert MS, Rowe JW (1997) Increase in urinary cortisol excretion and memory declines: MacArthur studies of successful aging. J Clin Endocrinol Metab 82: 2458-2465. [Crossref]
- Davis KL, Davis BM, Greenwald BS, Mohs RC, Mathé AA, et al. (1986) Cortisol and Alzheimer's disease, I: Basal studies. Am J Psychiatry 143: 300-305. [Crossref]
- de Leon MJ, McRae T, Tsai JR, George AE, Marcus DL, et al. (1988) Abnormal cortisol response in Alzheimer's disease linked to hippocampal atrophy. Lancet 2: 391-392. [Crossref]
- Weiner MF, Vobach S, Svetlik D, Risser RC (1993) Cortisol secretion and Alzheimer's disease progression: a preliminary report. Biol Psychiatry 34: 158-161. [Crossref]
- Bremner JD, Randall P, Scott TM, Bronen RA, Seibyl JP, et al. (1995) MRI-based measurement of hippocampal volume in patients with combat-related posttraumatic stress disorder. Am J Psychiatry 152: 973-981. [Crossref]
- Bremner JD, Randall P, Vermetten E, Staib L, Bronen RA, et al. (1997) Magnetic resonance imaging-based measurement of hippocampal volume in posttraumatic stress disorder related to childhood physical and sexual abuse--a preliminary report. Biol Psychiatry 41: 23-32. [Crossref]
- Yehuda R, Halligan SL, Grossman R, Golier JA, Wong C (2002) The cortisol and glucocorticoid receptor response to low dose dexamethasone administration in aging combat veterans and holocaust survivors with and without posttraumatic stress disorder. Biol Psychiatry 52: 393-403. [Crossref]
- Schteingart DE, McKenzie AK (1980) Twelve-hour cycles of adrenocorticotropin and cortisol secretion in Cushing's disease. J Clin Endocrinol Metab 51: 1195-1198. [Crossref]
- Hamilton M (1960) A rating scale for depression. J Neurol Neurosurg Psychiatry 23: 56-62. [Crossref]
- Jack CR Jr, Theodore WH, Cook M, McCarthy G (1995) MRI-based hippocampal volumetrics: data acquisition, normal ranges, and optimal protocol. Magn Reson Imaging 13: 1057-1064. [Crossref]
- Jack CR Jr, Petersen RC, Xu YC, Waring SC, O'Brien PC, et al. (1997) Medial temporal atrophy on MRI in normal aging and very mild Alzheimer's disease. Neurology 49: 786-794. [Crossref]
- Jack CR Jr, Twomey CK, Zinsmeister AR, Sharbrough FW, Peterson RC, et al.(1989)Anterior temporal lobes and hippocampal formations: normative volumetric measurements from MR images in young adults. Radiology 172: 549-554. [Crossref]
- Jack CR Jr, Bentley MD, Twomey CK, Zinsmeister AR (1990) MR imaging-based volume measurements of the hippocampal formation and anterior temporal lobe: validation studies. Radiology 176: 205-209. [Crossref]
- Habeck C, Hilton HJ, Zarahn E, Flynn J, Moeller J, et al. (2013) Relation of cognitive reserve and task performance to expression of regional covariance networks in an event-related fMRI study of nonverbal memory. Neuroimage 20: 1723-1733. [Crossref]
- Scarmeas N, Zarahn E, Anderson KE, Hilton J, Flynn J, et al. (2003) Cognitive reserve modulates functional brain responses during memory tasks: a PET study in healthy young and elderly subjects. Neuroimage 19: 1215-1227. [Crossref]
- Whalley LJ, Deary IJ, Appleton CL, Starr JM (2004) Cognitive reserve and the neurobiology of cognitive aging. Ageing Res Rev 3: 369-382. [Crossref]
- Gonzalo D, Shallice T, Dolan R (2000) Time-dependent changes in learning audiovisual associations: a single-trial fMRI study. Neuroimage11: 243-255. [Crossref]
- Strange BA, Duggins A, Penny W, Dolan RJ, Friston KJ (2005) Information theory, novelty and hippocampal responses: unpredicted or unpredictable? Neural Netw 18: 225-230. [Crossref]
- Johnson JD (2005) Dysfunction of the anterior hippocampus: the cause of fundamental schizophrenic symptoms? Med Hypotheses 65: 55-60. [Crossref]
- Tesche CD (1997) Non-invasive detection of ongoing neuronal population activity in normal human hippocampus. Brain Res 749: 53-60. [Crossref]
- Meulenbroek O, Petersson KM, Voermans N, Weber B, Fernández G (2004) Age differences in neural correlates of route encoding and route recognition. Neuroimage 22: 1503-1514. [Crossref]
- Starkman MN, Giordani B, Berent S, Schork MA, Schteingart DE (2001) Elevated cortisol levels in Cushing's disease are associated with cognitive decrements. Psychosom Med 63: 985-993. [Crossref]
- MacLullich AM, Deary IJ, Starr JM, Ferguson KJ, Wardlaw JM, et al. (2005) Plasma cortisol levels, brain volumes and cognition in healthy elderly men. Psychoneuroendocrinology 30: 505-515. [Crossref]
- Brown ES, J Woolston D, Frol A, Bobadilla L, Khan DA, et al. (2004) Hippocampal volume, spectroscopy, cognition, and mood in patients receiving corticosteroid therapy. Biol Psychiatry 55: 538-545. [Crossref]