Abstract
Tumor infiltrating lymphocytes (TILs) that are present in cancer microenvironment secrete pro-inflammatory cytokines, including interleukin-2 (IL-2) and interferon-gamma (INFγ). On the other hand, tumor cells develop various immune evasion mechanisms, including the down-regulation of anti-tumor immune responses. In this study, we used MCF7 cells (a human breast cancer cell line) as target cells to stimulate specific populations of human peripheral blood mononuclear cells (PBMCs) in vitro. We evaluated effector T cell responses in the context of cytokine secretion, in the presence or absence of IL-2. Our data show that MCF7 cells almost completely (99%) inhibited IFNγ secretion, suggesting a regulatory activity of MCF7 cells. IL-2 completely reversed this MCF7 inhibition, and induced IFNγ secretion 4 folds higher. Interestingly, results with Cytokine Secretion Assay (CSA) confirmed the above results and showed that the percentages of IFNγ-secreting T cells were 11 times lower in cultures containing a mixture of PBMCs and MCF7 cells, compared with PBMC control. Consistently, IL-2 completely reversed this MCF7 inhibition, where the percentage of IFNγ-secreting cells increased up to 14 times higher compared to PBMC control. Additionally, purification of MCF7-sepcfic, CD45+, IFNγ-secreting effector cells led to a significant increase from 1.54% up to 92% purity. Purified effector IFNγ-secreting cells induced 58% apoptosis in MCF7 target cells, compared with 18% in non-target cells. Collectively, this study presents data that demonstrate the possibility of generating and purifying cancer-specific, IFNγ-secreting, effector T cells in vitro that were able to induce apoptosis in target cancer cells in a cell specific manner.
Key words
cancer immunotherapy, cytokine secretion assay, IFNγ, Anti-tumor cytokines, MCF7
Introduction
According to the world health organization, Breast cancer is the most frequent neoplasm among women [1,2]. Failure of immune surveillance against cancer cells is a major contributing factor [3]. In healthy individuals, the immune system is very effective in detecting and eliminating cancer cells at very early stages of cancer development [4]. However, tumor cells may develop immune evasion strategies that interfere with the anti-tumor immunity of the immune system by down-regulating differentiation, activation and proliferation of effector lymphocytes and macrophages [5,6].
Breast cancers have been shown to be infiltrated with different populations of immune cells including tumor-infiltrating lymphocytes (TILs) [7], Natural killer (NK) cells and macrophages [7]. They enrich tumor microenvironment with cytokines that may up-regulate the anti-cancer immune response [8,9]. On the other hand, cancer cells stimulate regulatory T cells (Treg) to secrete immunosuppressive tumor-derived soluble factors (TDSFs) [10]. These factors have been shown to play roles in immune suppression, cancer cell growth, and angiogenesis [11]. Immune suppression is mediated by vascular endothelial growth factor (VEGF) [12,13], interleukin-10 [IL-10] [14] and transforming growth factor Beta (TGFβ) [15]. These TDSFs exert profound effects on T cells by shifting the T helper 1(Th1): T helper 2 (Th2) ratio towards Th2 that inhibit cell-mediated immunity [16], and inhibit T cell activation by down-regulating IL-2 receptor on T cells and interfering with IL-2 secretion [17,18].
In anti-tumor immunity, T cell activation and IL-2 production are triggered by peptide: MHC complex recognition by T cell receptor, and co-stimulatory signals triggered by engagement of CD80 on antigen presenting cells (APCs) with CD28 on T cells [19]. However, tumor cells interfere with cell-mediated immune response by inhibiting antigen presentation on MHC class II, down regulating co-stimulatory signals, and down regulating MHC class I [20], thereby preventing tumor recognition by T cells. Treg cells play a critical role in anti-tumor immune suppression, by expressing CTLA-4 that binds CD86 on APCs with a higher affinity than CD28 on T cells, thereby inhibiting IL-2 secretion by T cells [11,21,22].
Anti-tumor cytokines, such as tumor necrosis factor alpha (TNFα), interferon Gamma (IFNγ) and intrleukin-2 (IL-2), are secreted by immune cells that infiltrate the tumor [23]. These anti-tumor cytokines induce lymphocyte differentiation and proliferation, inhibit proliferation, and induce apoptosis in tumor cells [8]. IL-2 has been approved by FDA for cancer treatment [24]; however, it is toxic in vivo with poor drug half-life in circulation [25]. On the other hand, researchers have shown that adoptive immunotherapy was effective in enhancing the body’s immune response to fight cancer cells by expanding patient’s own TILs in vitro in cultures containing IL-2, followed by re-injection of the in vitro-stimulated TILs into tumor site [26]. Their results showed increased TIL numbers combined with an increase in TNF and IFNγ concentrations. Paradoxically, IL-2 has been shown to indirectly boost Treg-mediated immune suppression and this Treg boost reversed and Tregs were suppressed when significant amount of IL-2 were added to culture. Together, these results have shed the light on the role of IL-2 in regulating tumor development and show the undisputed anti-cancer effects of IL-2 [27], and present a possible utilization for this important cytokine in fighting cancers [27]. In a recent study, researchers have shown that immune therapy of CD19+ B cell leukemia was successful by infusing the patient’s autologous T cells that express chimeric antigen receptor with specificity for the B-cell antigen CD19 [28,29], coupled with CD137 co-stimulatory receptor in T cells and CD3-zeta signal-transduction component of the T-cell antigen receptor signaling domains [29]. Their results showed that the infused T cells expanded 1000 times in vivo even though they were infused at very low doses (1.5X10⁵/kg of patient). Their results further demonstrated the infused cells persisted in the blood and bone marrows of patients for more than six months, while still carrying the antigen specificity to CD19. This therapy was used in patients with refractory chronic lymphocytic leukemia (CLL) and led to a specific immune response that was detected in the bone marrow, accompanied by loss of normal B cells and leukemia cells that express CD19 [29].
In this study, we present data that demonstrate the possibility of raising cancer-specific, IFNg secreting effector T cells that might be employed in anti-tumor immune responses. We show that IFNγ secretion by T cells in response to co-culture with MCF7 cells was inhibited by MCF7 cells, and this inhibition was reversed to much higher levels by the addition of IL-2. These results suggest that IFNγ secretion plays an important role in anti-cancer immunity, and therefore is targeted for inhibition by cancer cells. Interestingly, our results show that purified, IFNγ-secreting cells induced marked apoptosis in MCF7 target cells in a specific manner. Together, the results presented in this report show that antigen-specific T cells may be utilized in anti-cancer therapeutic approaches by inducing apoptosis in target cells in a specific manner.
Materials and methods
The protocol used in this study, and which involved samples obtained from human subjects has been approved by the Stem Cells of Arabia (SCA)/Amman-Jordan IRB committee for the utilization of human biological samples in research purposes in 2009, in conformation to the terms of the Declaration of Helsinki and Belmont report. The protocol has also been endorsed by the Ethical Committee of Jordan University of Science and Technology (JUST).
Isolation of peripheral blood mononuclear cells (PBMC)
We used 12-14 ml of peripheral blood (PB) from 32 volunteers. The blood was kept at room temperature (RT), diluted 1:2 with phosphate buffer saline (PBS). Isolation of PBMCs was achieved by density gradient centrifugation (DGC) with Ficoll-Paque (1.077) according to previously published procedures [30]. PBMCs were then counted and re-suspended at 107 cells/ml in culture media (RPMI-1640 media; Gibco Life Technologies) supplemented with Glutamate, Penicillin, streptomycin, and 10% Fetal Calf Serum.
T-Cell stimulation cultures in-vitro
MCF7 Breast cancer cell line was used in our system as target cells. PBMCs were co-cultured with MCF7 cells at 5:1 ratio of E:T in a 12-well tissue culture plate. As controls, PBMCs and MCF7 cells were cultured each in a separate well, and were treated the same way as other culture variables. IL-2 was added to duplicate wells at a concentration of 1 µl/ml. All the above cultures were incubated in 37°C incubators with 5-7% CO2 for 4-5 days. After stimulation, both cells and culture media were collected separately for the different downstream assays. Cells were centrifuged at 300 × g for 10 min at 4°C, and were further treated for Cytokine Secretion Assay (CSA) as described below. Supernatants were collected separately and were treated according to specific protocols for Cytometric Bead Array (CBA), as described below.
Cytometric bead array (CBA)
To measure the levels of secreted cytokines in the above cultures, we used the Th1/Th2 Cytometric Bead Array (CBA) (BD Biosciences, USA) according to manufacturer's protocols. First, the Cytokine Standards were prepared by reconstituting Human Th1/Th2 Cytokine Standards in 0.2 ml of Assay Diluent to prepare a 10x bulk standards. Nine tubes were labeled in the order: Top Standards, 1:2, 1:4, 1:8, 1:16, 1:32, 1:64, 1:128 and 1:256. Human Th1/Th2 Cytokine Standards were then diluted by serial dilutions using the assay diluents. Then, each Human Cytokine Capture Bead suspension was mixed and used at 10 µl/test, and 50 µl of mixed beads were transferred to each assay tube. Then, PE Detection Reagent was added at 50 µl/test, and Standard Dilutions were added to the appropriate sample tubes at 50 µl/test. All tubes were incubated at room temperature for 3 hours in the dark, and were then washed with 1ml wash buffer then centrifuged at 200 × g for 5min. Finally, 300 µl of wash buffer were added to each assay tube to allow for flow cytometry analyses.
Cytometer Setup Bead tubes were prepared by labeling three tubes: A, B and C. 50 µl/tube of Cytometer Setup Beads were added to all three tubes. 50 µl of FITC positive control were added to tube B, and 50 µl of PE positive control were added to tube C. All tubes were incubated at room temperature for 30 minutes in the dark. Then, 400 µl of wash buffer were added to tubes B and C, and 450 µl to tube A, B, and C setup tubes were used for flow cytometer setup before running the samples in Flow Cytometry analysis.
Cytokine secretion assay (CSA)
Cells in different culture conditions were assayed to determine the percentages of IFNγ secreting cells using the Cytokine Secretion Assay (CSA) (Miltenyi Biotec, GmbH, Bergisch Gladbach, Germany) according to manufacturer's protocols. Cells were kept at 4°C at all times during this assay. All the numbers below are for samples containing up to 107 cells per sample. Briefly, cells were counted, washed by adding 10 ml of cold PBS buffer and centrifuged at 300 × g for 10 min at 4°C. The supernatants were removed, and cell pellets were resuspended in 80 ul of cold RPMI medium per 107 cells. Then, 20 ul of anti-IFNγ catch reagent was added, and the cells were incubated on ice for 5 minutes. The catch reagent is made up of two antibodies bound to each other at the Fc regions; the first is anti-CD45 antibody that allows the catch reagent to bind to all CD45+ white blood cells (PBMCs), while the other antibody is anti-IFNg antibody that binds to the IFNγ secreted by the same cell. To allow secretion of cytokine by activated cells, 10 ml of warm media were added, and the cells were allowed to secrete cytokines by incubating them for 45 minutes at 37°C in CO2 incubator, with slow and gentle shaking to prevent cross-catching of cytokines by other non-secreting cells. At the end of the secretion period, cells were immediately removed from the incubator and put on ice. The tubes were filled with cold buffer up to 15 ml, and were washed as described above. Cells were then resuspended in 80 ul of buffer, and 20 ul of anti-IFNγ-PE detection antibody were added to each tube, and cells were incubated for 10 minutes at 4°C to allow the binding of anti-IFNγ antibody to IFNγ molecules on the catch reagent, on the surface of CD45+ cells. To allow for magnetic purification of IFNγ-secreting cells, we used the MACS® magnetic purification strategy (Miltenyi Biotec). Cells were washed as described above and were resuspended in 80 ul; then 20 ul of anti-PE Microbeads were added to the cells and were incubated at 4-8°C for 15 minutes. Then, cells were washed as described above and resuspended in 500 ul of buffer. 25 ul of cells from each sample were taken for flow cytometric analyses. These are the unpurified original (ORI) samples. To purify IFNγ-secreting cells, we used two MS columns (Miltenyi Biotec) to obtain higher purities. The columns were first prepared by washing with 500 ul of buffer, and effluents were discarded. Washed MS columns were placed onto the MiniMACS® separator magnet, while a 15 ml conical tube was placed under the magnet to collect the effluents. Cells were passed through a 70 µ filter to remove cell clumps, and were then loaded onto the prepared columns. Magnetically labeled cells (IFNγ-secreting cells) were trapped on the column, whereas non secreting cells flew through and were collected in the conical tube beneath the column. The column was washed three times, each with 500 ul of buffer. Then, the column was removed from the magnet and the cells were flushed into a new column setting onto the magnet to repeat the purification process in order to increase the purity of the target cell populations. The new column was washed as described above. The IFNγ-secreting cells were finally eluted from the second column into a fresh conical tube and were washed as described above. Samples of the IFNγ-secreting cells (positive fraction (POS)) and the non IFNγ-secreting cells (negative fraction (NEG)) were taken for flow cytometry. Cells from both IFNγ-secreting and non-secreting populations were finally resuspended in appropriate volumes of culture media for further culturing with target cells.
Flow cytometry
Cells from unpurified (ORI), IFNγ-secreting (POS) and non-secreting (NEG) fractions obtained from the above experiment were finally washed as described above, and were then re-suspended in 500 ul of PBS buffer for flow cytometry analyses. To allow for multiple analyses, cells in all fractions were co-stained with anti-CD3-FITC andante- CD8-PerCP antibodies to allow multiple gating and analyses of pan T cells and CD8+ cytotoxic T lymphocytes, in addition to the IFNγ-PE that is conjugated onto CD45+ WBCs. Flow cytometry analyses were performed according to pre-set parameters specifically designed for this assay.
Co-culture of IFNγ-secreting and non-secreting cells with MCF7 cells
Unpurified, IFNγ-secreting, and non-IFNγ-secreting PBMCs from all of the above initial culture conditions were separately co-cultured alone, or with fresh populations of MCF7 cells, in the presence or absence of IL-2. As additional controls, we used HeLa cells as another target cell type, and fresh PBMCs were also co-cultured with MCF7 cells. Cells from these different mixtures were cultured for 3 days under the same culture conditions above, at 5:1 (E:T) ratio.
Apoptotic assays
To evaluate the effects of unpurified, IFNγ-secreting , or IFNγ-non secreting cells from the different cultures above on killing target MCF7 cells in vitro, cells from the above co-cultures were either incubated with 1 ug/ml Hoechst 33342 (Sigma) for 10 min and evaluated for chromatin condensation in situ using fluorescence microscopy (Nikon, Japan), stained with Trypan Blue and evaluated for cell viability, or washed to remove PBMCs and incubated the remaining adherent MCF7 cells with Annexin V-FITC (BD Biosciences, San Jose, CA, USA) and evaluated for apoptosis using flow cytometry using BD FACS Calibur (BD Biosciences).
Results
Peripheral blood mononuclear cells (PBMCs) were collected from 32 volunteers. On average, 13.1 ml of blood were collected from each volunteer. The average PBMC yield was 54.2 × 10⁶ PBMCs, which contained 5.8% granulocytes and 0.054 × 10⁶ RBCs/ml. These PBMCs were utilized in subsequent cultures, either alone or together with MCF7 breast cancer cells, with or without interleukin-2 (IL-2) as a T cell stimulating agent.
In vitro co-cultures of MCF7 cells with PBMCs for five days showed differential cellular behaviors, depending on the specific culture condition (Figure 1). MCF7 cells cultured alone formed a single layer of adherent cells (Figure 1B and E). In contrast, PBMCs cultured alone were in suspension (Figure 1-A and D). When PBMCs were co-cultured with MCF7 cells, no change in morphological behavior was noticed (Figure 1-C). Addition of IL-2 to MCF7 cells did not induce any morphological modification (Figure 1-E). In contrast, addition of IL-2 to PBMCs did induce the formation of small and numerous cellular aggregates (Figure 1-D). Interestingly, co-culture of MCF7 cells with PBMCs with the addition of IL-2 caused the formation of larger but less abundant cellular aggregates (Figure 1-F).
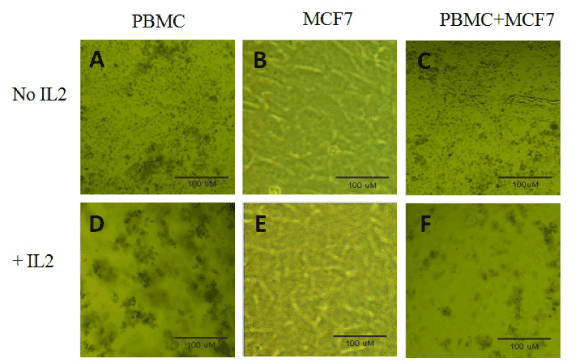
Figure 1. Initial cultures and co-cultures of MCF7 breast caner cells with PBMCs. PBMCS, MCF7 cells were cultured alone or co-cultured together, with or without IL-2, as described in materials and methods. The cell culture dishes were incubated at 37°C with 5% CO2 for 5 days. The above pictures were taken on day 5. Shown in the pictures are cellular aggregates that were most evident in the co-culture of PBMC+MCF7 with IL-2 that indicate T cell activation.
Cells and supernatants of the above cultures were collected on day 5. Supernatants were used to assess the collective profiles of secreted cytokines (Figure 2-A). This was achieved by the utilization of the Cytometric Bead Array (CBA) from which the results are shown in Figure 2. Of interest to this study was the secretion of Interferon Gamma (IFNg). Our results showed that when PBMCs were cultured alone, 817 pg/ml IFNg were secreted into the media (Figure 2-B). Expectedly, with the addition of IL-2 the levels of secreted IFNg were elevated to much higher levels (27322 pg/ml). Interestingly, the levels of secreted IFNg decreased to almost undetectable levels (9 pg/ml) in PBMC+MCF7 co-cultures. When IL-2 was added to PBMC+MCF7, the levels of secreted IFNg increased to 3394 pg/ml (Figure 2-B).
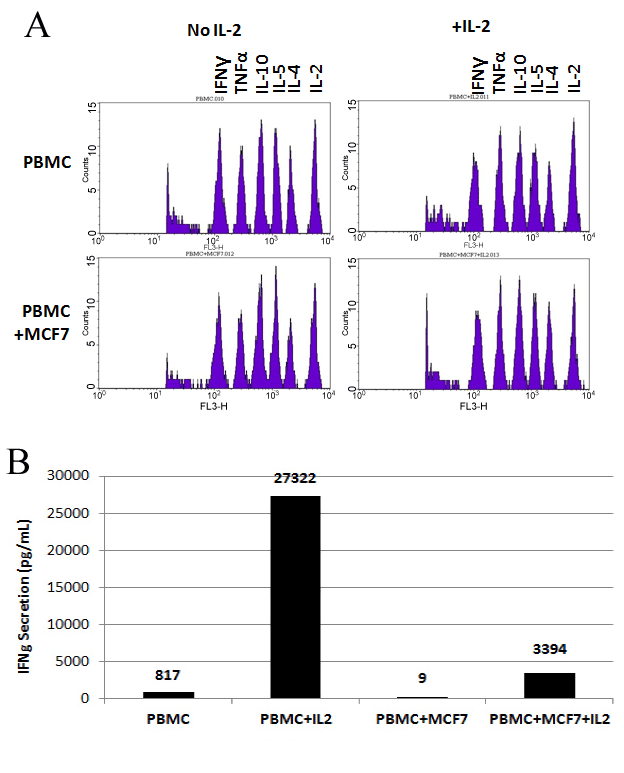
Figure 2. Profiles of Secreted Cytokines: Results of Cytometric Bead Array (CBA). PBMCS, MCF7 cells were cultured alone or co-cultured together as described in materials and methods. The cell culture dishes were incubated at 37°C with 5% CO2 for 5 days. Supernatant were collected on day 5 and were used in CBA assay as described in materials and methods. Figure (A) show peaks related to concentrations of IFNg, TNFa, IL-10, IL-5, IL-4, and IL-2 cytokines indicated on top of the Figures. Bars in Figure (B) indicate the exact concentration of each cytokine in each sample .
Cells from the above cultures were also collected on day 5 to analyze the cells that secrete IFNg using the Cytokine Secretion Assay (CSA) (Figure 3). As shown in Figure 3-A, our results demonstrated that 0.11% of CD45+/CD3+ T cells secreted IFNg in cultures containing PBMCs alone. Upon addition of IL-2, the percentage of IFNg-secreting cells increased to 1.54 % (Figure 3-A). No MCF7 cells were shown to secrete IFNg, with or without IL-2. Interestingly, there was a clear inhibition of IFNg secretion in PBMC+MCF7 co-cultures down to 0.01% (Figure 3-A). However, this inhibition was completely reversed to much higher levels (0.51%) when IL-2 was added to PBMC+MCF7 culture (Figure 3-A). These IFNg-secreting cells from PBMC+MCF7 cultures were then purified using the enrichment part of the CSA (Figure 3-B). Our results show clear populations of CD45+/CD3+ T lymphocytes that secrete IFNg in the purified cellular fractions (Figure 3-B). Purification of IFNg-secreting cells from PBMC+MCF7+IL-2 cultures (1.54% IFNg-secreting cells) using MACS® magnetic columns yielded 92.85% pure secreting cells (Figure-3B). The IFNg-secreting T lymphocytes were both CD8+ and CD8-. These cells were further used in subsequent co-cultures with fresh populations of MCF7 or HeLa cells (Figure 4).
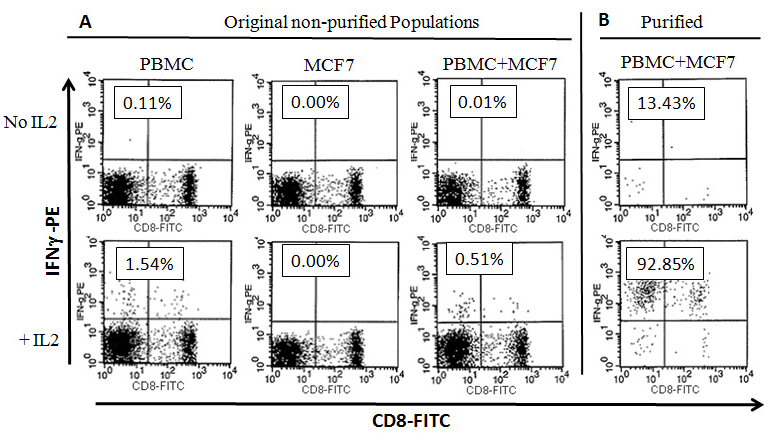
Figure 3. Profiles of Interferon-gamma (IFN-g) Secreting Cells: PBMCS, MCF7 cells were cultured alone or co-cultured together as described in materials and methods for 5 days in the presence or absence of IL-2. Cells were collected on day 5 and were used in the Cytokine Secretion Assay (CSA) as described in materials and methods. The above dot plots were gated on CD3+ T cells (CD3-PerCP). (A) Flow cytometry dot plots showing percentages of CD3+ T cells that secrete IFNg. (B) shows percentages of CD45+/IFN-g secreting cells after magnetic purification using Anti PE-MACS Microbeads. These cells were used in downstream cultures with fresh MCF7 cells. Numbers in boxes indicate percentages of CD45+/IFNg secreting cells from total CD3+ cells within each sample.
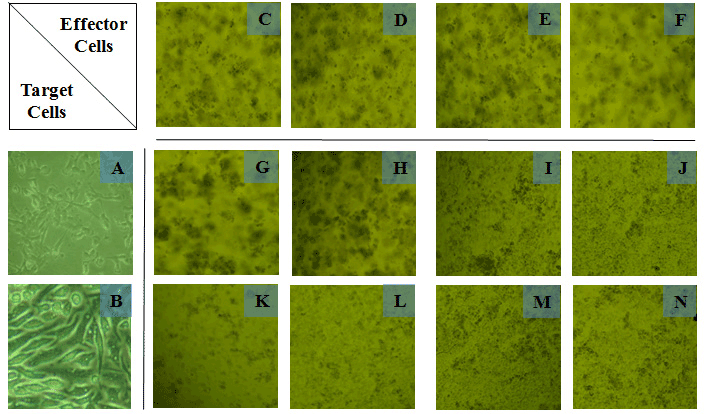
Figure 4. Cultures and co-cultures of MCF7 or HeLa target cells with IFNg secreting or non-secreting, MCF7-specific, or IL-2-responding PBMCs. MCF7 or HeLa target cells were each cultured alone, or co-cultured separately for 2 days with different PBMC populations (effector cells) as described in materials and methods. PBMC populations were either IFNg secreting or IFNg non-secreting, that were either MCF7-specific, or IL-2 responding PBMCs. The above pictures were taken on day 2 (after 48 hours). Shown in the pictures are cellular aggregates that were most evident in the co-culture of MCF7 cells with IFNg-secreting PBMCs. Cells from these samples were analyzed for apoptosis in MCF7 and HeLa target cells (CD45-). Legend: A: MCF7 cells, B: HeLa cells, C: MCF7-specific IFNg secreting PBMCs, D: MCF7-specific IFNg non-secreting PBMCs, E: IL2-responding IFNg secreting PBMCs, F: IL2-responding IFNg non-secreting PBMCs, G: combined cultures of cells from A and C, H: combined cultures of cells from A and D, I: combined cultures of cells from A and E, J: combined cultures of cells from A and F, K: combined cultures of cells from B and C, L: combined cultures of cells from B and D, M: combined cultures of cells from B and E, N: combined cultures of cells from B and F.
The effects of unpurified PBMCs and Purified IFNg secreting and IFNg non-secreting T cells from the above cultures were separately co-cultured either with a fresh batch of MCF7 cells or with HeLa cells. As shown in Figure 4, cellular morphologies in these cultures differed from the initial cultures shown in Figure 1. There were larger, more evident and obvious cellular aggregates in MCF7+ IFNg secreting PBMC cultures (Figure 4-G) compared with MCF7+ IFNg secreting PBMCs from the initial cultures (Figure 1-F). Purified IFNg-secreting and IFNg non-secreting T cells from PBMC+IL2 cultures were used as MCF7 non-specific effector cells, whereas HeLa cells were used to assess specificity of MCF7-stimulated, IFNg secreting PBMCs.
We then analyzed the effects of IFNg secreting and non secreting cells on inducing apoptosis on MCF7 target cells. Apoptosis of MCF7 target cells was assessed and confirmed by using different methods. PBMCs were first removed, and the adherent MCF7 cells were washed and then evaluated. We first assessed cell membrane permeability using Trypan Blue stain (Figure 5). Our results showed that in the MCF7 alone cell culture, 7% of MCF7 cells were positive for Trypan Blue. When MCF7 cells were co-cultured with the unpurified PBMCs from the previous cultures, 17% of MCF7 cells were positive for Trypan Blue, compared with 9% in MCF7+ fresh PBMC co-cultures. Interestingly, in MCF7+ IFNg secreting PBMC co-cultures, 64% of MCF7 cells were positive for Trypan Blue, compared with only 13% in MCF7+ IFNg non secreting PBMCs. Additionally, 16% of HeLa cells stained positive when they were co-cultured with IFNg-secreting PBMC, compared with 3% when HeLa cells were co-cultured with IFNg non-secreting PBMC (Figure-5).
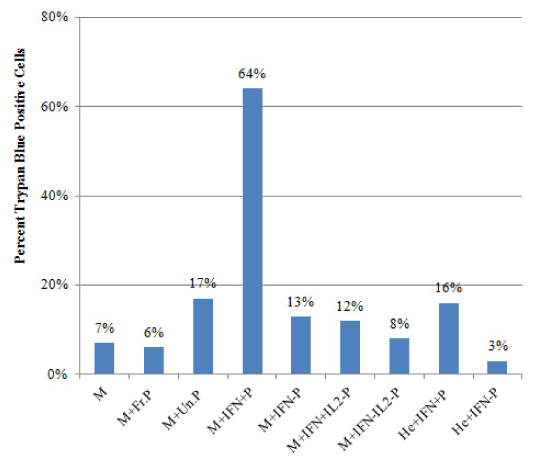
Figure 5. MCF7 Cell Death in Response to Co-Culture With Different Populations of PBMCs, Assessed by Trypan Blue Staining. MCF7 or HeLa target cells were each cultured alone, or co-cultured separately for 3 days with different PBMC populations (effector cells) as described in materials and methods. PBMC populations were either IFNg secreting or IFNg non-secreting, that were either MCF7-specific, or MCF7 non-specific, IL-2 responding PBMCs. PBMCs were removed and the remaining adherent MCF7 cells were washed and then collected and stained with Trypan Blue. Each bar represents the number of Trypan Blue stained cells in each culture condition described. At least 200 cells were counted in each sample. Legend: M, MCF7 cells alone; M+Fr.P, MCF7 cells co-cultured with fresh batch of PBMCs; M+Un.P, MCF7 cells co-cultured with unpurified PBMCs from MCF7+PBMC+IL2 cultures; M+IFN+P, MCF7 cells co-cultured with purified IFNg secreting PBMCs from MCF7+PBMC+IL2 cultures; M+IFN-P, MCF7 cells co-cultured with purified IFNg non-secreting PBMCs from MCF7+PBMC+IL2 cultures; M+IFN+IL-P, MCF7 cells co-cultured with IFNg secreting PBMCs from PBMC+IL2 cultures; M+IFN-IL-P, MCF7 cells co-cultured with IFNg non-secreting PBMCs from PBMC+IL2 cultures; He+IFN+P, HeLa cells co-cultured with IFNg secreting PBMCs from MCF7+PBMC+IL2 cultures; He+IFN-P, HeLa cells co-cultured with IFNg non-secreting PBMCs from MCF7+PBMC+IL2 cultures.
We then analyzed chromatin condensation in MCF7 cells using Hoechst Stain to determine percentages of cells undergoing apoptosis (Figure 6). Our results showed that in the MCF7 cells alone cultures, 4% of MCF7 cells had condensed chromatin (Figure 6-A). In MCF7+unpurified PBMCs, 14% of MCF7 cells were seen with condensed chromatin (Figure 6-D) compared with only 4% in MCF7+fresh PBMC cultures (Figure 6-G). Interestingly, in MCF7+ IFNg secreting PBMC cultures, 58% of MCF7 cells had condensed chromatins (Figure 6-E), compared with only 10% in MCF7+non secreting PBMC cultures (Figure 6-F). As a control, we used HeLa cells as target cells for killing by PBMCs. Expectedly, 12% of HeLa cells had condensed chromatin when they were co-cultured with IFNg-secreting PBMCs from MCF7+PBMC+IL2 culture (Figure 6-H), compared with 3% when HeLa cells were co-cultured with IFNg non-secreting PBMCs from MCF7+PBMC+IL2 culture (Figure 6-I).
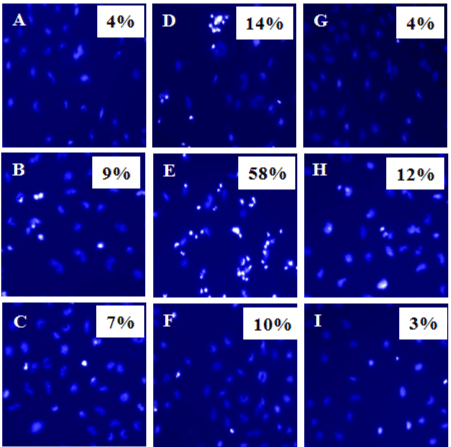
Figure 6. Chromatin condensation in MCF7 cells in response to co-culture with different populations of PBMCs. MCF7 or HeLa target cells were each cultured alone, or co-cultured separately for 2 days with different PBMC populations (effector cells) as described in materials and methods. PBMC populations were either IFNg secreting or IFNg non-secreting, that were either MCF7-specific, or MCF7 non-specific, IL-2 responding PBMCs. PBMCs were removed and the remaining adherent MCF7 cells were analyzed for chromatin condensation using Hoechst staining to determine apoptotic cells. Shown percentages indicate numbers of cells with condensed chromatin (bright cells). At least total 200 cells were counted in each sample. A, MCF7 alone; B, MCF7 cells + IFNg secreting PBMCs from PBMC+IL2 cultures; C, MCF7 cells + IFNg non-secreting PBMCs from PBMC+IL2 culture; D, MCF7 cells + Unpurified PBMCs from MCF7+PBMC+IL2 culture; E, MCF7 cells + IFNg secreting PBMCs from MCF7+PBMC+IL2 culture; F, MCF7 cells + IFNg non-secreting PBMCs from MCF7+PBMC+IL2 culture; G, MCF7 cells + fresh batch of PBMCs; H, HeLa cells + IFNg secreting PBMCs from MCF7+PBMC+IL2 culture; I, HeLa cells + IFNg non-secreting PBMCs from MCF7+PBMC+IL2 culture.
Finally, we analyzed the effects of different PBMC populations on inducing apoptosis in MCF7 target cells using Annexin V that binds specifically to apoptotic cells (Figure 7). Consistent with previous results, our data show that in MCF7 cells alone culture, 2.1% of MCF7 underwent apoptosis (Figure 7-A), compared with 8.9% and 6.4% in MCF7+ IFNg secreting PBMCs from PBMC+IL2 cultures and MCF7+ IFNg non-secreting PBMCs from PBMC+IL2 cultures (Figure 7-B and 7-C), respectively. Comparatively, in MCF7+unpurified PBMC cultures, 13.9% of MCF7 cells were apoptotic (Figure 7-D), compared with 2.7% in MCF7+ fresh PBMC cultures (Figure 6-G). Interestingly, and consistent with the above results, 51.4% of MCF7 cells were apoptotic in MCF7+ IFNg secreting cell cultures (7-E), compared with only 7.4% in MCF7+ IFNg non secreting cells (Figure 7-F). When HeLa cells were used, 1.3% of HeLa cells were apoptotic in HeLa+ IFNg secreting cells cultures (Figure 7-H), compared with 0.5 % in HeLa+ IFNg non secreting cell culture (Figure 7-I).
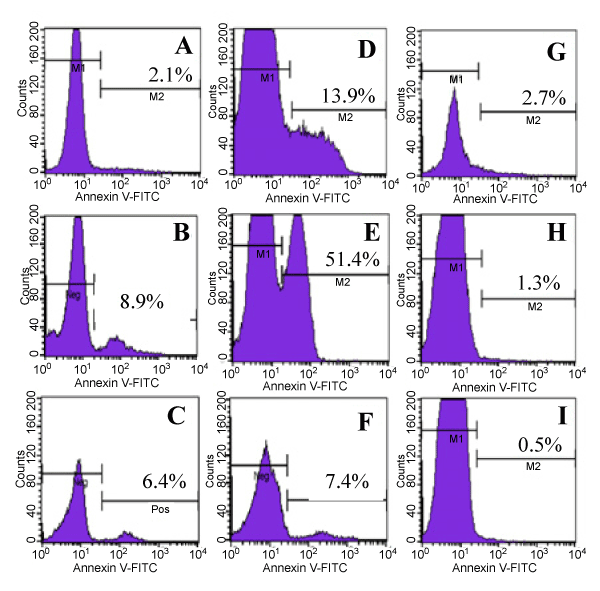
Figure 7. Apoptosis of MCF7 Cells Evaluated by Annexin V Assay. Effects of effector PBMCs to induce apoptosis in MCF7 cells were analyzed using the binding of Annexin V antibody to Phosphatidylserine (PS) on the surface of apoptotic MCF7 cells. MCF7 cells were cultured alone, or with other cell populations as indicated for 3 days. PBMCs were removed and the remaining adherent MCF7 cells were analyzed for binding of Annexin V to PS to determine apoptotic cells. Propidium Iodide (PI) was used to exclude necrotic cells. The above histograms were gated on PI negative populations. Histograms show Annexin V negative populations (live cells, left peaks) and Annexin V positive cells (apoptotic cells, right peaks). Numbers indicate percentages of Annexin V positive cells within the gated cell populations. A, MCF7 alone; B, MCF7 cells + IFNg secreting PBMCs from PBMC+IL2 cultures; C, MCF7 cells + IFNg non-secreting PBMCs from PBMC+IL2 culture; D, MCF7 cells + Unpurified PBMCs from MCF7+PBMC+IL2 culture; E, MCF7 cells + IFNg secreting PBMCs from MCF7+PBMC+IL2 culture; F, MCF7 cells + IFNg non-secreting PBMCs from MCF7+PBMC+IL2 culture; G, MCF7 cells + fresh batch of PBMCs; H, HeLa cells + IFNg secreting PBMCs from MCF7+PBMC+IL2 culture; I, HeLa cells + IFNg non-secreting PBMCs from MCF7+PBMC+IL2 culture.
2021 Copyright OAT. All rights reserv
Discussion
In this study, we aimed at inducing antigen-specific T cell responses against MCF7 breast cancer cells in vitro. Our results demonstrate that MCF7 cells inhibited type I immune response by down-regulating IFNg-secretion by T lymphocytes. In contrast, IL-2 reversed MCF7-mediated inhibition of T cell activation, and led to up-regulation of cell mediated immune response manifested by significant increase in the number of IFNg secreting CD3+ T cells in response to MCF7 cells. Interestingly, our data show that purified, viable, MCF7-stimulated, IFNg-secreting, effector T cells induced magnified apoptotic effects on a fresh batch of MCF7 cells, and these effects were MCF7-specific and did not affect another cancer cell type.
In this study, we utilized peripheral blood mononuclear cells (PBMCs) from healthy individuals as effector immune cells. As target cells, we utilized MCF7 breast cancer cells. The quality of PBMC collections was assessed to determine the percentages of contaminating granulocytes and red blood cells (RBCs). On average, PBMC collections contained 87% mononuclear cells, with less than 9% granulocytes, and insignificant numbers of RBCs. The percentages of CD3+ T cells, CD19+ B cells, and CD14+ monocytes within the PBMC populations were 48%, 27% and 13%, respectively.
Initially, PBMCs were cultured alone, or co-cultured with MCF7 cells for 5 days in the presence or absence of IL-2 as a T cell stimulating agent. Co-culturing was for 5 day to allow for uptake of MCF7 antigens by antigen-presenting cells (APCs) within the PBMC population, antigen processing by APCs, antigen presentation to T cells, T cell activation, differentiation into effector cells, and secretion of IFNg.
The effects of PBMCs and MCF7 cells on each other were then analyzed by different methods. We first observed the behaviors of co-cultured cell populations in vitro (Figure 1). These observations provided an initial evaluation of the interaction between PMBCs and MCF7 cells, and provided hints regarding PBMC behaviors, since MCF7 cells grow as adherent cells while PBMCs are in suspension. PBMC cellular aggregates were observed in specific culture conditions compared with other cultures, which presented a first indication on the activation status of PBMC population (Figure 1). Our data showed minimal PBMC aggregates in PBMC alone cultures (Figure 1-A), typical of any PBMC cultures. No apparent additional aggregates were observed in PBMC+MCF7 cultures (Figure 1-C), which gave a first hint that MCF7 cells did not cause noticeable activation of PBMCs. Expectedly, PBMC+IL-2 cultures displayed large and numerous cellular aggregates (Figure 1-D), indicating the logical response of T cell activation upon addition of IL-2. Interestingly, there were less PBMC aggregates with smaller sizes in PBMC+MCF7+IL-2 cultures (Figure 1-F) compared with PBMC+IL-2 culture, suggesting that MCF7 cells may have an inhibitory effect on forming cellular aggregates within the PBMC population.
We then evaluated the effects of MCF7 on cytokine secretion by PBMCs. We measured both the levels of secreted cytokines in culture supernatants, and percentages of IFNg-secreting PBMCs in each culture condition. To determine the levels of secreted cytokines, we utilized the Th1/Th2 Cytometric Bead Array (CBA) (BD Biosciences), which enabled the measurement of secreted cytokines in culture media, including IL-2, IL-4, IL-5, IL-10, TNFα, and IFNg (Figure 2-A and -B). Of interest to this study was IFNg as a major cytokine employed in type I immune response. IFNg is secreted by activated CD4+ Th1 cells and CD8+ cytotoxic T cells. Our data indicate that PBMCs secreted 817 pg/ml when cultured alone (Figure 2-B). When IL-2 was added to PBMC cultures, it led to a massive increase of IFNg secretion up to 27,322 pg/ml. Interestingly, when MCF7 cells were co-cultured with PBMCs, they almost completely blocked IFNg secretion by PBMCs (9 pg/ml). These results show that anti-immune activities of MCF7 cancer cells may include blocking secretion of inflammatory molecules such as IFNg as an immune evasion mechanism. In contrast, when IL-2 was added to PBMC+MCF7 cultures, it completely reversed the MCF7 inhibition of IFNg secretion by PBMCs (3394 pg/ml) (Figure 2-B). An interesting observation is that MCF7 cells effectively suppressed the IL-2 mediated up-regulation of IFNg secretion by PBMCs, from 27,322 pg/ml down to 3394 pg/ml.
To identify specific populations of effector T cells, we utilized the Cytokine Secretion Assay (CSA) to detect and physically isolate specific populations of cells within PBMCs that secreted IFNg in response to MCF7 cells, IL-2 or a combination of both. The CSA assay utilizes a bi-specific monoclonal antibody reagent (catch reagent) that is made up of anti-CD45 and anti- IFNg antibodies conjugated at the Fc regions. On one side, this catch reagent binds to all CD45+ WBCs (regardless of activation or IFNg secretion), while the anti-IFNg antibody binds to the secreted IFNg molecule. Since MCF7 cells do not express CD45, only PBMCs will be included and analyzed for IFNg secretion by the SCA. The assay is optimized to prevent cross capture that may result from the binding of the catch reagent bound on the surface of one cell to IFNg secreted by other neighboring cells in the sample. Only IFNg-secreting, CD45+ PBMCs will have IFNg bound on their surface. A second anti- IFNg antibody is then utilized that is conjugated to phycoerythrin (PE) and that recognizes another epitope on IFNg molecule to allow for detection of CD45+/IFNg-secreting cells by flow cytometry.
Expectedly, our CSA results show that IFNg was secreted by CD3+ T cells at varying levels according to specific culture conditions. This specific identification was made possible by performing a specific flow cytometric gating strategy that included drawing a physical gate on lymphocytes based on forward and side scatter properties, gating on CD3+ T cells, and then using plots of anti-CD8+ antibodies vs. IFNg to differentiate between CD8+ and CD8- (CD4+) secreting and non-secreting cells within the CD3+ T cells gate. This way, we could analyze percentages of CD8+ and CD4+ T cells within a specific population of PBMCs that secreted IFNg. Since anti- IFNγ-PE binds only to cells with CD45 expression, no further CD45 antibodies are required. Our data show that 0.11% of CD3+ T cells secreted IFNg in PBMC alone cultures, which represented the background IFNg secretion (Figure 3-A). IL-2 effectively and significantly enhanced T cell activation and led to a 15-fold increase in the number of IFNg secreting cells up to 1.54% of all CD3+ T cells PBMC+IL-2 cultures. Interestingly, MCF7 cells effectively inhibited IFNg secretion by 90% of T cells (0.01% in PBMC+MCF7 cultures compared with 0.11% in PBMC alone culture).
The MCF7-mediated inhibition of IFNg secretion by T cells was reversed by adding IL-2 to PBMC+MCF7 cultures. However, the inhibitory effect of MCF7 cells on IFNg secretion was effective in reducing the number of IFNg-secreting cells from 1.54% in PBMC+IL-2 cultures down to 0.51% in PBMC+MCF7+IL-2 cultures. In PBMC+IL-2 cultures, the IL-2-mediated increase of IFNg secretion is a non-antigen-specific response, since the levels of IFNg secretion were seen in PBMC cultures without the presence of MCF7 cells. However, in PBMC+MCF7+IL-2 cultures, the increase of IFNg secretion is, at least in part, MCF7-specific, since the activation was in the presence of MCF7 cells.
To test whether the IFNg-secreting T cells seen in PBMC+MCF7+IL-2 cultures were MCF7-antigen-specific T cells, or they were just IL-2-responding, MCF7 antigen independent T cells, we designed the next set of experiments. We aimed at testing the antigen specificity of these IFNg-secreting T cell by physically isolating the IFNg-secreting T cells that were raised in PBMC+MCF7+IL-2 cultures to test their ability to induce apoptosis in target MCF7 cells compared with other cell types. We magnetically labeled PE-positive, IFNg-secreting cells in the CSA by using anti-PE MACS® Microbeads. Cells were then passed through MACS® magnetic column; IFNg-secreting cells were bound onto the column, whereas IFNg-non-secreting cells passed through. The column was then removed from the magnet and IFNg-secreting cells were then collected. We used two magnetic columns for each sample to increase purity of IFNg-secreting cells. Our results showed that we obtained a highly pure (92.85%) population of IFNg-secreting CD3+ T cells that were derived from PBMC+MCF7+IL-2 cultures (Figure 3-B). These IFNg-secreting cells represent a unique population of viable cells that share a common effector mechanism, which is IFNg secretion.
We then tested the ability of both purified populations (IFNg-secreting and IFNg-non-secreting cells) from the above experiment to induce apoptosis by co-culturing them with a fresh batch of MCF7 cells, in addition to other experimental settings as described below. Since it is well known that IL-2 is required for activation but not for killing [31] we did not add IL-2 for these final co-cultures. The co-cultures were for 3 days only, to allow for induction of apoptosis in an antigen-specific manner and not to allow for raising new and complete effector responses by PBMCs.
The specific killing of MCF7 target cells by different populations of PBMCs was analyzed by three different methods: uptake of Trypan Blue by apoptotic and necrotic cells (Figure 5), and chromatin condensation by Hoechst stain (Figure 6) and flow cytometric analysis of Phosphatidylserine expression by Annexin V stain (Figure 7), to specifically analyze apoptotic cells. Together, these three methods allowed the quantitative measurement of cells undergoing apoptosis in the above different culture settings.
Using Trypan blue exclusion, our data showed 7% and 9% death in MCF7 only and MCF7+fresh PBMC cultures, respectively, which represented background death in these types of 5-day old cultures. Co-culturing of MCF7 cells with unpurified (IFNg-secreting cells not removed) PBMCs taken from previous PBMC+MCF7+IL-2 cultures, led to 17% killing of MCF7 cells. The increase in MCF7 cell apoptosis was mainly due to the presence of effector cell populations (IFNg-secreting and probably other effector cell types). Interestingly, co-culturing of MCF7 cells with purified IFNg-secreting PBMCs taken from PBMC+MCF7+IL-2 cultures led to 64% killing of MCF7 cells. In contrast, co-culturing of MCF7 cells with IFNg-non secreting cells from the same PBMC+MCF7+IL-2 cultures led to 13% killing of MCF7 cells. This clear difference between IFNg-secreting and non-secreting PBMCs provides a direct association between IFNg secretion as an effector mechanism of PBMCs and apoptosis of target cells. Additionally, co-culturing of MCF7 cells with either IFNg-secreting or IFNg-non secreting PBMCs from previous PBMC+IL-2 cultures (no exposure to MCF7), led to 12% and 8%, respectively. This showed that IL-2-mediated activation of PBMCs (in the absence of MCF7 target cells) is not sufficient to mount a significant increase in target cell apoptosis. More interestingly, to test whether the above response of IFNg-secreting PBMCs is MCF7-specific or not, we co-cultured IFNg-secreting cells with another cancer cell line, HeLa cells. Our results showed that co-culturing of HeLa cells with MCF7-stimulated, IFNg-secreting and IFNg-non secreting PBMCs from previous PBMC+MCF7+IL-2 cultures led to 16% and 3% respectively, indicating that the significant increase of killing by MCF7-stimulated PBMCs was MCF7-specific and did not cause the same response on other types of target cells.
We then assessed the ability of MCF7-stimulated, IFNg-secreting, PBMCs to induce apoptosis in target MCF7 cells by evaluating chromatin condensation. Our analyses demonstrated that there was a marked increase in MCF7 target cell apoptosis by MCF7-stimulated, IFNg-secreting, CD45+ PBMCs, consistent with the above results from Trypan Blue exclusion. The maximum apoptosis (58%) was seen in MCF7 cells co-cultured with MCF7-stimulated, IFNg-secreting, CD45+, PBMCs compared with all the other experimental variables described above. This clearly shows that MCF7-stimulated, IFNg-secreting, CD45+, PBMCs induced MCF7-specific apoptosis that was a result of previous exposure of MCF7 target cells to effector cells within the PBMC population.
Furthermore, to provide an additional method for assessment of apoptosis in MCF7 target cells, we measured apoptosis by flow cytometry using Annexin V, a phospholipid-binding protein that recognizes phosphatidylserine on the surface of apoptotic cells. To differentiate between apoptotic and necrotic cells, we used plots of FITC-conjugated Annexin V versus Propidium Iodide. Cells that were included in the assessment were Annexin V-FITC-positive and PI-negative.
Consistent with the above results of cell membrane permeability using Trypan Blue, and chromatin condensation using Hoechst stain, our results with Annexin V showed once again that MCF7-stimulated, IFNg-secreting, CD45+, PBMCs induced maximum apoptosis (51% Annexin V-positive) MCF7 cells in an MCF7-specific manner that was not seen in other experimental settings.
Together, the above data related to the induction of apoptosis in MCF7 target cells by the different PBMC populations through assessment of target MCF7 cell killing by cell membrane permeability, and analyses of specific apoptotic assays by chromatin condensation and phosphatidylserine depolarization, suggested a significant increase in MCF7 target cell apoptosis, specifically induced by MCF7-stimulated, IFNg-secreting, CD45+, PBMCs. Our results showed minimal killing of target MCF7 cells by fresh batch of PBMCs. Fresh PBMCs will not kill MCF7 cells because as we showed in the previous set of experiments they are down regulated by MCF7 cells, and now we are not adding IL-2. Additionally, the killing effects of MCF7 cells exhibited by PBMCs from PBMC+IL-2 cultures represents a generic response by IL-2 activated PBMCs that is not MCF7-specific response, and indicates that previous activation of PBMC with IL-2, in the absence of MCF7 cells, does not necessarily lead to a significant increase of apoptosis in subsequent MCF7 target cells.
Importantly, the significant increase of MCF7 apoptosis by IFNg-secreting PBMCs, compared with any other population of effector cells in our experimental setup directly correlates killing of MCF7 target cells with IFNg-secretion. On the other hand, induction of MCF7 apoptosis by IFNg-non secreting PBMCs was much lower than that seen with IFNg-secreting cells, but is more than half that number of killing of MCF7 target cells by unpurified PBMCs; this indicates the presence of effector cells that are able to induce apoptosis in MCF7 cells other than IFNg-secreting cells. The identification and characterization of other effector cell type(s) is currently under investigation at our laboratory.
When MCF7 cells were co-cultured with IFNg non secreting cells, the percentage of apoptotic MCF7 cells was more than half that was in MCF7+ unpurified PBMCs, indicating that there is another mechanism of inducing apoptosis in MCF7 cells, independent of IFNg secretion. This could either be due to the presence of another population of effector cells in the IFNg non secreting cells or that the apoptotic MCF7 cells were destined to die before the purification took place due to an indirect killing effect. However, the first hypothesis is more logical since we changed the media in the new cultures, and that there are multiple mechanisms of immune response against cancer cells, including the utilization of anti-tumor cytokines. Further studies are still required to examine this phenomenon. The identification and characterization of other effector cell type(s) is currently under investigation at our laboratory.
The objective of this study was to test whether we can raise cancer cell-specific effector T-cells that can induce apoptosis in target cells in an exclusive manner. We aimed at isolating MCF7-stimulated, IFNg-secreting T cells, and determine the specificity of their apoptotic activity against target cells. We focused on IFNg secretion as an effector mechanism of the cellular immune response against MCF7 target cells.
Finally, in this report we present a unique method for the physical isolation of pure, viable, IFNg-secreting, effector CD3+ T lymphocytes that were able to induce apoptosis in cancer cells in a cell-specific manner. This unique approach opens the possibilities for developing personalized cancer vaccines by the utilization of autologous, effector, cancer cell-specific, T cells that may specifically target cancer cells in vivo without affecting healthy tissues.
References
- Khang D, Rim HD, Woo J (2013) The korean version of the body image scale-reliability and validity in a sample of breast cancer patients. Psychiatry Investig 10: 26-33. [Crossref]
- Ginsburg OM, Love RR (2011) Breast cancer: a neglected disease for the majority of affected women worldwide. Breast J 17: 289-95. [Crossref]
- 3.Grizzi F, Bianchi P, Malesci A, Laghi L (2013) Prognostic value of innate and adaptive immunity in colorectal cancer. World J Gastroenterol : WJG 19: 174-84. [Crossref]
- Chow MT, Moller A, Smyth MJ (2012) Inflammation and immune surveillance in cancer. Semin Cancer Biol 22: 23-32. [Crossref]
- Deepak P, Acharya A (2010) Anti-tumor immunity and mechanism of immunosuppression mediated by tumor cells: role of tumor-derived soluble factors and cytokines. Int Rev Immunol 29: 421-58. [Crossref]
- DeNardo DG, Coussens LM (2007) Inflammation and breast cancer. Balancing immune response: crosstalk between adaptive and innate immune cells during breast cancer progression. Breast Cancer Res 9: 212. [Crossref]
- Oble DA, Loewe R, Yu P, Mihm MC, Jr (2009) Focus on TILs: prognostic significance of tumor infiltrating lymphocytes in human melanoma. Cancer Immun 9: 3. [Crossref]
- Seruga B, Zhang H, Bernstein LJ, Tannock IF (2008) Cytokines and their relationship to the symptoms and outcome of cancer. Nat Rev Cancer 8: 887-99. [Crossref]
- Ben-Baruch A (2003) Host microenvironment in breast cancer development: inflammatory cells, cytokines and chemokines in breast cancer progression: reciprocal tumor-microenvironment interactions. Breast Cancer Res 5: 31-6.[Crossref]
- Curiel TJ (2007) Tregs and rethinking cancer immunotherapy. J Clin Invest 117:1167-74.[Crossref]
- Antony PA, Restifo NP (2005) CD4+CD25+ T regulatory cells, immunotherapy of cancer, and interleukin-2. J Immunother 28:120-8. [Crossref]
- Terme M, Colussi O, Marcheteau E, Tanchot C, Tartour E, et al. (2012) Modulation of immunity by antiangiogenic molecules in cancer. Clin Dev Immunol: 492920. [Crossref]
- Johnson B, Osada T, Clay T, Lyerly H, Morse M (2009) Physiology and therapeutics of vascular endothelial growth factor in tumor immunosuppression. Curr Mol Med 9:702-7. [Crossref]
- Banerjee S, Halder K, Bose A, Bhattacharya P, Gupta G, et al. (2011) TLR signaling-mediated differential histone modification at IL-10 and IL-12 promoter region leads to functional impairments in tumor-associated macrophages. Carcinogenesis 32: 1789-97. [Crossref]
- Perez N, Karumuthil-Melethil S, Li R, Prabhakar BS, Holterman MJ, et al. (2008) Preferential costimulation by CD80 results in IL-10-dependent TGF-beta1(+) -adaptive regulatory T cell generation. J Immunol 180: 6566-76.
- Kim R, Emi M, Tanabe K (2006) Cancer immunosuppression and autoimmune disease: beyond immunosuppressive networks for tumour immunity. Immunology 119: 254-64.
- Jiang J, Wu C, Lu B (2013) Cytokine-induced killer cells promote antitumor immunity. J Transl Med 11: 83. [Crossref]
- Brown MD, van der Most R, Vivian JB, Lake RA, Larma I, et al. (2012) Loss of antigen cross-presentation after complete tumor resection is associated with the generation of protective tumor-specific CD8(+) T-cell immunity. Oncoimmunology 1: 1084-94. [Crossref]
- Baleeiro RB, Wiesmuller KH, Dahne L, Lademann J, Barbuto JA, et al. (2013) Direct Activation of Human Dendritic Cells by Particle-Bound but Not Soluble MHC Class II Ligand. PloS one 8: e63039. [Crossref]
- Sugata K, Satou Y, Yasunaga J, Hara H, Ohshima K, et al. (2012) HTLV-1 bZIP factor impairs cell-mediated immunity by suppressing production of Th1 cytokines. Blood 119: 434-44.
- McNally A, Hill GR, Sparwasser T, Thomas R, Steptoe RJ (2011) CD4+CD25+ regulatory T cells control CD8+ T-cell effector differentiation by modulating IL-2 homeostasis. Proc Natl Acad Sci U S A 108: 7529-34. [Crossref]
- Watanabe MA, Oda JM, Amarante MK, Cesar Voltarelli J (2010) Regulatory T cells and breast cancer: implications for immunopathogenesis. Cancer Metastasis Rev 29: 569-79. [Crossref]
- Macchetti AH, Marana HR, Silva JS, de Andrade JM, Ribeiro-Silva A, et al. (2006) Tumor-infiltrating CD4+ T lymphocytes in early breast cancer reflect lymph node involvement. Clinics (Sao Paulo) 61: 203-8. [Crossref]
- Boyman O, Sprent J (2012) The role of interleukin-2 during homeostasis and activation of the immune system. Nat Rev Immunol 12: 180-90. [Crossref]
- Thavendiranathan P, Verhaert D, Kendra KL, Raman SV (2011) Fulminant myocarditis owing to high-dose interleukin-2 therapy for metastatic melanoma. Br J Radiol 84: e99-e102. [Crossref]
- Ellebaek E, Iversen TZ, Junker N, Donia M, Engell-Noerregaard L, et al. (2012) Adoptive cell therapy with autologous tumor infiltrating lymphocytes and low-dose Interleukin-2 in metastatic melanoma patients. Journal of Translational Medicine 10: 169.
- Jahn T, Zuther M, Friedrichs B, Heuser C, Guhlke S, et al. (2012) An IL12-IL2-antibody fusion protein targeting Hodgkin's lymphoma cells potentiates activation of NK and T cells for an anti-tumor attack. PloS one 7: e44482. [Crossref]
- Pham CD, Mitchell DA (2012) Chasing cancer with chimeric antigen receptor therapy. Immunotherapy 4: 365-7. [Crossref]
- Porter DL, Levine BL, Kalos M, Bagg A, June CH (2011) Chimeric antigen receptor-modified T cells in chronic lymphoid leukemia. N Engl J Med 365:725-33.
- Posel C, Moller K, Frohlich W, Schulz I, Boltze J, et al. (2012) Density gradient centrifugation compromises bone marrow mononuclear cell yield. PloS one 7: e50293.
- Iacobelli M, Rohwer F, Shanahan P, Quiroz JA, McGuire KL (1999) IL-2-mediated cell cycle progression and inhibition of apoptosis does not require NF-kappa B or activating protein-1 activation in primary human T cells. J Immunol 162: 3308-15. [Crossref]