Abstract
Argatroban and bivalirudin are two direct thrombin inhibitors (DTI) employed to treat heparin-induced thrombocytopenia (HIT). Following the withdrawal of lepirudin in 2012 we needed to establish in-house therapeutic ranges and dosing schedules for both DTI, since their practical handling was not clearly defined. Here we report our experience on HIT-patients treated with argatroban or bivalirudin between December 2012 and February 2014. We assessed anticoagulation by measuring aPTT, thrombin time (TT, final thrombin concentrations of 1.5 U/l for TT1.5 and 5.0 U/ml for TT5) and plasmatic DTI concentrations. In-house therapeutic target for argaroban was TT1.5 55–100 sec, corresponding to a 1.7–2 fold aPTT prolongation and plasmatic argatroban concentrations of 0.4–0.8 µg/ml. For bivalirudin, in-house target ranged between TT1.5 >110 sec and TT5 <40 sec, corresponding to a 2.5 fold aPTT prolongation and bivalirudin concentrations of about 1.0 µg/ml. We treated 10 HIT-patients (6 with thrombotic HIT, HIT-T) with argatroban, for a total of 159 days of treatment. Four HIT-patients (2 HIT-T) were treated with bivalirudin for a total of 53 days. Median treatment length was 15 days for both DTI. Clinical and laboratory course was favorable in all patients, with rapid normalization of the platelet count and a decrease of the strongly elevated D-dimers. We observed no severe bleedings and one deep vein thrombosis attributable to an insufficient anticoagulation with argatroban. In our experience, monitoring argatroban and bivalirudin with TT permits an efficient anticoagulation of HIT-patients. Treatment targets (either TT or aPTT) have to be established with the local reagent/coagulometer combination. In HIT patients with normal liver (argatroban) or renal (bivalirudin) function, we suggest starting both DTI at a dose of 0.06 mg/kg/h (corresponding to 1.0 µg/kg/min) and to adjust it in steps of 0.015 mg/kg/h (i.e. 0.25 µg/kg/min) for argatroban and 0.05 mg/kg/h for bivalirudin.
Table 1A. Defining in-house target ranges for argatroban
|
Argatroban
|
|
|
|
TT1.5
|
|
TT5
|
|
aPTT
|
|
|
|
|
|
|
|
|
|
|
|
|
|
|
|
spiked
|
|
measured
|
|
|
|
|
|
|
|
|
|
|
|
|
|
|
|
|
|
|
|
|
|
mg/ml
|
|
mg/ml
|
|
sec
|
|
sec
|
|
sec
|
|
ratio
|
|
|
|
|
|
|
|
|
|
|
|
|
|
|
|
median [IQR]
|
|
median [IQR]
|
|
median [IQR]
|
|
median [IQR]
|
|
median [IQR]
|
|
|
|
|
|
|
|
|
|
|
|
|
|
0.00
|
|
0
|
|
12.5 [11.2 – 13.4]
|
|
---
|
|
29.7 [28.7 – 30.6]
|
|
1
|
|
|
|
|
|
|
|
|
|
|
|
|
|
0.10
|
|
0.10 [0.08 – 0.13]
|
|
22.3 [21.4 – 26.7]
|
|
---
|
|
39.0 [37.2 – 39.6]
|
|
1.29 [1.27 – 1.34]
|
|
|
|
|
|
|
|
|
|
|
|
|
|
0.20
|
|
0.20 [0.19 – 0.22]
|
|
34.5 [32.3 – 36.9]
|
|
---
|
|
44.2 [42.7 – 44.5]
|
|
1.45 [1.40 – 1.50]
|
|
|
|
|
|
|
|
|
|
|
|
|
|
0.40
|
|
0.43 [0.31 – 0.47]
|
|
56.2 [51.0 – 61.1]
|
|
---
|
|
56.2 [50.9 – 61.1]
|
|
1.72 [1.61 – 1.79]
|
|
|
|
|
|
|
|
|
|
|
|
|
|
0.60
|
|
0.67 [0.57 – 0.70]
|
|
76.0 [70.7 – 85.6]
|
|
---
|
|
59.7 [58.3 – 60.1]
|
|
1.96 [1.92 – 2.12]
|
|
|
|
|
|
|
|
|
|
|
|
|
|
0.80
|
|
0.88 [0.76 – 0.88]
|
|
90.7 [83.0 – 99.0]
|
|
---
|
|
64.6 [62.1 – 65.3]
|
|
2.13 [2.07 – 2.30]
|
|
|
|
|
|
|
|
|
|
|
|
|
|
1.00
|
|
1.01 [0.99 – 1.06]
|
|
106.3 [102.7 – no clot*]
|
|
47.2 [45.0 – 57.5]
|
|
70.4 [68.6 – 72.5]
|
|
2.32 [2.26 – 2.51]
|
|
|
|
|
|
|
|
|
|
|
|
|
|
1.20
|
|
1.26 [1.13 – 1.27]
|
|
no clot
|
|
50.0 [47.4 – 55.8]
|
|
73.5 [72.7 – 75.5]
|
|
2.42 [2.40 – 2.71]
|
|
|
|
|
|
|
|
|
|
|
|
|
|
1.40
|
|
1.42 [1.31 – 1.63]
|
|
no clot
|
|
57.6 [53.3 – 63.5]
|
|
78.4 [76.6 – 80.3]
|
|
2.59 [2.49 – 2.86]
|
|
|
|
|
|
|
|
|
|
|
|
|
|
1.60
|
|
1.58 [1.46 – 1.88]
|
|
no clot
|
|
62.7 [61.3 – 71.1]
|
|
80.1 [79.1 – 83.2]
|
|
2.67 [2.64 – 2.92]
|
|
|
|
|
|
|
|
|
|
|
|
|
|
1.80
|
|
1.74 [1.65 – 1.98]
|
|
no clot
|
|
70.6 [67.3 – 78.3]
|
|
85.3 [81.9 – 88.9]
|
|
2.79 [2.75 – 3.21]
|
|
|
|
|
|
|
|
|
|
|
|
|
|
2.00
|
|
1.99 [1.90 – 2.20]
|
|
no clot
|
|
77.4 [74.5 – 83.3]
|
|
90.8 [86.2 – 91.8]
|
|
2.99 [2.90 – 3.23]
|
Pooled normal plasma was spiked with increasing concentrations of argatroban. Thrombin time (TT) and aPTT were measured with different reagent lots (n = 8). * = “no clot” signifies TT > 120 sec. IQR = interquartile range. Ratio = compared to basal aPTT.
Table 1B. Defining in-house target ranges for bivalirudin
|
Bivalirudin
|
|
|
|
TT1.5
|
|
TT5
|
|
aPTT
|
|
|
|
|
|
|
|
|
|
|
|
|
|
|
|
spiked
|
|
measured
|
|
|
|
|
|
|
|
|
|
|
|
|
|
|
|
|
|
|
|
|
|
mg/ml
|
|
mg/ml
|
|
sec
|
|
sec
|
|
sec
|
|
ratio
|
|
|
|
|
|
|
|
|
|
|
|
|
|
|
|
median [IQR]
|
|
median [IQR]
|
|
median [IQR]
|
|
median [IQR]
|
|
median [IQR]
|
|
|
|
|
|
|
|
|
|
|
|
|
|
0.00
|
|
0
|
|
12.7 [11.9 – 13.0]
|
|
---
|
|
29.8 [29.5 – 30.2]
|
|
1
|
|
|
|
|
|
|
|
|
|
|
|
|
|
0.10
|
|
0.11 [0.08 – 0.12]
|
|
26.4 [24.8 – 28.2]
|
|
---
|
|
44.9 [43.1 – 45.6]
|
|
1.47 [1.43 – 1.50]
|
|
|
|
|
|
|
|
|
|
|
|
|
|
0.20
|
|
0.18 [0.17 – 0.23]
|
|
38.7 [38.0 – 39.2]
|
|
---
|
|
50.8 [50.4 – 51.3]
|
|
1.70 [1.67 – 1.72]
|
|
|
|
|
|
|
|
|
|
|
|
|
|
0.40
|
|
0.39 [0.38 – 0.42]
|
|
64.2 [62.8 – 65.5]
|
|
---
|
|
60.1 [59.6 – 61.0]
|
|
2.01 [1.98 – 2.04]
|
|
|
|
|
|
|
|
|
|
|
|
|
|
0.60
|
|
0.62 [0.57 – 0.64]
|
|
87.0 [83.8 – 89.8]
|
|
---
|
|
67.7 [66.7 – 69.0]
|
|
2.26 [2.21 – 2.30]
|
|
|
|
|
|
|
|
|
|
|
|
|
|
0.80
|
|
0.83 [0.81 – 0.88]
|
|
109.3 [106.8 – 112.8]
|
|
---
|
|
74.2 [73.4 – 74.8]
|
|
2.46 [2.34 – 2.52]
|
|
|
|
|
|
|
|
|
|
|
|
|
|
1.00
|
|
1.01 [1.00 – 1.06]
|
|
no clot
|
|
38.3 [35.8 – 38.9]
|
|
78.1 [75.4 – 79.7]
|
|
2.58 [2.56 – 2.64]
|
|
|
|
|
|
|
|
|
|
|
|
|
|
1.20
|
|
1.22 [1.20 – 1.29]
|
|
no clot
|
|
43.0 [42.0 – 43.6]
|
|
84.1 [81.4 – 86]
|
|
2.79 [2.70 – 2.85]
|
|
|
|
|
|
|
|
|
|
|
|
|
|
1.40
|
|
1.40 [1.38 – 1.48]
|
|
no clot
|
|
47.0 [46.0 – 48.9]
|
|
89.8 [86.3 – 93.3]
|
|
2.94 [2.86 – 3-05]
|
|
|
|
|
|
|
|
|
|
|
|
|
|
1.60
|
|
1.55 [1.53 – 1.58]
|
|
no clot
|
|
49.0 [48.2 – 50.1]
|
|
92.4 [89.5 – 94.7]
|
|
3.06 [2.97 – 3.13]
|
|
|
|
|
|
|
|
|
|
|
|
|
|
1.80
|
|
1.86 [1.76 – 1.88]
|
|
no clot
|
|
56.0 [54.8 – 57.4]
|
|
96.3 [93.6 – 99.2]
|
|
3.18 [3.10 – 3.28]
|
|
|
|
|
|
|
|
|
|
|
|
|
|
2.00
|
|
1.96 [1.90 – 2.05]
|
|
no clot
|
|
58.9 [35.8 – 38.9]
|
|
100.2 [98.1 – 101.1]
|
|
3.28 [3.25 – 3.50]
|
Pooled normal plasma was spiked with increasing concentrations of bivalirudin. Thrombin time (TT) and aPTT were measured with different reagent lots (n = 6). * = “no clot” signifies TT >120 sec. IQR = interquartile range. Ratio = compared to basal aPTT.
Key words
heparin, thrombocytopenia, argatroban, bivalirudin, treatment, therapeutic drug monitoring
Introduction
Heparin-induced thrombocytopenia (HIT) [1,2] represents a highly procoagulant state [3], requiring prompt recognition and effective anticoagulant treatment with non-heparin drugs. After the withdrawal of lepirudin from the market 2012, there are two other parenteral direct thrombin inhibitors (DTI) which can be employed for HIT-patients, argatroban [4] and bivalirudin [5]. Argatroban is a small synthetic L-arginine derivative with a molecular mass of 527 Da and a half-life of ~45 minutes; it is metabolized hepatically and its excretion does not depend on renal function [4]. Bivalirudin is a 20 amino-acids hirudin-analogue with a molecular mass of 2’180 Da and a half-life of ~25 minutes; it is eliminated by proteolysis and for ~20% by renal clearance [5]. Both bind human thrombin reversibly, argatroban with an inhibitory constant of 40 nM and bivalirudin 2 nM [4,5]. In 2012 there were no detailed guidelines for their practical handling. Our aim was to define in-house therapeutic ranges, dosing and adjustment schedules for these DTI.
Methods
Patients
Between December 2012 and February 2014 16 patients were treated at our University Hospital with either argatroban (n=10, Table 2A) or bivalirudin (n=6, Table 2B). This retrospective quality-assurance survey was conducted in accordance with institutional guidelines for observational studies [6].
Table 2A. HIT-Patients treated with argatroban
|
UPN
|
Sex
|
Age
|
CrCl
|
4T
|
PaGIA
|
ELISA
|
PAT
|
Dg
|
Argatroban dose
|
|
|
|
Dose adaptations
|
|
|
Treatment length
|
|
|
|
|
|
|
|
|
|
|
|
|
|
|
|
|
|
|
|
|
|
years
|
ml/min
|
score
|
titer
|
O.D.
|
|
|
µg/kg/min
|
|
|
|
number
|
|
|
days
|
|
|
|
|
|
|
|
|
|
|
|
|
|
|
|
|
|
|
|
|
|
|
|
|
|
|
|
|
Initial
|
First time in target range
|
First steady-state
|
At stop
|
Till first time in target range
|
Total increases
|
Total decrease
|
|
|
|
|
|
|
|
|
|
|
|
|
|
|
|
|
|
|
|
|
A02
|
F
|
66.9
|
69
|
7
|
8
|
2.659
|
pos
|
HIT-T
|
0.50
|
0.65
|
0.73
|
1.05
|
3
|
13
|
4
|
26
|
|
|
|
|
|
|
|
|
|
|
|
|
|
|
|
|
|
|
|
A05
|
M
|
69.6
|
127
|
7
|
256
|
>3.000
|
pos
|
HIT-T
|
0.50
|
0.98
|
0.98
|
0.98
|
4
|
5
|
1
|
15
|
|
|
|
|
|
|
|
|
|
|
|
|
|
|
|
|
|
|
|
A07
|
F
|
73.2
|
59
|
4
|
8
|
>3.000
|
pos
|
HIT
|
0.50
|
0.51
|
0.24
|
0.24
|
0
|
0
|
6
|
7
|
|
|
|
|
|
|
|
|
|
|
|
|
|
|
|
|
|
|
|
A08
|
F
|
55.1
|
77
|
6
|
32
|
>3.000
|
pos
|
HIT-T
|
0.50
|
1.06
|
1.82
|
2.70
|
6
|
20
|
0
|
17
|
|
|
|
|
|
|
|
|
|
|
|
|
|
|
|
|
|
|
|
A01
|
M
|
70.0
|
82
|
5
|
16
|
2.368
|
pos
|
HIT
|
1.00
|
1.48
|
1.60
|
1.71
|
2
|
8
|
4
|
14
|
|
|
|
|
|
|
|
|
|
|
|
|
|
|
|
|
|
|
|
A03
|
M
|
56.8
|
134
|
6
|
64
|
>3.000
|
pos
|
HIT-T
|
1.00
|
0.99
|
1.37
|
1.51
|
0
|
9
|
4
|
34
|
|
|
|
|
|
|
|
|
|
|
|
|
|
|
|
|
|
|
|
A04
|
F
|
70.2
|
69
|
5
|
4
|
1.399
|
neg
|
HIT-T
|
1.00
|
0.95
|
0.95
|
1.09
|
0
|
4
|
2
|
15
|
|
|
|
|
|
|
|
|
|
|
|
|
|
|
|
|
|
|
|
A06
|
M
|
69.4
|
88
|
5
|
4
|
1.572
|
neg
|
HIT
|
1.00
|
0.86
|
0.86
|
0.86
|
1
|
0
|
1
|
2
|
|
|
|
|
|
|
|
|
|
|
|
|
|
|
|
|
|
|
|
A09
|
F
|
67.4
|
117
|
7
|
64
|
>3.000
|
pos
|
HIT-T
|
1.00
|
0.97
|
0.97
|
1.68
|
0
|
18
|
0
|
15
|
|
|
|
|
|
|
|
|
|
|
|
|
|
|
|
|
|
|
|
A10
|
M
|
56.6
|
125
|
4
|
32
|
2.874
|
pos
|
HIT
|
1.00
|
1.13
|
1.51
|
1.56
|
4
|
15
|
0
|
14
|
Legend: UPN = unique patient number; CrCl = Creatinine clearance (Cockcroft-Gault); 4T = 4T scoring system for HIT likelihood; PaGIA = ID-H/PF4-partricle-gel immune-assay; ELISA = GTI-PF4 Enhanced; Dg = Diagnosis; PAT = heparin-induced platelet aggregation test; HIT = Heparin-induced thrombocytopenia; HIT-T = HIT with thrombosis
Table 2B. HIT-Patients treated with bivalirudin
|
UPN
|
Sex
|
Age
|
CrCl
|
4T
|
PaGIA
|
ELISA
|
PAT
|
Dg
|
Bivalirudin dose
|
|
|
|
Dose adaptations
|
|
|
Treatment length
|
|
|
|
|
|
|
|
|
|
|
|
|
|
|
|
|
|
|
|
|
|
years
|
ml/min
|
score
|
titer
|
O.D.
|
|
|
mg/kg/h
|
|
|
|
number
|
|
|
days
|
|
|
|
|
|
|
|
|
|
|
|
|
|
|
|
|
|
|
|
|
|
|
|
|
|
|
|
|
Initial
|
First time in target range
|
First steady-state
|
At stop
|
Till first time in target range
|
Total increases
|
Total decrease
|
|
|
|
|
|
|
|
|
|
|
|
|
|
|
|
|
|
|
|
|
B04
|
M
|
65.7
|
50
|
6
|
2
|
0.513
|
neg
|
HIT ?
|
0.04
|
0.119
|
0.138
|
0.124
|
12
|
18
|
4
|
8
|
|
|
|
|
|
|
|
|
|
|
|
|
|
|
|
|
|
|
|
B01
|
M
|
55.1
|
80
|
7
|
64
|
2.958
|
pos
|
HIT-T
|
0.06
|
0.066
|
0.056
|
0.055
|
3
|
4
|
6
|
14
|
|
|
|
|
|
|
|
|
|
|
|
|
|
|
|
|
|
|
|
B02
|
M
|
56.8
|
85
|
4
|
16
|
2.484
|
pos
|
HIT
|
0.06
|
0.238
|
0.300
|
0.300
|
13
|
18
|
1
|
16
|
|
|
|
|
|
|
|
|
|
|
|
|
|
|
|
|
|
|
|
B05
|
M
|
33.2
|
107
|
6
|
32
|
>3.000
|
pos
|
HIT-T
|
0.06
|
0.239
|
0.379
|
0.325
|
15
|
31
|
5
|
15
|
|
|
|
|
|
|
|
|
|
|
|
|
|
|
|
|
|
|
|
B03
|
M
|
41.2
|
142
|
4
|
2
|
0.245
|
neg
|
no HIT
|
0.06
|
---
|
---
|
0.107
|
---
|
7
|
0
|
2
|
|
|
|
|
|
|
|
|
|
|
|
|
|
|
|
|
|
|
|
B06
|
F
|
87.6
|
63
|
6
|
neg
|
0.114
|
neg
|
no HIT
|
0.06
|
---
|
---
|
0.171
|
---
|
13
|
0
|
3
|
|
|
|
|
|
|
|
|
|
|
|
|
|
|
|
|
|
|
Legend: UPN = unique patient number; CrCl = Creatinine clearance (Cockcroft-Gault); 4T = 4T scoring system for HIT likelihood; PaGIA = ID-H/PF4-partricle-gel immune-assay; ELISA = GTI-PF4 Emhanced; PAT = heparin-induced platelet aggregation test; Dg = Diagnosis; HIT = Heparin-induced thrombocytopenia; HIT ? = HIT not excluded; HIT-T = HIT with thrombosis
HIT diagnostic work-up
We approach patients with suspected HIT as described [7,8]. Noteworthy, by rapid quantification of the anti-PF4/heparin-antibody titer [9,10], we can quickly exclude or confirm HIT in the majority of the patients evaluated [8], thus avoiding unnecessary exposure to DTI.
Laboratory methods
Blood handling and laboratory assays have been described previously [6,11]. Specifically, activated partial thromboplastin time (aPTT) was measured with Pathromtin SL (Siemens Healthcare Diagnostics, Eschborn, Germany) on a Siemens BCS (Siemens); thrombin time (TT) was assessed with Thrombin-Reagent (Siemens) at final thrombin concentrations of 1.5 U/ml (TT1.5) and 5 U/ml (TT5); argatroban and bivalirudin were quantitated by Hemoclot® Thrombin Inhibitors with the dedicated calibrators (Hyphen Biomed, Neuville-sur-Oise, France). D-dimers were measured by VIDAS D-dimer New (bioMérieux, Marcy l’Etoile, France).
Results and discussion
In-house target ranges for argatroban and bivalirudin
In order to define in-house therapeutic targets we spiked pooled normal plasma with different concentrations of argatroban and bivalirudin [4,6]. We measured TT, aPTT and DTI concentration (Tables 1A and 1B). According to published results [12], we aimed at argatroban concentrations between 0.4 and 0.8 µg/ml. This corresponds with our reagent/coagulometer combinations to a TT1.5 ranging from 55 to 100 seconds (sec) and a 1.7 to 2-fold prolongation of the aPTT (Table 1A). We verified this target with plasma probes of patients treated with argatroban. Samples with TT1.5 in the lower therapeutic range (median TT1.5 66.6 sec, IQR 66.1–68.7 sec) contained an argatroban concentration of median 0.55 µg/ml (IQR 0.50–0.56 µg/ml) and probes in the higher therapeutic range (median TT1.5 91.1 sec, IQR 83.7–97.4 sec) a concentration of 0.70 µg/ml (IQR 0.64–0.84 µg/ml; p=0.011, Mann-Whitney).
As for bivalirudin, according to our experience with lepirudin [6], we aimed at a therapeutic concentration of about 1.0 µg/ml. This corresponds in our laboratory to a TT1.5 ≥110 sec and a TT5 <40 sec and a ca. 2.5-fold prolongation of the baseline aPTT, provided it lies in the reference range (Table 1B). Patient plasma probes in this range contained a median bivalirudin concentration of 1.12 µg/ml (IQR 0.90–1.39 µg/ml).
Because of the significant inter-patient variability of the aPTT [2,13-15] and of the robustness and simplicity of TT, we rely on the latter for DTI monitoring, with measurements 3 hours after start or dose adjustments and every 24 hours in steady-state. Therapeutic anticoagulation is reached when TT are within target for two consecutive measurements, 3 hours apart [6].
In-house experience with argatroban
Published data show that the initial bolus can be omitted and the official recommended argatroban dose of 2.0 µg/kg/min is too high [12,16,17]. Therefore, we established an in-house standard initial dose of 1.0 µg/kg/min (corresponding to 0.06 mg/kg/h) for HIT-patients. In case of unstable, critically ill HIT-patients, defined as patients with severe heart failure and/or several organ dysfunctions [18], we further reduced the argatroban dose to 0.5 µg/kg/min. Moreover, in case of severe impairment of hepatic function, defined as a bilirubin value >25.5 µmol/l and/or ALAT 3x over the upper normal range [17,19], we administered argatroban at a dosage of 0.25 µg/kg/min.
We have treated 10 HIT-patients with argatroban for a total of 159 treatment days (Table 2A). The starting dose was 1.0 µg/kg/min in 6 patients and 0.5 µg/kg/min for the others. Table 2A shows that among patients treated with our in-house standard initial dose, therapeutic anticoagulation was reached quickly, with a median of 0.5 dose adaptations per patient (range 0–4) required for reaching a TT1.5 within therapeutic range and a first therapeutic dose of median 0.98 µg/kg/min (range 0.86–1.48 µg/kg/min). The first steady state dosage, i.e. without adjustments for at least 24 hours, was median 1.17 µg/kg/min (range 0.86–1.60 µg/kg/min) and the final dose was 1.54 µg/kg/min (range 0.86–1.71 µg/kg/min). These data are in line with the experience published by Vo et al. on 47 HIT patients without liver dysfunction reaching therapeutic anticoagulation with an argatroban dose of 1.1 µg/kg/min (interquartile range 0.75–2.0 µg/kg/min) [20]. However, we observed a 50% higher therapeutic dose, probably because the majority of our patients had thrombotic HIT, while only a minority of those described by Vo et al. had a positive anti-PF4/heparin antibody assay [20].
HIT-patients initially treated with a reduced argatroban dosage required more dose adaptations (median 3.5, range 0–6) in order to obtain therapeutic coagulation assays, with a first therapeutic dose of median 0.82 µg/kg/min (range 0.51–1.06 µg/kg/min), a first steady-state dose of 0.86 µg/kg/min (range 0.24–1.82 µg/kg/min) and a final one of 1.02 µg/kg/min (range 0.24–2.70 µg/kg/min).
During argatroban treatment there were very frequent dose adaptations, in particular dose increases (median 8.5 per patient, range 0–20). This may be due to following reasons: 1) No published recommendations for dosage adjustments; 2) A wrong understating of the therapeutic target, leading to dose adaptations in case of TT1.5 variations within the therapeutic range (see e.g., patient A04 in Table 2A); 3) Dose adaptations in too small steps. According to our current experience (standard starting dose of 0.06 mg/kg/h, final dose of 1.54 µg/kg/min, corresponding to about 0.09 mg/kg/h) we propose to adjust argatroban dosage in steps of 0.015 mg/kg/h (i.e. 0.25 µg/kg/min).
Figure 1 shows that our approach was efficient, with a rapid normalization of the platelet count (Figure 1A) and a decrease of D-dimers (Figure 1B), without inducing severe bleeding events or a drop of the hemoglobin levels (Figure 1C). Of note, we observed one new deep vein thrombosis (DVT) attributable to insufficient anticoagulation (Patient A09, the last two TT1.5 preceding DVT-diagnosis at day 9 were 57.8 and 55.1 sec).
Figure legends
Figure 1. Course of platelet counts, D-dimers, and hemoglobin levels in HIT-patients treated with argatroban or bivalirudin
Panels A-C. Patients treated with argatroban (n=10; see Table 2A). In all panels mean values and 95% confidence intervals (95% C.I.) are depicted.
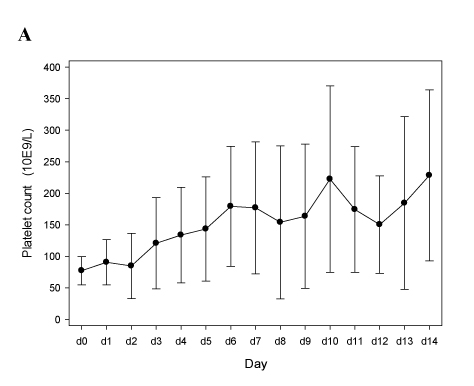
Figure 1A
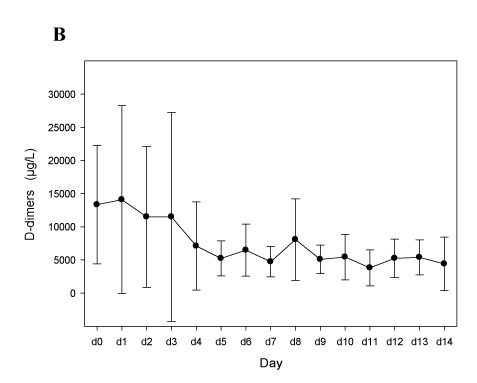
Figure 1B
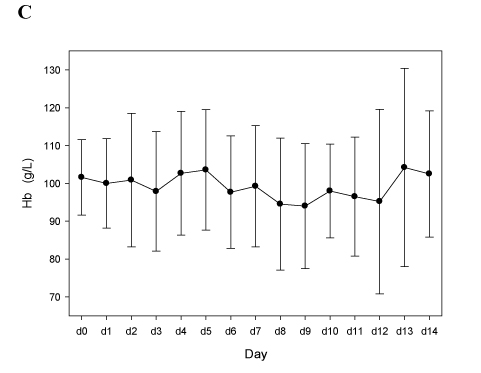
Figure 1C
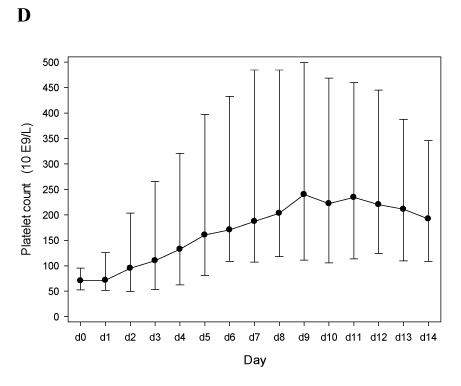
Figure 1D
Nine out of 10 patients were switched to long-term oral anticoagulation with vitamin K-antagonists (VKA). Because of the well-known impact of argatroban on the prothrombin time (4), we administered VKA for at least 5 days and additionally aimed at a INR between 3 and 4 for two consecutive days before stopping the DTI. The INR values dropped by 1.2 (range 0.6 – 1.7) from a median INR of 3.9 (range 3.4 – 4.3) to 2.6 (range 2.1 – 3.3) 4 hours after stopping argatroban, a time point at which its expected plasmatic concentration is <10%. Of note, the observed INR difference of 1.2 is perfectly in line with the value of 1.3 reported by Bain and Meyer [21].
In-house experience with bivalirudin
While there is a consensus that a bolus can be omitted [5], the optimal bivalirudin initial dose for treating HIT patients is unclear and published data vary widely between 0.05–0.06 mg/kg/h [17,22] and 0.15–0.20 mg/kg/h [23,24]. Based upon our experience with lepirudin [6] and because Deng et al. observed 58% major bleedings with a mean bivalirudin starting dose of 0.1 mg/kg/h [23], we agreed on lower starting doses. Our in-house recommendations indicate an initial bivalirudin infusion of 0.06 mg/kg/h for patients with a creatinine clearance according to Cockroft-Gault [25] (CrCl) >60 ml/min [17], 0.04 mg/kg/h with a CrCl between 30 and 60 ml/min, and 0.02 mg/kg/h for a CrCl between 15 and 30 ml/min [1].
We have treated 6 patients with bivalirudin, however 2 of them (B03, B06) turned out not to have HIT and were excluded from analysis (Table 2B). Contrary to argatroban, more dose adaptations were required in order to achieve a therapeutic TT5 (median 12.5 per patient, range 3–15) and the median first therapeutic bivalirudin dosage was almost 3 times higher than the staring one (median 0.178 mg/kg/h, range 0.066–0.239 mg/kg/h). The final bivalirudin dose was 0.212 mg/kg/h (range 0.055–0.325 mg/kg/h). This latter observation is well in line with the experience reported by Bain and Meyer, describing 7 HIT patients with normal renal function who reached therapeutic anticoagulation with a mean bivalirudin dose of 0.21 mg/kg/h – unfortunately, ranges are not provided [21]. For these reasons we are now recommending bivalirudin dose adaptations in steps of at least 0.05 mg/kg/h.
2021 Copyright OAT. All rights reserv
Despite the higher number of dose adaptations required to reach a therapeutic anticoagulation, bivalirudin treatment appeared to be efficient as well, with a rapid normalization of the platelet count (Figure 1D), a decrease of D-dimers (Figure 1E), and without new thrombotic events, a drop of hemoglobin values (Figure 1F), or severe bleeding episodes. This is consistent with the experience published by Vo et al. [20].
Panels E-F. Patients treated with bivalirudin (n=4; see Table 2B). In panels D and E median vales, 25th and 75th percentiles are depicted. In panel F mean values and 95% C.I.
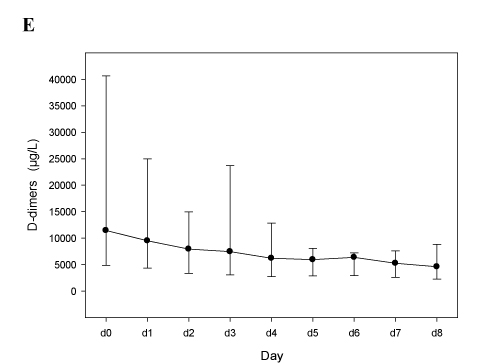
Figure 1E
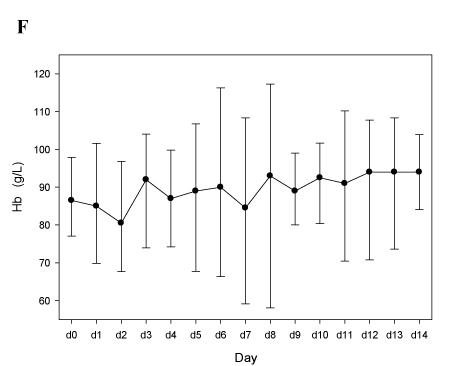
Figure 1F
d0 = the day of HIT diagnostic work-up in which heparin treatment was stopped and DTI started
Three of the 4 patients were switched to long-term oral anticoagulation with VKA, with INR values dropping by median 0.8 (range 0.8 – 1.3) 4 hours after stopping bivalirudin. For comparison, Bain and Meyer found a mean difference of 0.4 [21].
Conclusions
We present our experience treating HIT with the DTI argatroban and bivalirudin. Despite the low number of patients, the median treatment length was 15 days for both DTI, with a total of 159 treatments days with argatroban and 53 days with bivalirudin. Moreover, since a) all patients had high-titer anti-PF4/heparin antibodies, b) eight out of the 12 patients had thrombotic HIT (67%), c) all doses adjustments were carefully monitored, and d) clinical and laboratory data were complete, we can nevertheless derive some teachings.
First, it is mandatory that every laboratory establishes in-house reference ranges with the own reagent/coagulometer combination. For instance, the generally stated therapeutic range for argatroban (a 1.5 to 3-fold prolongation of the aPTT, with an aPTT not exceeding 90 sec) (4), would cover argatroban concentrations ranging from 0.2 to 2.0 µg/ml with our equipment (Table 1A). As for bivalirudin, while the upper limit of the standard target range (a 1.5 to 2.5-fold aPTT prolongation) [5] appears appropriate, in our hands more than a doubling of the basal aPTT is required to reach a possibly therapeutic bivalirudin concentration (Table 1B).
Second, we show that a single TT (with a final thrombin concentration of 1.5 U/ml) can be employed for argatroban monitoring. The TT is a simple, cheap and robust coagulation assay, which is more reliable than the aPTT (2, 13-15). At our institution we routinely employ TT for adjusting both argatroban and bivalirudin dosages.
Third, an argatroban initial dose of 1.0 µg/kg/min (corresponding to 0.06 mg/kg/h) will allow rapid therapeutic anticoagulation in most HIT patients. When dose adaptation will be necessary we suggest performing this in steps of 0.25 µg/kg/min (corresponding to 0.015 mg/kg/h). On the other hand, for bivalirudin while we maintain low starting doses, we suggest to adjust it in wider steps of at least 0.05 mg/kg/h.
Fourth, similarly to what has been published by other groups [12], our experience supports a therapeutic argatroban concentration of 0.4–0.8 µg/ml. Unfortunately, our data for bivalirudin are too limited to verify the proposed target concentration of about 1 µg/ml.
Fifth, consistently with another publication [21], we show that argatroban increases the INR (when assessed with Innovin®) by about 1.2. Therefore aiming at an INR value of 3.5 up to 4.0 will be enough for maintaining a therapeutic INR once argatroban will be stopped. This is a lower (and possibly safer) target INR than suggested by an international consensus paper [4]. We noted a smaller effect for bivalirudin [21].
In summary, monitoring argatroban and bivalirudin with TT permits an efficient anticoagulation of HIT-patients. According to our experience both DTI can be started with a dose of 0.06 mg/kg/h. We suggest adjusting dosages by steps of 0.015 mg/kg/h (corresponding to 0.25 µg/kg/min) for agatroban and at least 0.05 mg/kg/h for bivalirudin. Therapeutic concentrations are 0.4–0.8 µg/ml for argatroban and about 1 µg/ml for bivalirudin. It is mandatory to establish anticoagulation treatment targets for both TT and aPTT with the local reagent/coagulometer combination.
Acknowledgments
We would like to thank all the physicians of our Department of Hematology who were involved in care of HIT-patients, the technicians of the Central Hematology Laboratory who perform routine diagnostic HIT-assays, and Therese Jost for her outstanding administrative assistance.
Authorship and conflict of interest statements
- Colucci was involved in patient care, analyzed the data, and wrote the manuscript
- Nagler was involved in patient care and wrote the manuscript
- Klaus performed research
- Conte performed research
- Giabbani performed research
- Alberio conceived the study, was involved in patient care, collected and analyzed the data and wrote the manuscript.
The authors declare no competing financial interests.
References
- Linkins LA, Dans AL, Moores LK, Bona R, Davidson BL, et al. (2012) Treatment and prevention of heparin-induced thrombocytopenia: Antithrombotic Therapy and Prevention of Thrombosis, 9th ed: American College of Chest Physicians Evidence-Based Clinical Practice Guidelines. Chest 141(2 Suppl): e495S-530S. [Crossref]
- Greinacher A (2015) CLINICAL PRACTICE. Heparin-Induced Thrombocytopenia. N Engl J Med 373: 252-261. [Crossref]
- Chilver-Stainer L, Lammle B, Alberio L (2004) Titre of anti-heparin/PF4-antibodies and extent of in vivo activation of the coagulation and fibrinolytic systems. Thromb Haemost 91: 276-82.
- Alatri A, Armstrong AE, Greinacher A, Koster A, Kozek-Langenecker SA, et al. (2012) Results of a consensus meeting on the use of argatroban in patients with heparin-induced thrombocytopenia requiring antithrombotic therapy - a European Perspective. Thromb Res 129: 426-433. [Crossref]
- Warkentin TE, Greinacher A, Koster A (2008) Bivalirudin. Thromb Haemost 99: 830-839. [Crossref]
- Tschudi M, Lämmle B, Alberio L (2009) Dosing lepirudin in patients with heparin-induced thrombocytopenia and normal or impaired renal function: a single-center experience with 68 patients. Blood 113: 2402-2409. [Crossref]
- Alberio L (2008) Heparin-induced thrombocytopenia: some working hypotheses on pathogenesis, diagnostic strategies and treatment. Curr Opin Hematol 15: 456-464. [Crossref]
- Nellen V, Sulzer I, Barizzi G, Lämmle B, Alberio L (2012) Rapid exclusion or confirmation of heparin-induced thrombocytopenia: a single-center experience with 1,291 patients. Haematologica 97: 89-97. [Crossref]
- Alberio L, Kimmerle S, Baumann A, Taleghani BM, Biasiutti FD, et al. (2003) Rapid determination of anti-heparin/platelet factor 4 antibody titers in the diagnosis of heparin-induced thrombocytopenia. Am J Med 114: 528-536. [Crossref]
- Schneiter S1, Colucci G, Sulzer I, Barizzi G, Lämmle B, et al. (2009) Variability of anti-PF4/heparin antibody results obtained by the rapid testing system ID-H/PF4-PaGIA. J Thromb Haemost 7: 1649-1655. [Crossref]
- Zurcher M, Sulzer I, Barizzi G, Lammle B, Alberio L (2008) Stability of coagulation assays performed in plasma from citrated whole blood transported at ambient temperature. Thromb Haemost 99: 416-26. [Crossref]
- Shepherd MF, Jacobsen JM, Rosborough TK (2011) Argatroban therapy using enzymatic anti-factor IIa monitoring. Ann Pharmacother 45: 422-423. [Crossref]
- Hellwig TR, Peitz GJ, Gulseth MP (2012) High-dose argatroban for treatment of heparin-induced thrombocytopenia with thrombosis: a case report and review of laboratory considerations. Am J Health Syst Pharm 69: 490-495. [Crossref]
- Kennedy DM, Alaniz C (2013) Apparent argatroban resistance in a patient with elevated factor VIII levels. Ann Pharmacother 47: e29. [Crossref]
- Gosselin RC, King JH, Janatpour KA, Dager WE, Larkin EC, et al. (2004) Comparing direct thrombin inhibitors using aPTT, ecarin clotting times, and thrombin inhibitor management testing. Ann Pharmacother 38: 1383-8. [Crossref]
- Bartholomew JR, Pietrangeli CE, Hursting MJ (2007) Argatroban anticoagulation for heparin-induced thrombocytopenia in elderly patients. Drugs Aging 24: 489-499. [Crossref]
- Skrupky LP, Smith JR, Deal EN, Arnold H, Hollands JM, et al. (2010) Comparison of bivalirudin and argatroban for the management of heparin-induced thrombocytopenia. Pharmacotherapy 30: 1229-1238. [Crossref]
- Begelman SM, Baghdasarian SB, Singh IM, Militello MA, Hursting MJ, et al. (2008) Argatroban anticoagulation in intensive care patients: effects of heart failure and multiple organ system failure. J Intensive Care Med 23: 313-320. [Crossref]
- Levine RL, Hursting MJ, McCollum D (2006) Argatroban therapy in heparin-induced thrombocytopenia with hepatic dysfunction. Chest 129: 1167-1175. [Crossref]
- Vo QA, Lin JK, Tong LM (2015) Efficacy and safety of argatroban and bivalirudine in patients with suspected heparin-induced thrombocytopenia. Ann Pharmacother 49: 178-84. [Crossref]
- Bain J, Meyer A2 (2015) Comparison of bivalirudin to lepirudin and argatroban in patients with heparin-induced thrombocytopenia. Am J Health Syst Pharm 72: S104-109. [Crossref]
- Kiser TH, Fish DN (2006) Evaluation of bivalirudin treatment for heparin-induced thrombocytopenia in critically ill patients with hepatic and/or renal dysfunction. Pharmacotherapy 26: 452-460. [Crossref]
- Dang CH, Durkalski VL, Nappi JM (2006) Evaluation of treatment with direct thrombin inhibitors in patients with heparin-induced thrombocytopenia. Pharmacotherapy 26: 461-468. [Crossref]
- Runyan CL, Cabral KP, Riker RR, Redding D, May T, Seder DB, et al. (2011) Correlation of bivalirudin dose with creatinine clearance during treatment of heparin-induced thrombocytopenia. Pharmacotherapy 31: 850-6. [Crossref]
- Cockcroft DW, Gault MH (1976) Prediction of creatinine clearance from serum creatinine. Nephron 16: 31-41. [Crossref]