This work presents the synthesis of a new material, graphene/zinc oxide nano composite (GZnNC) by employing ultrasonication techniques where nano-ZnO and graphene nano-sheet have been dispersed in ethanol followed by microwave irradiation. The GZnNC was well characterized by XRD, HRTEM, FTIR, and Raman spectroscopy. Also, polymer based GZnNC has been subjected to the measurement of energy harvesting/thermoelectric properties. Present study includes PVAc, PVAc/PEDOT: PSS, and PEDOT: PSS based compositions with concentration variation of GZnNC/graphene and measurement of thermoelectric properties like electrical conductivity, Seebeck coefficient, power factor (PF), thermal conductivity and figure of merit(ZT). PEDOT: PSS/GZnNC composite showed the twelve-fold increase in electrical conductivity and two times increase in Seebeck coefficient as compared to the PVAc-graphene composite. Interestingly, the calculated power factor for PEDOT: PSS/GZnNC composite increases up to 50 times as compared to PVAc/graphene composite. Thermal conductivity gets reduced to 3.01 W/mK Hence, figure of merit is reached up to 0.0051. This value is comparatively very high compare to the existing nanocomposites
graphene, zinc oxide, energy harvester, thermoelectric, power factor, figure of merit
Thermoelectricity is an impending area which is related to smart materials transforming electricity into heat and vice versa. In recent times, thermoelectric materials have expanded incredible research welfares as green and clean energy birthplace that assistances in harvesting of energy from surplus heat. The competence of thermoelectric materials is articulated as ZT= S2σT/к, where ‘S’ represented by Seebeck coefficient i.e. thermopower, σ is expressed by electrical conductivity, к symbolize thermal conductivity and T stands for absolute temperature [1]. Currently, few inorganic materials like silver-doped Cu2Se and Cu2Te, SrTiO3 by Pr doping, copper telluride magnesium silicide, Bi2Te3 nanowires, n-type SiGe alloys, CuxS and β-Zn4Sb3 [2-10] exhibit enriched thermoelectric enactment. Out of them, Bi2Te3 is originated as the superlative ambient thermoelectric materials [11-14]. Organic compounds like polymers having conjugation are flattering more prospective [15-18] material owing to their enhance thermoelectric power factor and figure of merit. Besides their low-slung thermal conductivity (0.1–0.5Wm-1K-1), [19-20] tranquil processibility, flexibility, nontoxicity, strength and inexpensiveness as compared to chalcogenides sort them more advantageous. Numerous other recompenses like thermoelectric paint ended armor vehicle for furtiveness, mechanical robustness for better permanence and cloths based on flexible fabricated thermo electric materials for energy mowing from human body warmth. Such submissions are very challenging to realize in the event of chalcogenide based thermoelectric. In polymer based composite, greater power factor, i.e., S2σ, can be realized by couple of mechanisms: 1. Blending the polymer [21-23] with diverse conducting nanofillers [24-26] similar to CNT [27-28] and graphenes [29-32]. Since the award of Noble prize on the topic of graphene, numerous endeavors have been made by diverse investigators in the direction of jeer out its expedient properties [33]. Graphene has a panorama to attract devotion due to its exclusive possessions like ambipolar electric field effect, ambient condition quantum effect, and extraordinary carrier mobility [2]. Extreme reduction of such distinguishing properties of graphene is possible with escalation in numeral of graphene layers till it reaches to three-dimensional arrangement (graphite, a bulk form of graphene, with multilayer structure) [35,36]. Ten or less than ten of such graphitic layers reveal distinctive possessions as compared to the bulk arrangement [37]. Such extraordinary properties sort graphene as one of the best engaging material for its submissions in innumerable fields such as composite, electronic and advance machine-driven resonator [38,39]. Graphene has an elite capability of snowballing the thermoelectric effect by employing the appropriate metal oxide/ metal nanoparticles on its surface. Consequently, the number of operative site on surface of graphene upsurges. In the field of nanotechnology, it has been used as a substrate. Investigations on the thermoelectric possessions of such composites are instituted them to be viable on chalcogenides. However, their adeptness is quiet subordinate [21,24,25]. Out of many polymers, (3,4-ethylenedioxythiophene): poly (styrene sulfonate) (PEDOT: PSS), [16,40] poly (3-hexylthiophene) (P3HT), [41] and polyaniline (PANI) [31,42-44] are frequently used owing to their inherent great electrical conductivity. The enhancement of electrical properties of the polymer can be possible without upsetting the mechanical flexibility and thermal conductivity which is inconsistent with percolation law [45]. According to this law, a drastic increase in electrical conductivity will be attained after accomplishment to a percolation edge [46,47]. Despite extraordinary thermal conductivity, these materials could be wangled in a modest method to augment thermoelectric possessions of blended polymer nanocomposite. It has been shown that PVAc was employed for its upright bonding agent nature and binding competence through lesser thermal conductivity which assistances to upsurge the filler packing and competence of thermoelectric material.
To upsurge the electrical conductivity radically, graphene has been used as a substrate. Graphene in conjunction with few metal oxides viz. iron oxide, [48] nickel oxide, titanium dioxide, [49-52] cadmium oxide and doped zirconium oxide exhibited remarkable TE properties. Among various notorious stable iron oxide stoichiometries, Fe2O3 is an oxide that has been investigated for the situation of TE property. Few reports advocate that Fe2O3 can be an auspicious transition metal oxide for TE application at higher temperatures as it exhibits high TPFs at elevated temperatures and ambient. Iron oxide thin films have been revealed to exhibit highest Seebeck coefficient of 1650 µV/K in the temperature expanse of 270-290 K. Electrical conductivity of 5.5 × 10³ S/m has been described in the identical thermal conditions, occasioning to a great TPF [52] of 1.5 × 10⁴ µW/m.K2. It has been mentioned that nano ZnO [50,51] can perform as efficient of thermoelectric material. In GZnNC, nano ZnO was adorned over the graphene sheet throughout its exfoliation. The staking environment of graphene sheet abridged extremely after nano ZnO adornment which reduces the tendency of graphene to graphite transformation process. Present work demonstrates the modest preparation process of GZnNC with adequate characterizations and its submission as thermoelectric material for waste energy harvesting. The composition, morphology, and structure of the as-prepared GZnNC have been characterized by Raman spectroscopy, Fourier Transform Infrared Spectroscopy (FTIR), Field Emission Scanning Electron Microscope (FESEM), High-Resolution Transmission Electron Microscopy (HRTEM) and X-ray diffraction (XRD). Further, thorough study of thermoelectric properties (electrical properties, Seebeck coefficient, power factor, thermal conductivity and figure of merit) of PVAc, PVAc/PEDOT: PSS and PEDOT: PSS with different fillers like GZnNC, graphene have been evaluated and presented extensively.
General
We have purchased graphitic flakes from Reinste nano ventures, ethanol (absolute) from AR, Merck and graphite powder, H2SO4, NaNO3, NaOH, H2O2 (30%), 0.5M zinc nitrate [Zn(NO3)2. 6H2O], 1M NaOH, polyvinylpyrrolidone from Sigma-Aldrich. The chemicals received were of analytical grades and used as such without further purifications and characterization. Milli-Q water (18 MΩ cm-1) has been used to make aqueous solutions. Sonication and microwave irradiation were conducted by using ultrasonication bath (35 kHz, Kudos) and microwave reactor (make: Raga), respectively. FESEM and HRTEM were carried out with Quanta 200, FEI and TACHNAI F-30, FEI with 300 kV field emission gun (FEG), respectively were dispersed in methanol with ultrasonication. The dispersions of nano ZnO, graphene and GZnNC were placed on TEM grid, and the solvent was evaporated to dry. FTIR and Raman's traces were collected by Nicolet 5700, Thermoscientific and Invia reflex micro-Raman, Renishaw, respectively. X-Ray diffraction analysis was conducted by X-Ray Diffractometer D8 Advance, Bruker in conjunction with Cu Kα source at an angle (2θ) expanse of 2-90º through a scan rate of 2º/min.
Synthesis of ZnO nano-particles
ZnO nanoparticles were synthesized by the previously reported method but with slight modification [53]. The synthesis was performed by preparing the alkali solution of zinc nitrate by dissolving 0.5M zinc nitrate [Zn(NO3)2. 6H2O] and 1M NaOH, in distilled water (100 ml). The solution was continuously stirred at 75ºC maintaining the pH 12. The reaction mixture was stirred for 5-6 hrs at 75ºC after addition of polyvinylpyrrolidone (PVP, 0.2 gm) to obtain the white suspension of ZnO nanoparticles. The suspension was separated by centrifugation followed by washing with distilled water and ethanol. The white precipitate obtained was annealed at 400ºC for two hours in a muffle furnace for obtaining highly nano-crystalline ZnO nanoparticles.
Conversion of graphene from graphite flake
The synthesis of graphene involves three stages [48,54]. In an initial step, graphite oxide was prepared from the flakes of graphite by Hummers method. Thermally expanded graphene oxide (TEGO) was produced in the second stage by thermal enlargement at 1050ºC (Ar, the 30s). In the third step, graphene nanosheet was achieved by hydrogen reduction of TEGO for two hours at 400°C.
Preparation of Graphene/ZnO nano-composite (GZnNC)
GZnNC was obtained by scattering 50 mg graphene through ultrasonication in ethanol after addition of pre-dispersed ZnO nanoparticles to the dispersion of graphene. The resultant dispersed combination was subjected to ultrasonication for two hours tailed by drying at room temperature to remove the solvent. GZnNC was placed over a petri dish and exposed to microwave irradiation for two minutes to have better exfoliation after drying (Scheme 1).
Thermoelectric properties
Seebeck coefficient or thermopower, electrical conductivity, thermal conductivity are the three main thermoelectric properties and useful to calculate the power factor (PF) and figure of merit (ZT). Sample preparation and its characterization were carried out by the following a methodology. Nanocomposites accompanied by polymer were made through ultrasonic dispersion of fillers (graphene and GZnNC) and PVAc water emulsion for 30 min at 35 kHz. After ultrasonication, mechanical stirring sustained for four hours at 250 rpm to get proper dispersion. Complete drying was performed by placing the sample in a vacuum oven at 105ºC for 4 hrs after casting in an aluminum tray. The dried samples were exposed to hot pressing at 120˚C in conjunction with 5 min preheating time and 3 min compression (10 T of pressure approx.). The synthesized polymer nanocomposite sheets were endangered to the determination of thermoelectric possessions. Polymer nanocomposite based on PVAc/PEDOT: PSS and PEDOT: PSS were also processed and subjected to the test (Scheme 2).
Characterization of GZnNC
XRD and FTIR analysis: The presence of ZnO nanoparticles and graphene in the GZnNC was confirmed by X-Ray diffraction scan of the samples (Figure 1). The XRD spectrum of ZnO nanoparticles obtained by sol-gel process displayed somewhat wide peaks owing to its nano-sized nature. The 2 peaks present at 25.25° (101), 37.8° (004), 47.9° (200), 53.59° (105) and 62.36° (204) confirmed the wurtzite crystal structure of ZnO. The XRD spectra of GZnNC sample showed a broad peak at 2θ =25.8° indicated a haphazard packing of graphene sheets and related to (002) plane of graphite. The FT-IR data of the GZnNC (Figure 2a) did not disclose any evidence concerning the existence of organics in the product and the corresponding peaks for graphene oxide were preoccupied. However, peaks were present at 3400 cm-1 corresponding to –OH group due to moisture and a peak at 1675 cm-1 due to skeletal vibration in sheets of graphene. The sharp peak at 2355 cm-1 could be due to the presence of adsorbed air-borne CO2 molecules. The GZnNC sample did show a peak at around 1380 cm-1 which could be due to the carbon moiety carried by the ZnO nanoparticles. This carbon moiety can be formed after the sintering process of ZnO nanoparticles which resulted in decomposition of PVP capping, producing carbon residue in the sample.
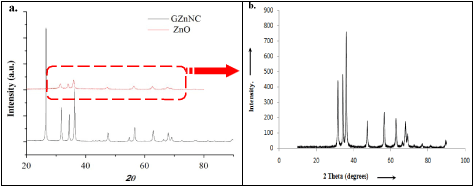
Figure 1. a) XRD profiles of graphene zinc oxide nano-composite(GZnNC) and ZnO nanoparticles b) XRD profiles of ZnO alone(enlarge view).
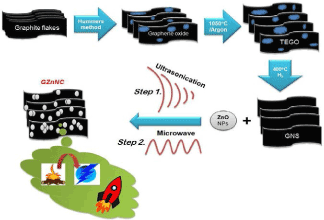
Scheme 1. Images from high-resolution IR camera during testing of sample.
Raman analysis: Figure 2 (b), (c) and (d) represents raman touches of GZnNC. The Raman spectrum of pristine graphene showed the characteristic in-plane vibration peak (G band at 1580 cm-1) which originates from sp2 carbon atoms along with primary and second order overtone of different in-plane vibration peaks D band (1350 cm-1) & 2D (2690 cm-1). It was observed that the pristine graphene was composed of multi stacked layers as the intensity of 2D band peak was less than the G band peak. The calculated ratio for I2D/IG (~0.9) for GZnNC sample was more as compared to the pristine graphene sample (~0.4). Thus, the stacking of graphene sheets decreased in the nanocomposite sample which could be a result of the presence of ZnO nanoparticles between the graphene sheets. Also, the ratio of IG /ID was 2.6 for pristine graphene and more than 5 for GZnNC sample. The defect intensity increased in the GZnNC sample as compared to pristine graphene making the composite material more nanocrystalline. It is well documented that nanocrystalline graphite phases in the graphene samplers lead to higher electron-phonon scattering, increasing the ID /IG ratio in the process [55-57].
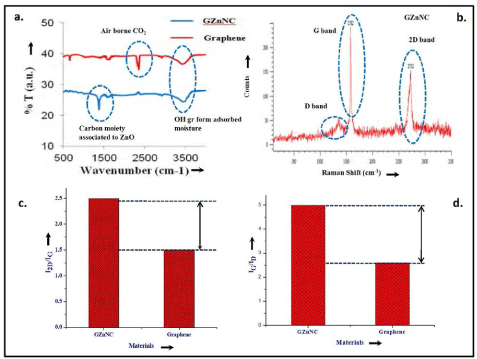
Figure 2. a) FT-IR spectrum of GZnNC (b) Raman traces of GZnNC sample (c) and (d) represent comparative bar diagram of I2D /I G and IG /ID with GZnNC and graphene, respectively.
FESEM and HRTEM analysis: Field emission scanning electron microscopy (FESEM) images of samples at different magnification (Figure 3a and 3b) highlighted the presence of exfoliated graphene sheet. The FESEM images of GZnNC samples (Figure 3c) indicated the uniform presence of ZnO nanoparticles over and around layers of graphene. It has been clearly observed that ZnO nanoparticles are existent in combined form in the GZnNC. The exfoliated nature of graphene layers in conjunction with nanosized distorted shaped ZnO will ensure enormous surface availability of the GZnNC. The great surface area of GZnNC can be vivacious for its desired thermoelectric nature. HRTEM of the GZnNC studies were conducted to identify the shape and size of ZnO nanoparticles in GZnNC (Figure 3d and 3e). The distorted shaped ZnO nanoparticles were confirmed by HRTEM images as various pebble shaped ZnO nanoparticles with a particle size in the expanse of 20-100 nm were formed after sintering. The exfoliation of graphene was also evident for the printing graphene samples (Figure 3d) which helped in providing a platform for a large number of ZnO nanoparticles to assemble on its surface (Figure 3e). It was interesting to observe that distorted rod-like, hammer-like ZnO nanoparticles were also present on the graphene sheets in GZnNC sample (Figure 3d and 3e). The presence of such shaped ZnO nanoparticles would facilitate a significant improvement in surface area in GZnNC sample which as mentioned above can play a vital role in thermoelectric applications. The clear visibility of lattice fringes with spacings d=0.281 nm (corresponding to 100 crystal plane) not only confirmed the presence of hexagonal ZnO but revealed its nanocrystalline nature.
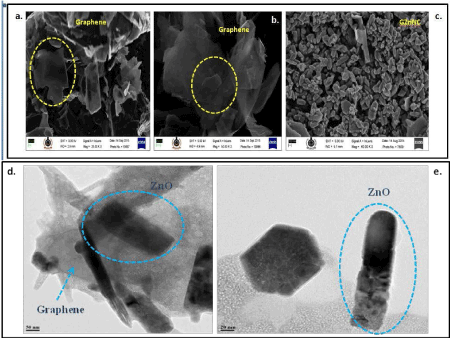
Figure 3. FE-SEM images of graphene sheets a) with magnification of 20 KX; b) with magnification of 50 KX; c) FESEM images of GZnNC nanocomposite with magnification of 60 KX. HR-TEM images of d) graphene-zinc oxide nano-composite (GZnNC) with a scale bar of 50 nm e) rod-like distorted ZnO nano particles present in the GZnNC nanocomposite (scale bar is 20 nm).
Characterization of thermoelectric properties of polymer-GZnNC composite
Seebeck Coefficient/Thermoelectric Power Measurements: To measure the thermopower using temperature, samples [54] have been prepared with a dimension of 30 mm(l) × 6 mm(w) × 1 mm(t) from polymer nanocomposite film and positioned on a thermally insulated fiberglass. At one termination of the sample along with a thermally conductive epoxy (electrical insulating 2763 Stycast), whereas the other end, a copper piece (sink of heat) made a connection with the Peltier cooling site. The temperature gradient and voltage fall through the film was dignified using thermocouples organized in series using a couple of copper wires. To make sure that the thermal gradient and the voltage fall were being dignified at the same location, two minor copper films were devoted to the polymer-GZnNC film with electrically/thermally conducting silver epoxy. The voltage wires and the thermocouple were devoted to these copper films. The thermoelectric energies were scrutinized on temperature alteration by Keithley 2182A. Peltier cooling module has been employed to change the base temperature. The thermoelectric power was dogged by two self-determining means: 1. After accomplishment of a steady state through a smeared current to the heater. 2. By fitting the linear correlation for V vs. ΔT response to a heating pulse. The deviance among both methods and between diverse experimentation was always smaller than 5%.
Electrical Resistivity Measurements: Owing to the high electrical conductive nature of the composite, delta mode four probe method was used to measure electrical resistivity. The lowest conceivable current was obtained (100mA) by Keithley 6220 and the corresponding voltage was scrutinized with nanovoltmeter of Keithley 2182A. The minutest possible current was used to evade heating of the sample at small temperatures. Polymer nanocomposite sample using a dimension 8 mm × 3 mm × 1 mm has been prepared and subjected to measure electrical conductivity.
3.2.3. Thermoelectric properties measurement set up
Figure 4. represent thermoelectric measurement set up. Figure 4a, 4b and 4c depicted the XYZ movement set up. Figure 4d correspond to actual homemade set up i.e., Keithley 2182A and Keithley 6220 for electrical conductivity and Seebeck coefficient measurement. Figure 4e and 4f represent Seebeck coefficient and electrical conductivity measurement set up respectively.
Thermal diffusion measurement: Thermal diffusivity is another important property, required for such purposes as design applications under transient heat flow conditions, determination of safe operating temperature, process control, and quality assurance. The flash method is used to measure values of thermal diffusivity, α, of a wide range of solid materials. It is particularly advantageous because of simple Figure 4: (a), (b) and (c) represent the schematic diagram of homemade set up. (d) represent actual figure. (e) Schematic representation of Seebeck coefficient measurement and (f) Electrical conductivity specimen geometry, small specimen size requirements, rapidity of measurement and ease of handling, with a single apparatus, of materials having a wide range of thermal diffusivity values over a large temperature range. Under certain strict conditions, specific heat capacity of a homogeneous isotropic opaque solid sample can be determined when the method is used in a quantitative fashion (see later section). Thermal diffusivity results, together with specific heat capacity (Cp) and density (ρ) values, can be used in many cases to derive thermal conductivity (λ), according to the relationship:
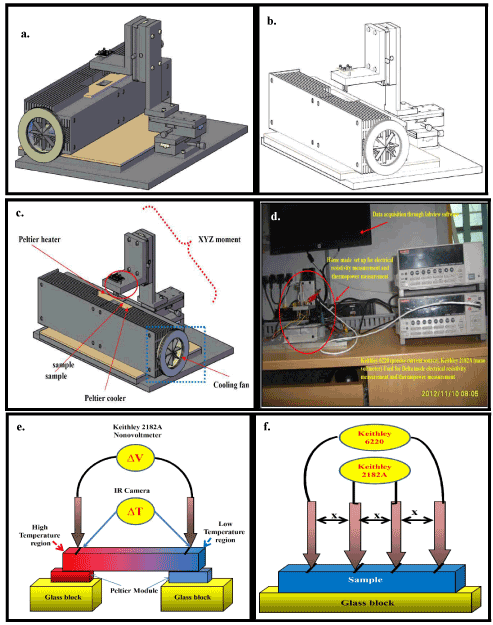
Figure 4. (a), (b) and (c) represent the schematic diagram of home made set up. (d) represent actual figure. (e) Schematic representation of seebeck coefficient measurement and (f) Electrical conductivity.
λ = α Cp ρ
Power factor(PF) and figure of merit (ZT): Power factor(PF) and figure of merit(ZT) were calculated by following the given equation. PF=S2σ, ZT= S2σT/к, where S represent Seebeck coefficient or thermopower, σ = electrical conductivity, T= absolute temperature, and к= thermal conductivity.
In this contrary, to find out the effect of conducting fillers on polymer matrix, seven compositions have been made. The comparative bar diagram of Seebeck coefficient, electrical conductivity and power factor at different PVAc/GZnNC composition (C1 to C7) have been highlighted in S1. According to the graph, electrical conductivity and power factor increases abruptly, but an insignificant upsurge in Seebeck coefficient was perceived. From composition C1 to C7, GZnNC concentration increases systematically to find out the effect of filler. Composition C7 shows maximum PF value. When graphene was used as filler in place of GZnNC. Due to conducting nature of graphene, electrical conductivity increases but a marginal change was observed in Seebeck coefficient. Hence, calculated PF increases with graphene concentration (S2). But the overall PF value is relatively low. Figure 5 depicts the variation of Seebeck coefficient, electrical conductivity, thermal conductivity, power factor and figure of merit in PEDOT: PSS/GZnNC composites. To identify the optimum composition, several compositions have been made and evaluated. The comparative chart indicates C2 composition is the optimized composition of this system which experiences maximum Seebeck coefficient, electrical conductivity and minimizes thermal conductivity. Hence, power factor and figure of merit reach to the maximum value.
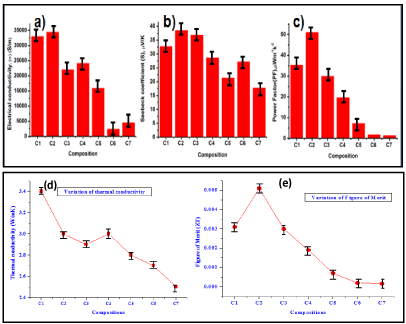
Figure 5. Comparative bar diagram of (a) Electrical conductivity, (b) Seebeck coefficient, (c) Power Factor (PF), (d) thermal conductivity and (e) Figure of merit of different composition based on PEDOT:PSS and GZnNC. [see also S3 in electronic supporting information(ESI)].
C1: PEDOT:PSS (60%) + GZnNC(40%), C2: PEDOT:PSS (50%) + GZnNC(50%), C3: PEDOT:PSS (40%) + GZnNC (60%), C4: PEDOT:PSS (30%) + GZnNC (70%), C5: PEDOT:PSS (20%) + GZnNC (80%), C6: PEDOT:PSS (10%) + GZnNC (90%), C7: PEDOT:PSS (5%) + GZnNC (95%).
When graphene is used in place of GZnNC, electrical conductivity, increases to a certain level then decreases. Seebeck coefficient decreases with graphene concentration but PF follows slightly increasing trend than decreasing trend (Figure S4). When compositions have been made in combination of PVAc/PEDOT:PSS, all the three properties were found to be inferior in compare to PEDOT:PSS based composition (Figure S5). In the course of studying the thermoelectric properties, PEDOT:PSS/GZnNC composites displayed 12 fold increase in electrical conductivity and two fold of Seebeck coefficient was perceived as compared to composite of PVAc-graphene. The calculated power factor for PEDOT:PSS/GZnNC composite increased to 50 folds than composite of PVAc-graphene. Thermal conductivity is instituted to be 3.01 W/mK. leading to ZT of 0.005. Since, nano zinc oxide were decorated over 2D graphene sheet in GZnNC, attendance of nano zinc oxide particle assistances to abolish thermally conductive network but intact electrical network. When GZnNC is employed as conducting filler, it not only decouples σ and S, but also enhances both the parameter simultaneously which is very significant finding. Though the Seebeck coefficient enhancement is minimally about electrical conductivity for PEDOT:PSS/GZnNC composite.
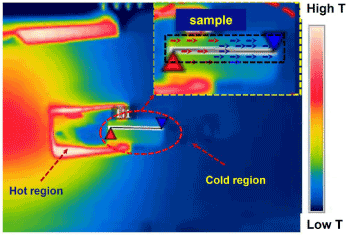
Scheme 3. Images from high-resolution IR camera during testing of sample.
Scheme 3 represents images from high-resolution IR camera during testing of sample for Seebeck coefficient measurement. The temperature gradient is developed at the ends. The red portion gives an indication of hotter part whereas blue portion indicates the collar part. The arrow indicates the movement of ‘e’ and a hence voltage was developed between the two end of the sample. IR images help to measure actual temperature at a particular probes location. S6 and S7 represent the recent findings in inorganic and organic material for the thermoelectric application. The reported values have been presented in tabulated form (S6), and corresponding references have given in S7.
This work presents a cheap and ecofriendly method for the synthesis of Graphene-Zinc oxide nanocomposite (GZnNC) by dispersing nano zinc oxide (ZnO) and graphene nano-sheets (GNS) via ultrasonication in ethanol tailed by irradiation with microwaves. GZnNC nano-composite performed as an effective energy harvesting/ thermoelectric material. Throughout the study of thermoelectric possessions, PEDOT: PSS/GZnNC composite displayed 12 fold increase in electrical conductivity and two fold increase in Seebeck coefficient as compared to PVAc-graphene composite. The resultant power factor for PEDOT: PSS/GZnNC composite increases up to 50 folds than PVAc-graphene composite. Thermal conductivity is found to be 3.01 W/mK with the ZT of 0.005. In GZnNC, nano zinc oxide was decorated over 2D graphene sheet. GZnNC not only decouples the σ and к, but enhance both σ and S. Hence PF and ZT reaches to a maximum value.
[Tabulated data of thermoelectric properties from different polymer composite, Comparative bar diagrams, Summary of thermoelectric properties of the best composite of inorganic and organic materials have included here]. See DOI: 10.1039/x0xx00000x
View supplementary data
Support for this work comes from the Defence Research Development Organization, and the authors appreciate constant support and encouragement from Director, HEMRL.
- Zhao LD, Lo SH, Zhang Y, Sun H, Tan G, et al. (2014) Ultralow thermal conductivity and high thermoelectric figure of merit in SnSe crystals. Nature 508: 373-377.
- Ballikaya S, Chi H, Salvador JR, Uher C (2013) Thermoelectric properties of Ag-doped Cu2Se and Cu2Te. J Mater Chem A 1: 12478-12484.
- Kahalyand MU, Schwingenschlögl U (2014) Thermoelectric performance enhancement of SrTiO3 by Pr doping. J Mater Chem A 2: 10379-10383.
- Nethravathi C, Rajamathi CR, Rajamathi M, Maki R, Mori T, et al. (2014) Synthesis and thermoelectric behaviour of copper telluride nanosheets. J Mater Chem A 2: 985-990.
- Lv HY, Liu HJ, Shi J, Tang XF, Uher C (2013) Optimized thermoelectric performance of Bi2Te 3 nanowires. J Mater Chem A 1: 6831-6838.
- Bux SK, Yeung MT, Toberer ES, Snyder GJ, Kaner RB, et al. (2011) Mechano chemical synthesis and thermoelectric properties of high quality magnesium silicide. J Mater Chem A 21: 12259-66.
- Basu R, Bhattacharya S, Bhatt R, Roy M, Ahmad S, et al. (2014) Improved thermoelectric performance of hot pressed nanostructured n-type SiGe bulk alloys. J Mater Chem A 2: 6922-6930.
- Jiang Q, Yan H, Khaliq J, Shen Y, Simpson K, et al. (2014) Enhancement of thermoelectric properties by atomic-scale percolation in digenite CuxS. J Mater Chem A 2: 9486-9489.
- Hu L, Gao H, Liu X, Xie H, Shen J, et al. (2012) Enhancement in thermoelectric performance of bismuth telluride based alloys by multi-scale microstructural effects. J Mater Chem 22: 16484-16490.
- Toberer ES, Rauwel P, Gariel S, Taft J, Snyder GJ (2010) Composition and the thermoelectric performance of ß-Zn4 Sb3. J Mater Chem 20: 9877-9885.
- Yan X, Poudel B, Ma Y, Liu WS, Joshi G, et al. (2010) Experimental studies on anisotropic thermoelectric properties and structures of n-type Bi2Te2.7 Se 0.3. Nano Lett 10: 3373-3378.
- Li H, Tang X, Zhang Q, Uher C (2008) Rapid preparation method of bulk nanostructured Yb 0.3Co 4 Sb12+y compounds and their improved thermoelectric performance. Appl Phys Lett 93: 252109(1-3).
- Martín-González M, Caballero-Calero O, Díaz-Chao P (2013) Energy harvesting and other trends in the field. Renew Sustainable Energy Rev 24: 288-305.
- Manzano CV, Rojas AA, Decepida M, Abad B, Feliz Y, ET AL. (2013) Thermoelectric properties of Bi2Te3 films by constant and pulsed electrodeposition. J Solid State Electrochem 17: 2071-2078.
- Aïch RB, Blouin N, Bouchard A, Leclerc M (2009) Electrical and thermoelectric properties of poly(2,7-carbazole) derivatives. Chem Mater 217: 751-757.
- Bubnova O, Khan ZU, Malti A, Braun S, Fahlman M, et al. (2011) Crispin, Optimization of the thermoelectric figure of merit in the conducting polymer poly(3,4 ethylene dioxythiophene). Nat Mater 10: 429-433.
- Park T, Park C, Kim B, Shin H, Kim E (2013) Flexible PEDOT electrodes with large thermoelectric power factors to generate electricity by the touch of fingertips. Energy Environ Sci 6: 788-792.
- Kim GH, Shao L, Zhang K, Pipe KP (2013) Engineered doping of organic semiconductors for enhanced thermoelectric efficiency. Nat Mater 12: 719-723.
- Choy CL (1977) Thermal conductivity of polymers. Polymer 18: 984-1004.
- Hu M, Yu D, Wei J (2007) Thermal conductivity determination of small polymer samples by differential scanning calorimetry. Polym Test 26: 333-337.
- Kaneko H, Ishiguro T, Takahashi A, Tsukamoto J (1993) Magneto resistance and thermo electric Power studies of metal-nonmetal transition in iodine-doped polyacetylene. Synth Met 57: 4900-4905.
- Holland ER, Pomfret SJ, Adams PN, Abell L, Monkman AP (1997) Doping dependent transport properties of polyaniline-CSA films. Synthesis and thermoelectric properties of hydrochloric acid-doped polyaniline. Synth Met 84: 777-778.
- Li J, Tang X, Li H, Yan Y, Zhang Q (2010) Synthesis and thermoelectric properties of hydrochloric acid-doped polyaniline. Synth Met 160: 1153-1158.
- Y. Qi, Z. Wang, M. Zhang, F. Yang, X. Wang (2013) Thermoelectric devices based on one-dimensional nanostructures. J Mater Chem A 1 6110-24.
- Szczech JR, Higgins JM, Jin S (2011) Enhancement of the thermoelectric properties in nanoscale and nanostructured materials. J Mater Chem 21: 4037-4055.
- Benoit R, Hornebecq V, Weill F, Lecren L, Bourrat X, et al. (2013) Bottom-up solution chemistry approaches for nanostructured thermoelectric materials. J Mater Chem A 1: 14221-14226.
- Yu C, Kim YS, Kim D, Grunlan JC (2008) Thermoelectric behavior of segregated-network polymer nanocomposites. Nano Lett 8: 4428-4432. [Crossref]
- Bounioux C, Díaz-Chao P, Campoy-Quiles M, Martín-González MS, Goñi AR, et al. (2013) Thermoelectric composites of poly (3-hexylthiophene) and carbon nanotubes with a large power factor. Energy Environ Sci 6: 918-925.
- Lu Y, Song Y, Wang F (2013) Thermoelectric properties of graphene nanosheets-modified Polyaniline hybrid nanocomposites by an in situ chemical polymerization. Mater Chem Phys 138: 238-244.
- Du Y, Shen SZ, Yang W, Donelson R, Cai K, et al. (2012) Simultaneous increase In conductivity and seebeck coefficient in a polyaniline/graphene nanosheets thermo electric nanocomposite. Synth Met 161: 2688-2692.
- Xiang J, Drzal T (2012) Templated growth of polyaniline on exfoliated graphene nanoplatelets (GNP) and its thermoelectric properties. Polymer 53: 4202-4210.
- Scholdt M, Do H, Lang J, Gall A, Colsmann A, et al. (2010) Organic semiconductors for thermoelectric applications. J Electron Mater 9: 1589-1592.
- Novoselov KS, Geim AK, Morozov SV, Jiang D, Zhang Y, et al. (2004) Electric field effect in atomically thin carbon films. Science 306: 666-669. [Crossref]
- Geim AK, Novoselov KS (2007) The rise of graphene. Nat Mater 6: 183-191. [Crossref]
- Zhang W, He W, Jing X (2010) Preparation of a stable graphene dispersion with high concentration by ultrasound. J Phys Chem B 114: 10368-10373. [Crossref]
- Novoselov KS, Jiang D, Schedin F, Booth TJ, Khotkevich VV, et al. (2005) Two-dimensional atomic crystals. Proc Natl Acad Sci U S A 102: 10451-10453. [Crossref]
- Partoens B, Peeters FM (2006) From graphene to graphite, Electronic structure around the K point. Phys Rev B 74: 075404-075415.
- Geim AK, Novoselov KS (2007) The rise of graphene. Nat Mater 6: 183-191. [Crossref]
- Geim AK (2009) Graphene: status and prospects. Science 324: 1530-1534. [Crossref]
- Park H, Lee SH, Kim FS, Choi HH, Cheong IW, et al. (2014) Enhanced thermo electric properties of PEDOT: PSS nanofilms by a chemical dedoping process. J Mater Chem A 2: 6532-6539.
- Musumeci AW, Silva GG, Liu JW, Martens WN, Waclawik ER (2007) Structure and conductivity of multi-walled carbon nanotube /poly (3-hexylthiophene) composite films. Polymer 48: 1667-1678.
- Zhao Y, Tang GS, Yu ZZ, Qi JS (2012) The effect of graphite oxide on the thermoelectric properties of polyaniline. Carbon 50: 3064-3073.
- Park YW, Lee YS, Park C, Shacklette LW, Baughman RH (1987) Thermopower and conductivity of metallic polyaniline. Solid State Commun 63: 1063-1078.
- Lee K, Cho S, Park SH, Heeger AJ, Lee CW, et al. (2006) Metallic transport in polyaniline. Nature 441: 65-68. [Crossref]
- Winey KI, Vaia RA (2007) Polymer nanocomposites. MRS Bull 32: 314-322.
- Sherman RD, Middleman LM, Jacobs SM (1983) Electron transport processes in conductor-filled polymers. Polym Eng Sci 23: 36-46.
- Kirkpatrick S (1973) Percolation and conduction. Rev Mod Phys 45: 574-588.
- Dey A, Panja S, Sikder AK, Chattopadhyay S (2015) One pot green synthesis of graphene–Iron oxide nanocomposite (GINC), an efficient material for enhancement of thermoelectric performance. RSC Adv 5: 10358-10364.
- Dey A, Nangare V, More PV, Khan MA, Khanna PK, et al. (2015) A graphene titanium dioxide nanocomposite (GTNC), one pot green synthesis and its application in a solid rocket propellant. RSC Adv 5: 63777-63785.
- Wu J, Shen X, Jiang L, Wang K, Chen K (2010) Solvothermal. Synthesis and characterization of sandwich-like graphene/ZnO nanocomposites. Appl Surf Sci 256: 2826-2830.
- Lu T, Pan L, Li H, Zhu G, Lv T, et al. (2011) Microwave-assisted synthesis of graphene-ZnO nanocomposite for electrochemical supercapacitors. J Alloys Compd 509: 5488-5492.
- Dey A, Bajpai OP, Sikder AK, Chattopadhyay S, Khan MA (2016) Recent advances in CNT/graphene based thermoelectric polymer nanocomposite: A proficient move towards wasteenergy harvesting. Renewable Sustainable Energy Rev. 53: 653-658.
- Guo L, Yang S, Yang C, Yu P, Wang J, et al. (2000) Synthesis and Characterization of poly(vinylpyrrolidone)-modified zinc oxide nanoparticles. Chem Mater 12: 2268-2274.
- Dey A, Athar J, Varma P, Prasant H, Sikder AK, et al. (2015) Graphene-iron oxide nanocomposite (GINC), an efficient catalyst for ammonium perchlorate (AP) decomposition and burn rate enhancer for AP based composite propellant. RSC Adv 5: 1950-1960.
- Dresselhaus MS, Jorio A, Hofmann M, Dresselhaus G, Saito R (2010) Perspectives on carbon nanotubes and graphene Raman spectroscopy. Nano Lett 10: 751-758. [Crossref]
- Lucchese MM, Stavale F, Ferreira EM, Vilani C, Moutinho MV, et al. (2010) Quantifying ion-induced defects and Raman relaxation length in graphene. Carbon 48: 1592-1597.
- Cançado LG, Jorio A, Ferreira EM, Stavale F, Achete CA, et al. (2011) Quantifying defects in graphene via Raman spectroscopy at different excitation energies. Nano Lett 11: 3190-3196.


